Brewster, WA Map & Demographics
Brewster Map
Brewster Overview
$18,865
PER CAPITA INCOME
$58,148
AVG FAMILY INCOME
$58,617
AVG HOUSEHOLD INCOME
15.0%
WAGE / INCOME GAP [ % ]
85.0¢/ $1
WAGE / INCOME GAP [ $ ]
0.39
INEQUALITY / GINI INDEX
2,241
TOTAL POPULATION
1,317
MALE POPULATION
924
FEMALE POPULATION
142.53
MALES / 100 FEMALES
70.16
FEMALES / 100 MALES
25.4
MEDIAN AGE
3.6
AVG FAMILY SIZE
3.1
AVG HOUSEHOLD SIZE
899
LABOR FORCE [ PEOPLE ]
64.7%
PERCENT IN LABOR FORCE
3.6%
UNEMPLOYMENT RATE
Brewster Zip Codes
Brewster Area Codes
Income in Brewster
Income Overview in Brewster
Per Capita Income in Brewster is $18,865, while median incomes of families and households are $58,148 and $58,617 respectively.
| Characteristic | Number | Measure |
| Per Capita Income | 2,241 | $18,865 |
| Median Family Income | 520 | $58,148 |
| Mean Family Income | 520 | $65,573 |
| Median Household Income | 702 | $58,617 |
| Mean Household Income | 702 | $63,034 |
| Income Deficit | 520 | $0 |
| Wage / Income Gap (%) | 2,241 | 15.05% |
| Wage / Income Gap ($) | 2,241 | 84.95¢ per $1 |
| Gini / Inequality Index | 2,241 | 0.39 |
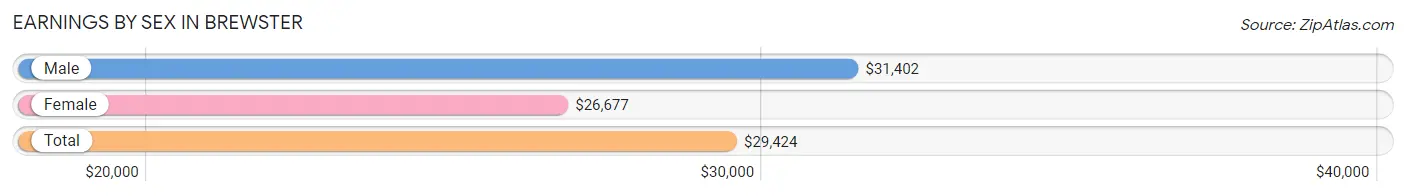
Earnings by Sex in Brewster
Average Earnings in Brewster are $29,424, $31,402 for men and $26,677 for women, a difference of 15.0%.
| Sex | Number | Average Earnings |
| Male | 458 (47.3%) | $31,402 |
| Female | 511 (52.7%) | $26,677 |
| Total | 969 (100.0%) | $29,424 |
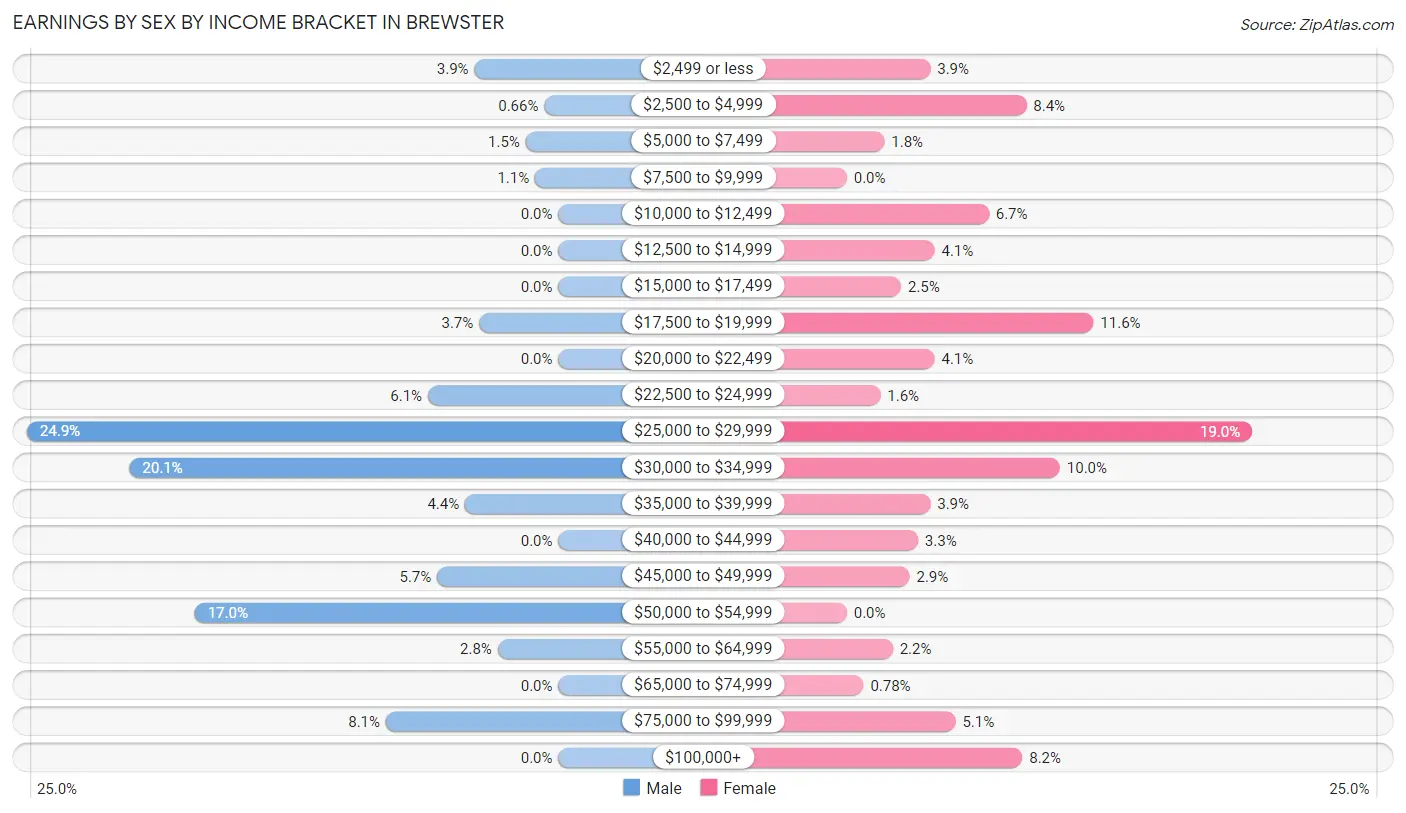
Earnings by Sex by Income Bracket in Brewster
The most common earnings brackets in Brewster are $25,000 to $29,999 for men (114 | 24.9%) and $25,000 to $29,999 for women (97 | 19.0%).
| Income | Male | Female |
| $2,499 or less | 18 (3.9%) | 20 (3.9%) |
| $2,500 to $4,999 | 3 (0.7%) | 43 (8.4%) |
| $5,000 to $7,499 | 7 (1.5%) | 9 (1.8%) |
| $7,500 to $9,999 | 5 (1.1%) | 0 (0.0%) |
| $10,000 to $12,499 | 0 (0.0%) | 34 (6.7%) |
| $12,500 to $14,999 | 0 (0.0%) | 21 (4.1%) |
| $15,000 to $17,499 | 0 (0.0%) | 13 (2.5%) |
| $17,500 to $19,999 | 17 (3.7%) | 59 (11.6%) |
| $20,000 to $22,499 | 0 (0.0%) | 21 (4.1%) |
| $22,500 to $24,999 | 28 (6.1%) | 8 (1.6%) |
| $25,000 to $29,999 | 114 (24.9%) | 97 (19.0%) |
| $30,000 to $34,999 | 92 (20.1%) | 51 (10.0%) |
| $35,000 to $39,999 | 20 (4.4%) | 20 (3.9%) |
| $40,000 to $44,999 | 0 (0.0%) | 17 (3.3%) |
| $45,000 to $49,999 | 26 (5.7%) | 15 (2.9%) |
| $50,000 to $54,999 | 78 (17.0%) | 0 (0.0%) |
| $55,000 to $64,999 | 13 (2.8%) | 11 (2.1%) |
| $65,000 to $74,999 | 0 (0.0%) | 4 (0.8%) |
| $75,000 to $99,999 | 37 (8.1%) | 26 (5.1%) |
| $100,000+ | 0 (0.0%) | 42 (8.2%) |
| Total | 458 (100.0%) | 511 (100.0%) |
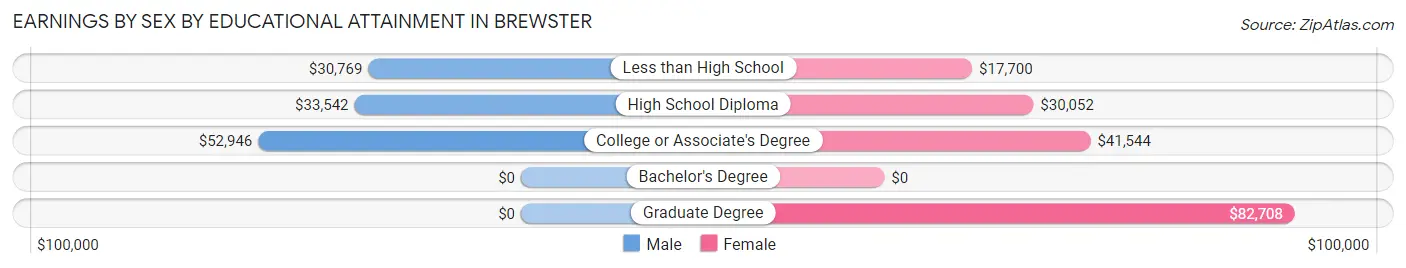
Earnings by Sex by Educational Attainment in Brewster
Average earnings in Brewster are $32,197 for men and $28,996 for women, a difference of 9.9%. Men with an educational attainment of college or associate's degree enjoy the highest average annual earnings of $52,946, while those with less than high school education earn the least with $30,769. Women with an educational attainment of graduate degree earn the most with the average annual earnings of $82,708, while those with less than high school education have the smallest earnings of $17,700.
| Educational Attainment | Male Income | Female Income |
| Less than High School | $30,769 | $17,700 |
| High School Diploma | $33,542 | $30,052 |
| College or Associate's Degree | $52,946 | $41,544 |
| Bachelor's Degree | - | - |
| Graduate Degree | - | - |
| Total | $32,197 | $28,996 |
Family Income in Brewster
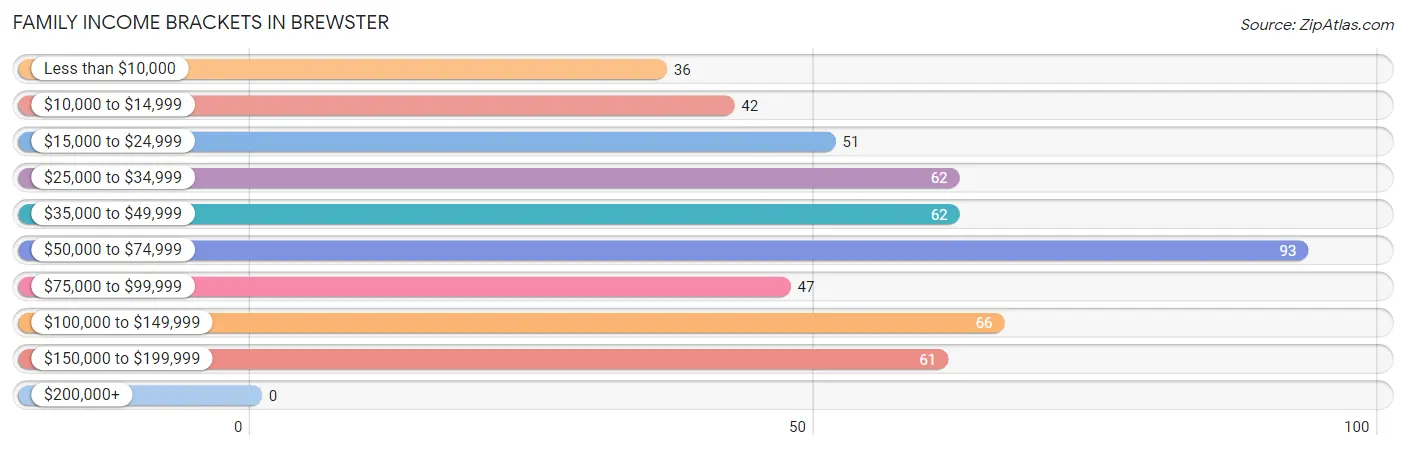
Family Income Brackets in Brewster
According to the Brewster family income data, there are 93 families falling into the $50,000 to $74,999 income range, which is the most common income bracket and makes up 17.9% of all families.
| Income Bracket | # Families | % Families |
| Less than $10,000 | 36 | 6.9% |
| $10,000 to $14,999 | 42 | 8.1% |
| $15,000 to $24,999 | 51 | 9.8% |
| $25,000 to $34,999 | 62 | 11.9% |
| $35,000 to $49,999 | 62 | 11.9% |
| $50,000 to $74,999 | 93 | 17.9% |
| $75,000 to $99,999 | 47 | 9.0% |
| $100,000 to $149,999 | 66 | 12.7% |
| $150,000 to $199,999 | 61 | 11.7% |
| $200,000+ | 0 | 0.0% |
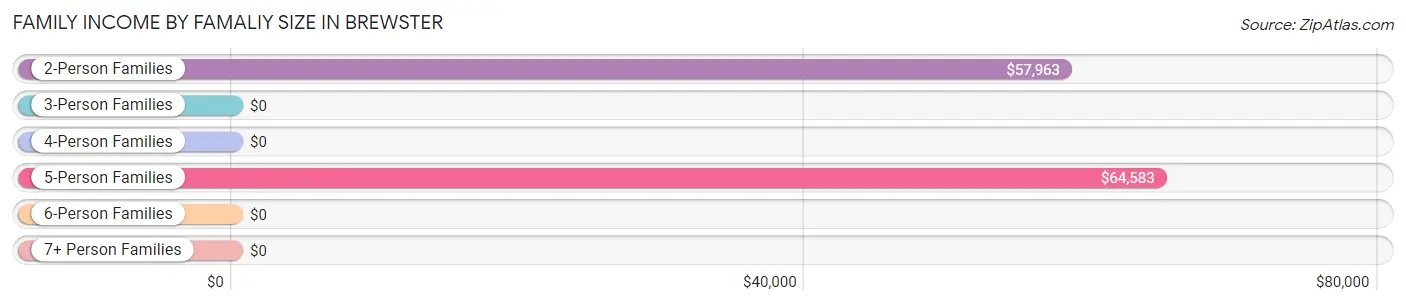
Family Income by Famaliy Size in Brewster
5-person families (119 | 22.9%) account for the highest median family income in Brewster with $64,583 per family, while 2-person families (192 | 36.9%) have the highest median income of $28,982 per family member.
| Income Bracket | # Families | Median Income |
| 2-Person Families | 192 (36.9%) | $57,963 |
| 3-Person Families | 94 (18.1%) | $0 |
| 4-Person Families | 88 (16.9%) | $0 |
| 5-Person Families | 119 (22.9%) | $64,583 |
| 6-Person Families | 27 (5.2%) | $0 |
| 7+ Person Families | 0 (0.0%) | $0 |
| Total | 520 (100.0%) | $58,148 |
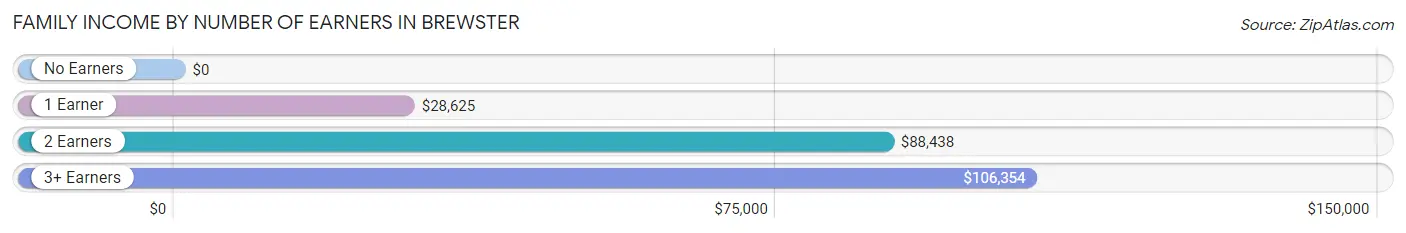
Family Income by Number of Earners in Brewster
| Number of Earners | # Families | Median Income |
| No Earners | 91 (17.5%) | $0 |
| 1 Earner | 184 (35.4%) | $28,625 |
| 2 Earners | 162 (31.1%) | $88,438 |
| 3+ Earners | 83 (16.0%) | $106,354 |
| Total | 520 (100.0%) | $58,148 |
Household Income in Brewster
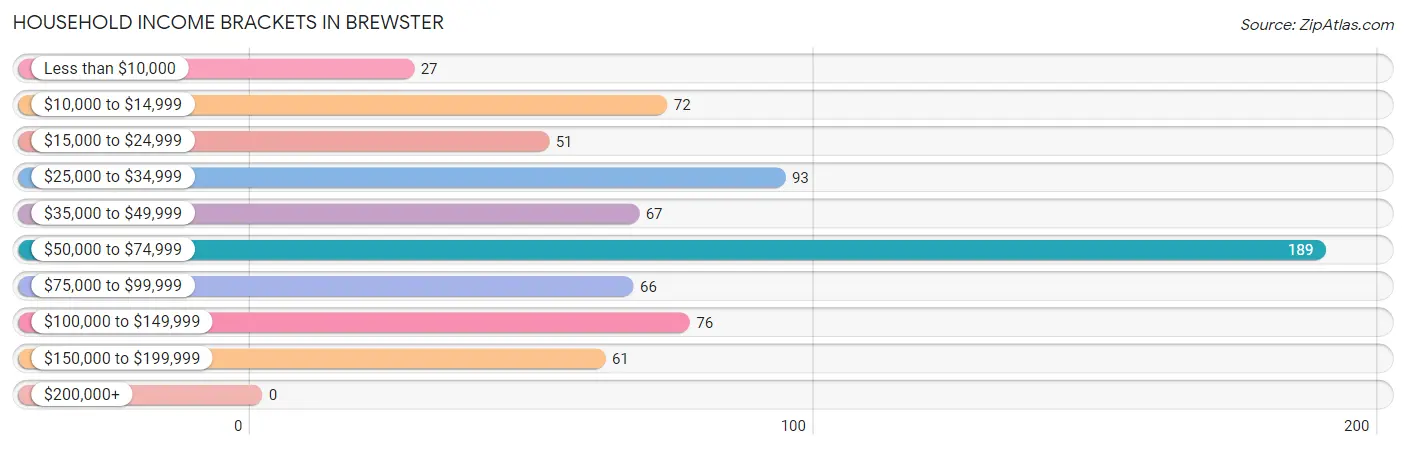
Household Income Brackets in Brewster
With 189 households falling in the category, the $50,000 to $74,999 income range is the most frequent in Brewster, accounting for 26.9% of all households.
| Income Bracket | # Households | % Households |
| Less than $10,000 | 27 | 3.8% |
| $10,000 to $14,999 | 72 | 10.3% |
| $15,000 to $24,999 | 51 | 7.3% |
| $25,000 to $34,999 | 93 | 13.2% |
| $35,000 to $49,999 | 67 | 9.5% |
| $50,000 to $74,999 | 189 | 26.9% |
| $75,000 to $99,999 | 66 | 9.4% |
| $100,000 to $149,999 | 76 | 10.8% |
| $150,000 to $199,999 | 61 | 8.7% |
| $200,000+ | 0 | 0.0% |
Household Income by Householder Age in Brewster
The median household income in Brewster is $58,617, with the highest median household income of $97,500 found in the 45 to 64 years age bracket for the primary householder. A total of 178 households (25.4%) fall into this category. Meanwhile, the 15 to 24 years age bracket for the primary householder has the lowest median household income of $0, with 42 households (6.0%) in this group.
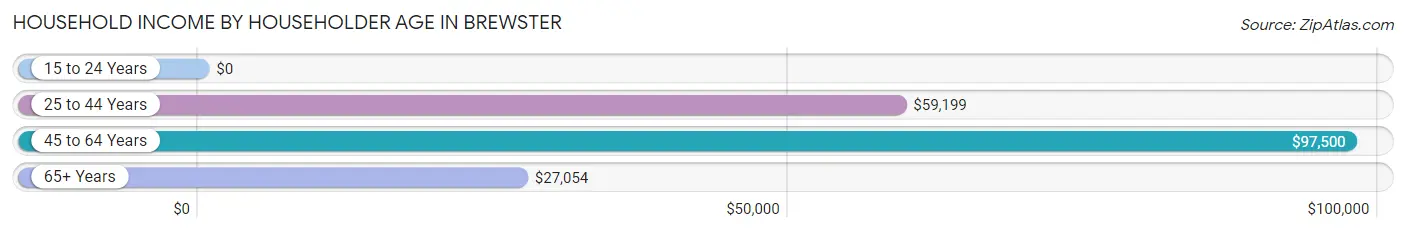
| Income Bracket | # Households | Median Income |
| 15 to 24 Years | 42 (6.0%) | $0 |
| 25 to 44 Years | 337 (48.0%) | $59,199 |
| 45 to 64 Years | 178 (25.4%) | $97,500 |
| 65+ Years | 145 (20.7%) | $27,054 |
| Total | 702 (100.0%) | $58,617 |
Poverty in Brewster
Income Below Poverty by Sex and Age in Brewster
With 34.2% poverty level for males and 25.9% for females among the residents of Brewster, 12 to 14 year old males and 65 to 74 year old females are the most vulnerable to poverty, with 72 males (100.0%) and 50 females (73.5%) in their respective age groups living below the poverty level.
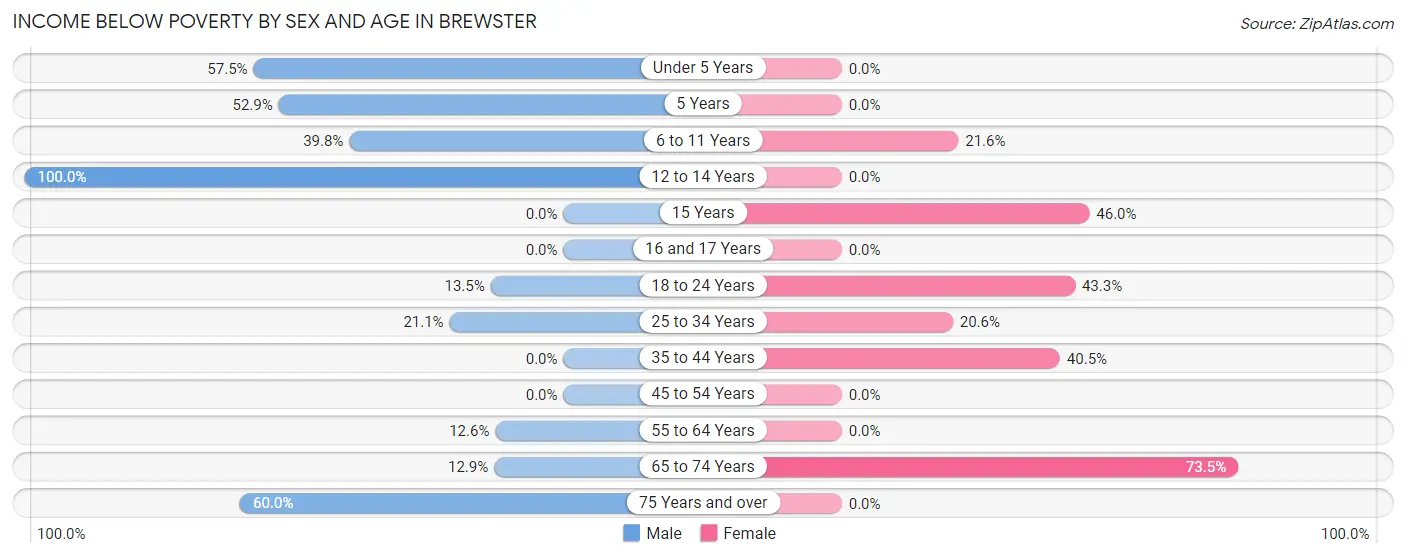
| Age Bracket | Male | Female |
| Under 5 Years | 149 (57.5%) | 0 (0.0%) |
| 5 Years | 37 (52.9%) | 0 (0.0%) |
| 6 to 11 Years | 95 (39.8%) | 16 (21.6%) |
| 12 to 14 Years | 72 (100.0%) | 0 (0.0%) |
| 15 Years | 0 (0.0%) | 17 (46.0%) |
| 16 and 17 Years | 0 (0.0%) | 0 (0.0%) |
| 18 to 24 Years | 5 (13.5%) | 58 (43.3%) |
| 25 to 34 Years | 37 (21.1%) | 41 (20.6%) |
| 35 to 44 Years | 0 (0.0%) | 51 (40.5%) |
| 45 to 54 Years | 0 (0.0%) | 0 (0.0%) |
| 55 to 64 Years | 11 (12.6%) | 0 (0.0%) |
| 65 to 74 Years | 9 (12.9%) | 50 (73.5%) |
| 75 Years and over | 27 (60.0%) | 0 (0.0%) |
| Total | 442 (34.2%) | 233 (25.9%) |
Income Above Poverty by Sex and Age in Brewster
According to the poverty statistics in Brewster, males aged 15 years and females aged under 5 years are the age groups that are most secure financially, with 100.0% of males and 100.0% of females in these age groups living above the poverty line.
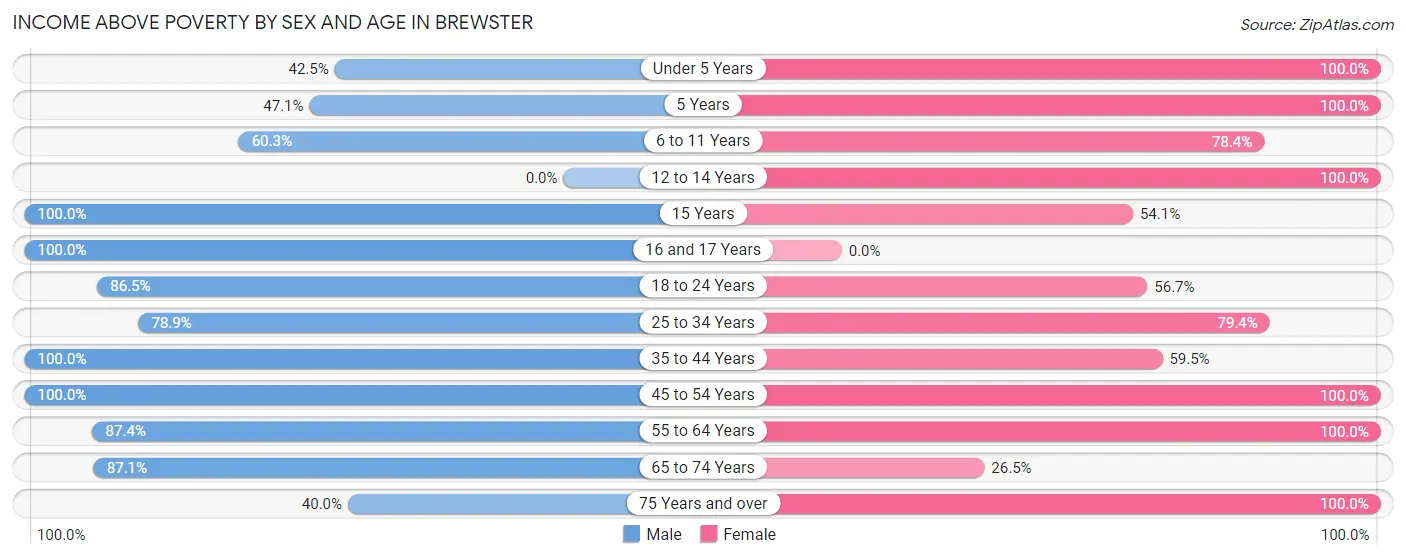
| Age Bracket | Male | Female |
| Under 5 Years | 110 (42.5%) | 50 (100.0%) |
| 5 Years | 33 (47.1%) | 14 (100.0%) |
| 6 to 11 Years | 144 (60.3%) | 58 (78.4%) |
| 12 to 14 Years | 0 (0.0%) | 16 (100.0%) |
| 15 Years | 20 (100.0%) | 20 (54.0%) |
| 16 and 17 Years | 64 (100.0%) | 0 (0.0%) |
| 18 to 24 Years | 32 (86.5%) | 76 (56.7%) |
| 25 to 34 Years | 138 (78.9%) | 158 (79.4%) |
| 35 to 44 Years | 92 (100.0%) | 75 (59.5%) |
| 45 to 54 Years | 62 (100.0%) | 48 (100.0%) |
| 55 to 64 Years | 76 (87.4%) | 98 (100.0%) |
| 65 to 74 Years | 61 (87.1%) | 18 (26.5%) |
| 75 Years and over | 18 (40.0%) | 35 (100.0%) |
| Total | 850 (65.8%) | 666 (74.1%) |
Income Below Poverty Among Married-Couple Families in Brewster
The poverty statistics for married-couple families in Brewster show that 10.0% or 24 of the total 239 families live below the poverty line. Families with no children have the highest poverty rate of 18.0%, comprising of 24 families. On the other hand, families with 1 or 2 children have the lowest poverty rate of 0.0%, which includes 0 families.
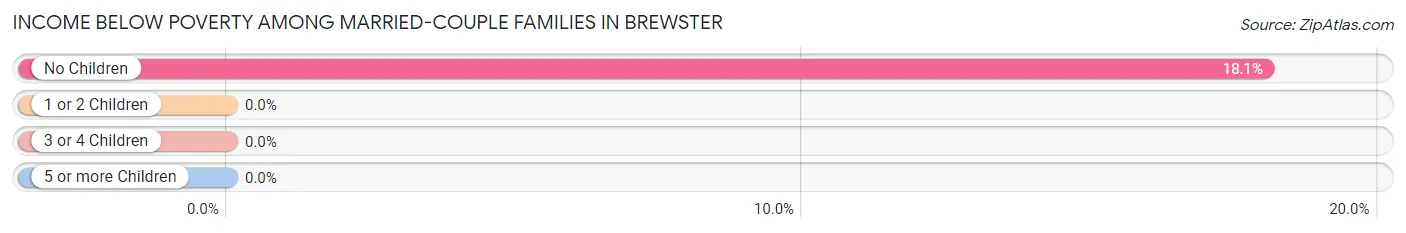
| Children | Above Poverty | Below Poverty |
| No Children | 109 (82.0%) | 24 (18.0%) |
| 1 or 2 Children | 29 (100.0%) | 0 (0.0%) |
| 3 or 4 Children | 77 (100.0%) | 0 (0.0%) |
| 5 or more Children | 0 (0.0%) | 0 (0.0%) |
| Total | 215 (90.0%) | 24 (10.0%) |
Income Below Poverty Among Single-Parent Households in Brewster
According to the poverty data in Brewster, 46.3% or 37 single-father households and 43.3% or 87 single-mother households are living below the poverty line. Among single-father households, those with 3 or 4 children have the highest poverty rate, with 20 households (100.0%) experiencing poverty. Likewise, among single-mother households, those with 3 or 4 children have the highest poverty rate, with 43 households (69.4%) falling below the poverty line.
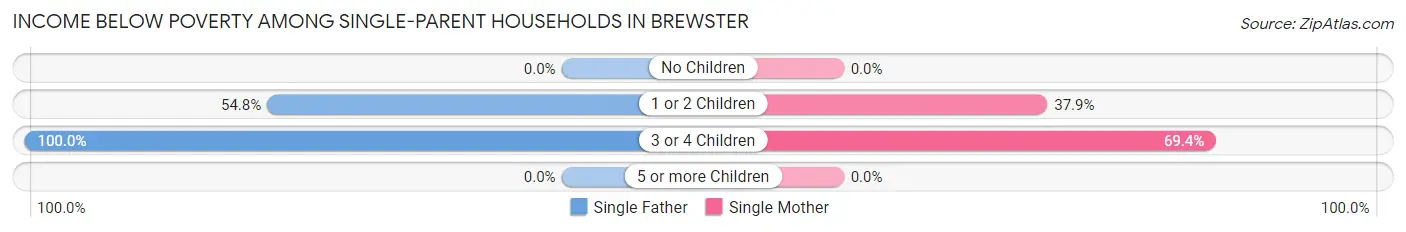
| Children | Single Father | Single Mother |
| No Children | 0 (0.0%) | 0 (0.0%) |
| 1 or 2 Children | 17 (54.8%) | 44 (37.9%) |
| 3 or 4 Children | 20 (100.0%) | 43 (69.4%) |
| 5 or more Children | 0 (0.0%) | 0 (0.0%) |
| Total | 37 (46.3%) | 87 (43.3%) |
Income Below Poverty Among Married-Couple vs Single-Parent Households in Brewster
The poverty data for Brewster shows that 24 of the married-couple family households (10.0%) and 124 of the single-parent households (44.1%) are living below the poverty level. Within the married-couple family households, those with no children have the highest poverty rate, with 24 households (18.0%) falling below the poverty line. Among the single-parent households, those with 3 or 4 children have the highest poverty rate, with 63 household (76.8%) living below poverty.
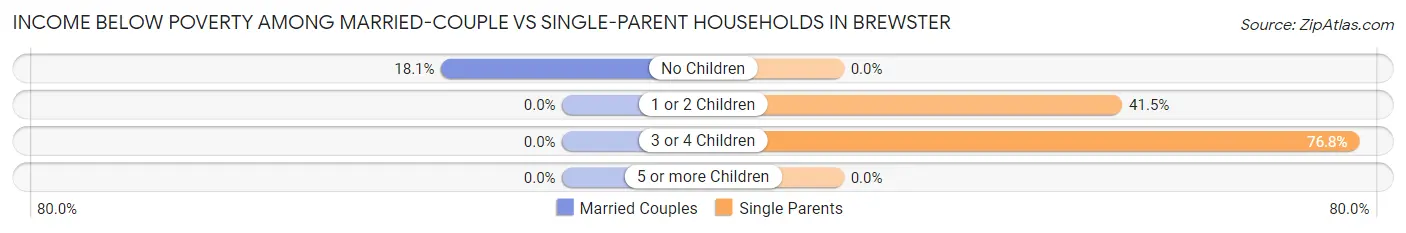
| Children | Married-Couple Families | Single-Parent Households |
| No Children | 24 (18.0%) | 0 (0.0%) |
| 1 or 2 Children | 0 (0.0%) | 61 (41.5%) |
| 3 or 4 Children | 0 (0.0%) | 63 (76.8%) |
| 5 or more Children | 0 (0.0%) | 0 (0.0%) |
| Total | 24 (10.0%) | 124 (44.1%) |
Race in Brewster
The most populous races in Brewster are Hispanic or Latino (1,859 | 83.0%), Some other Race (966 | 43.1%), and White / Caucasian (904 | 40.3%).
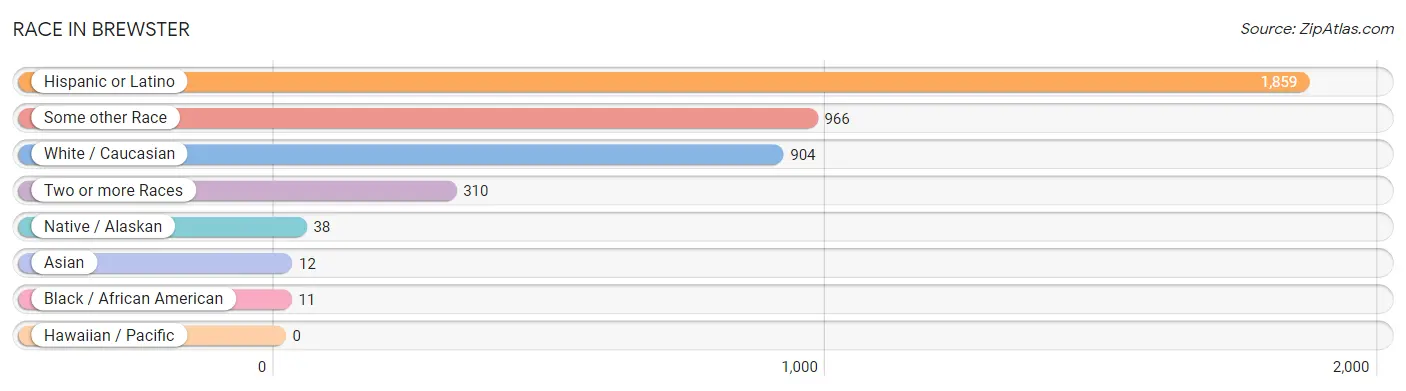
| Race | # Population | % Population |
| Asian | 12 | 0.5% |
| Black / African American | 11 | 0.5% |
| Hawaiian / Pacific | 0 | 0.0% |
| Hispanic or Latino | 1,859 | 83.0% |
| Native / Alaskan | 38 | 1.7% |
| White / Caucasian | 904 | 40.3% |
| Two or more Races | 310 | 13.8% |
| Some other Race | 966 | 43.1% |
| Total | 2,241 | 100.0% |
Ancestry in Brewster
The most populous ancestries reported in Brewster are Mexican (1,799 | 80.3%), English (90 | 4.0%), German (63 | 2.8%), Central American (33 | 1.5%), and Guatemalan (33 | 1.5%), together accounting for 90.1% of all Brewster residents.
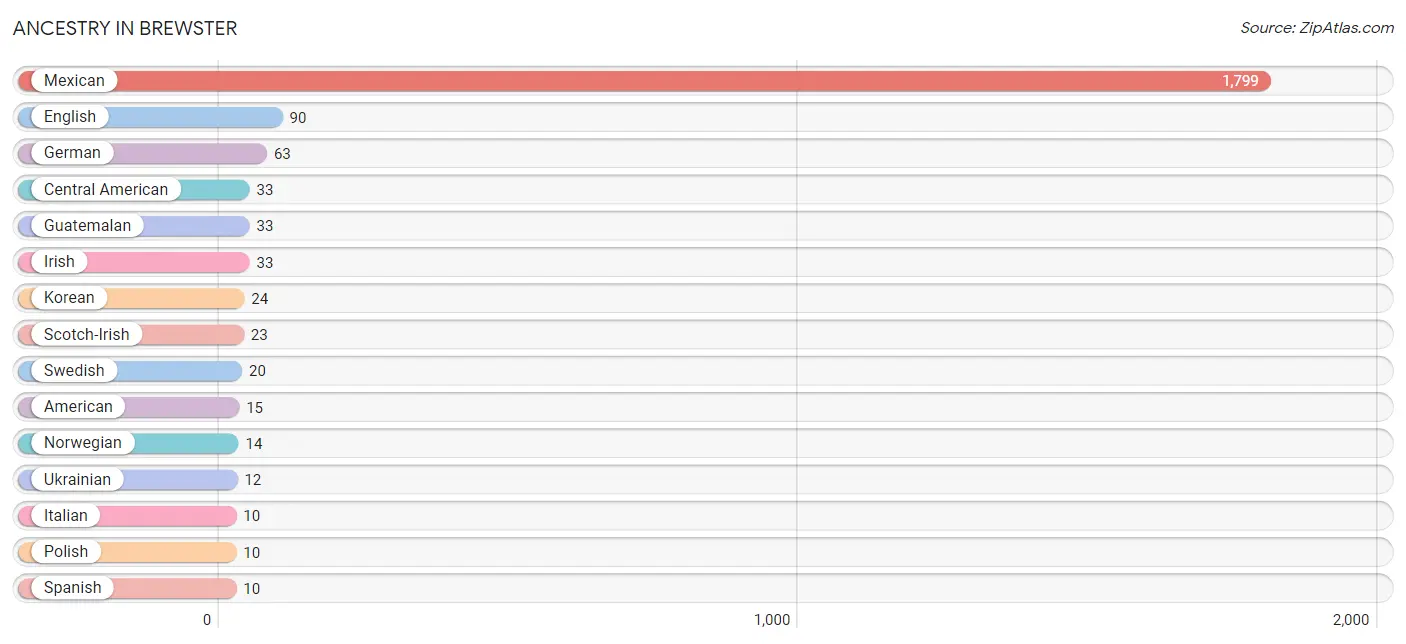
| Ancestry | # Population | % Population |
| American | 15 | 0.7% |
| Central American | 33 | 1.5% |
| English | 90 | 4.0% |
| French | 9 | 0.4% |
| German | 63 | 2.8% |
| Guatemalan | 33 | 1.5% |
| Irish | 33 | 1.5% |
| Italian | 10 | 0.4% |
| Korean | 24 | 1.1% |
| Mexican | 1,799 | 80.3% |
| Norwegian | 14 | 0.6% |
| Polish | 10 | 0.4% |
| Scandinavian | 4 | 0.2% |
| Scotch-Irish | 23 | 1.0% |
| Slovak | 9 | 0.4% |
| Spanish | 10 | 0.4% |
| Swedish | 20 | 0.9% |
| Ukrainian | 12 | 0.5% | View All 18 Rows |
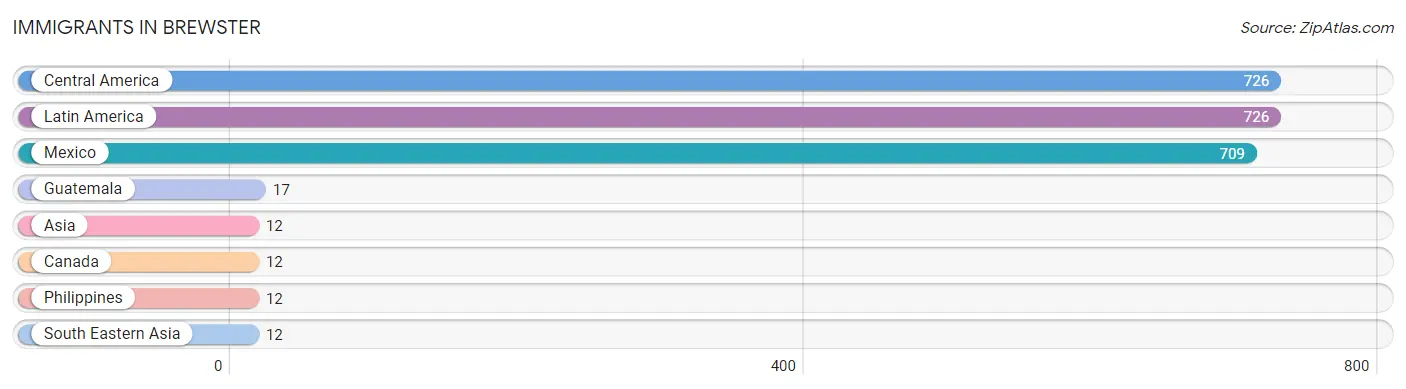
Immigrants in Brewster
The most numerous immigrant groups reported in Brewster came from Central America (726 | 32.4%), Latin America (726 | 32.4%), Mexico (709 | 31.6%), Guatemala (17 | 0.8%), and Asia (12 | 0.5%), together accounting for 97.7% of all Brewster residents.
| Immigration Origin | # Population | % Population |
| Asia | 12 | 0.5% |
| Canada | 12 | 0.5% |
| Central America | 726 | 32.4% |
| Guatemala | 17 | 0.8% |
| Latin America | 726 | 32.4% |
| Mexico | 709 | 31.6% |
| Philippines | 12 | 0.5% |
| South Eastern Asia | 12 | 0.5% | View All 8 Rows |
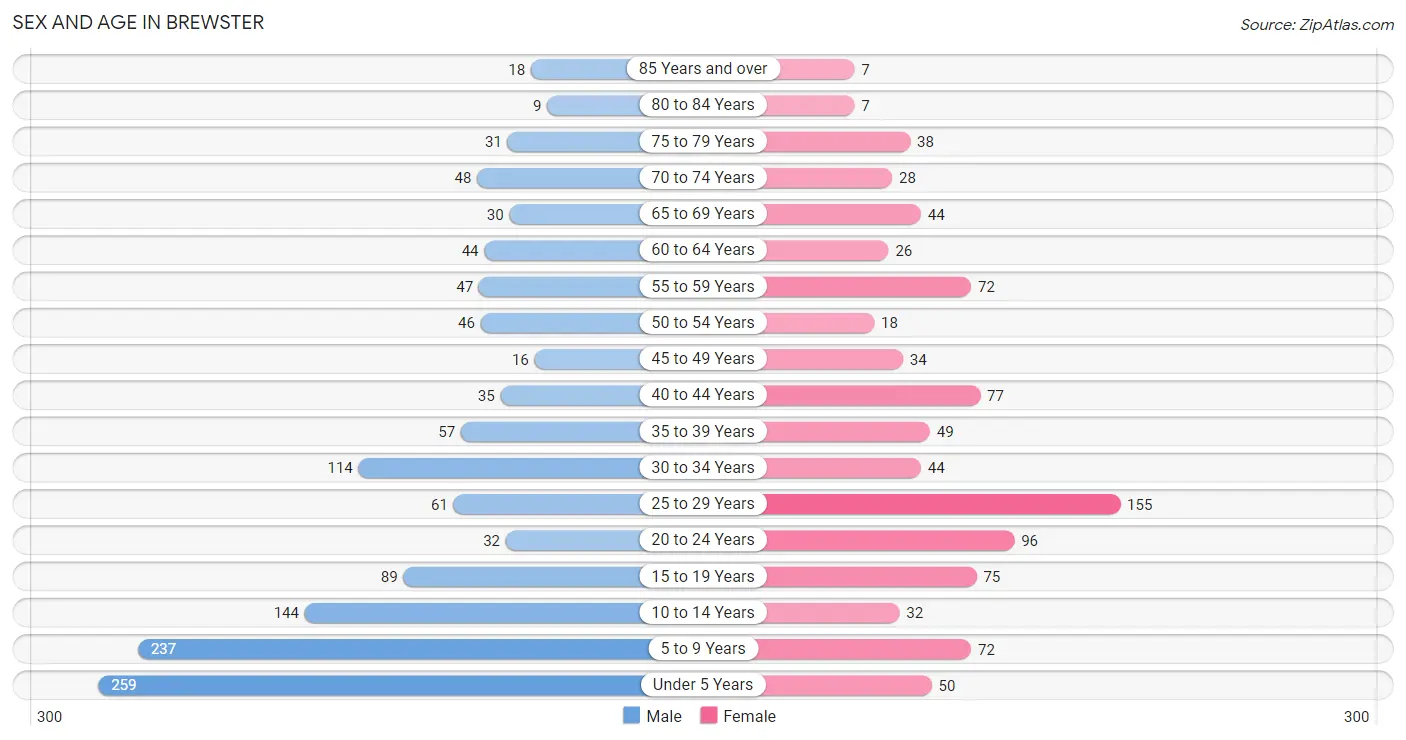
Sex and Age in Brewster
Sex and Age in Brewster
The most populous age groups in Brewster are Under 5 Years (259 | 19.7%) for men and 25 to 29 Years (155 | 16.8%) for women.
| Age Bracket | Male | Female |
| Under 5 Years | 259 (19.7%) | 50 (5.4%) |
| 5 to 9 Years | 237 (18.0%) | 72 (7.8%) |
| 10 to 14 Years | 144 (10.9%) | 32 (3.5%) |
| 15 to 19 Years | 89 (6.8%) | 75 (8.1%) |
| 20 to 24 Years | 32 (2.4%) | 96 (10.4%) |
| 25 to 29 Years | 61 (4.6%) | 155 (16.8%) |
| 30 to 34 Years | 114 (8.7%) | 44 (4.8%) |
| 35 to 39 Years | 57 (4.3%) | 49 (5.3%) |
| 40 to 44 Years | 35 (2.7%) | 77 (8.3%) |
| 45 to 49 Years | 16 (1.2%) | 34 (3.7%) |
| 50 to 54 Years | 46 (3.5%) | 18 (1.9%) |
| 55 to 59 Years | 47 (3.6%) | 72 (7.8%) |
| 60 to 64 Years | 44 (3.3%) | 26 (2.8%) |
| 65 to 69 Years | 30 (2.3%) | 44 (4.8%) |
| 70 to 74 Years | 48 (3.6%) | 28 (3.0%) |
| 75 to 79 Years | 31 (2.4%) | 38 (4.1%) |
| 80 to 84 Years | 9 (0.7%) | 7 (0.8%) |
| 85 Years and over | 18 (1.4%) | 7 (0.8%) |
| Total | 1,317 (100.0%) | 924 (100.0%) |
Families and Households in Brewster
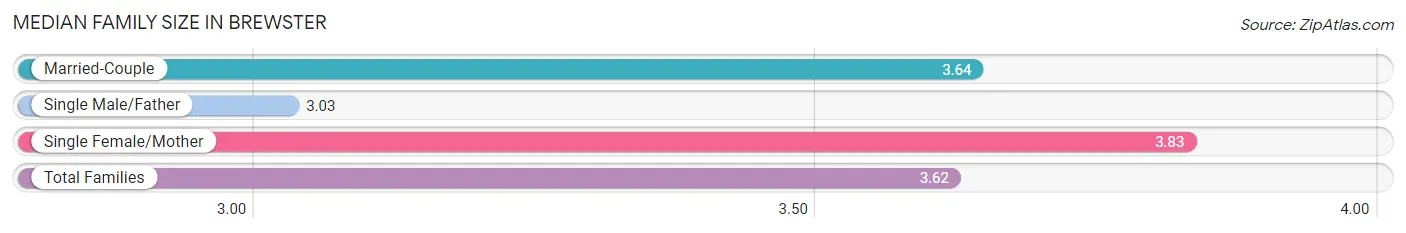
Median Family Size in Brewster
The median family size in Brewster is 3.62 persons per family, with single female/mother families (201 | 38.7%) accounting for the largest median family size of 3.83 persons per family. On the other hand, single male/father families (80 | 15.4%) represent the smallest median family size with 3.03 persons per family.
| Family Type | # Families | Family Size |
| Married-Couple | 239 (46.0%) | 3.64 |
| Single Male/Father | 80 (15.4%) | 3.03 |
| Single Female/Mother | 201 (38.7%) | 3.83 |
| Total Families | 520 (100.0%) | 3.62 |
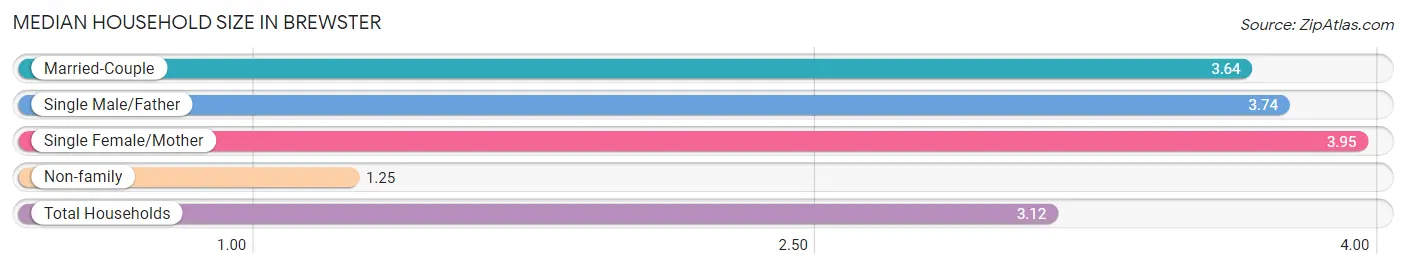
Median Household Size in Brewster
The median household size in Brewster is 3.12 persons per household, with single female/mother households (201 | 28.6%) accounting for the largest median household size of 3.95 persons per household. non-family households (182 | 25.9%) represent the smallest median household size with 1.25 persons per household.
| Household Type | # Households | Household Size |
| Married-Couple | 239 (34.1%) | 3.64 |
| Single Male/Father | 80 (11.4%) | 3.74 |
| Single Female/Mother | 201 (28.6%) | 3.95 |
| Non-family | 182 (25.9%) | 1.25 |
| Total Households | 702 (100.0%) | 3.12 |
Household Size by Marriage Status in Brewster
Out of a total of 702 households in Brewster, 520 (74.1%) are family households, while 182 (25.9%) are nonfamily households. The most numerous type of family households are 2-person households, comprising 171, and the most common type of nonfamily households are 1-person households, comprising 138.
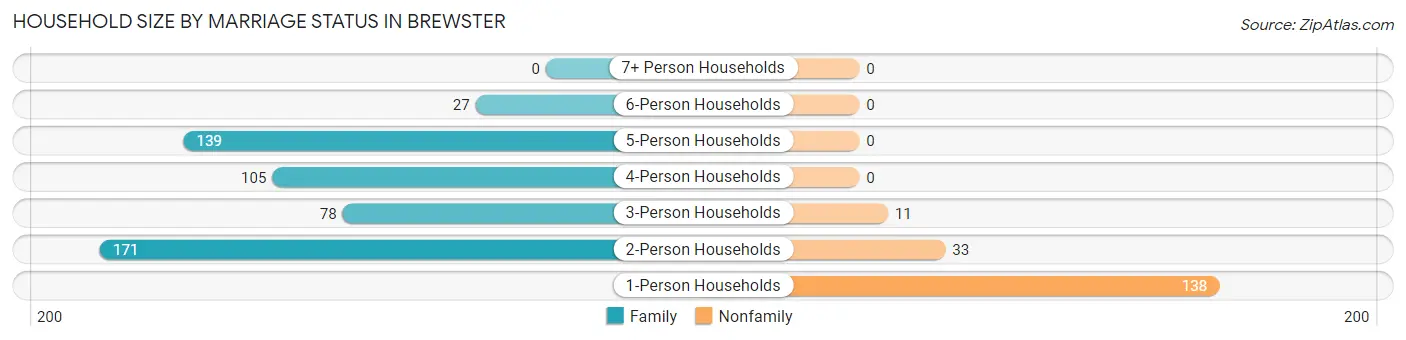
| Household Size | Family Households | Nonfamily Households |
| 1-Person Households | - | 138 (19.7%) |
| 2-Person Households | 171 (24.4%) | 33 (4.7%) |
| 3-Person Households | 78 (11.1%) | 11 (1.6%) |
| 4-Person Households | 105 (15.0%) | 0 (0.0%) |
| 5-Person Households | 139 (19.8%) | 0 (0.0%) |
| 6-Person Households | 27 (3.8%) | 0 (0.0%) |
| 7+ Person Households | 0 (0.0%) | 0 (0.0%) |
| Total | 520 (74.1%) | 182 (25.9%) |
Female Fertility in Brewster
Fertility by Age in Brewster
Average fertility rate in Brewster is 192.0 births per 1,000 women. Women in the age bracket of 35 to 50 years have the highest fertility rate with 244.0 births per 1,000 women. Women in the age bracket of 20 to 34 years acount for 61.8% of all women with births.
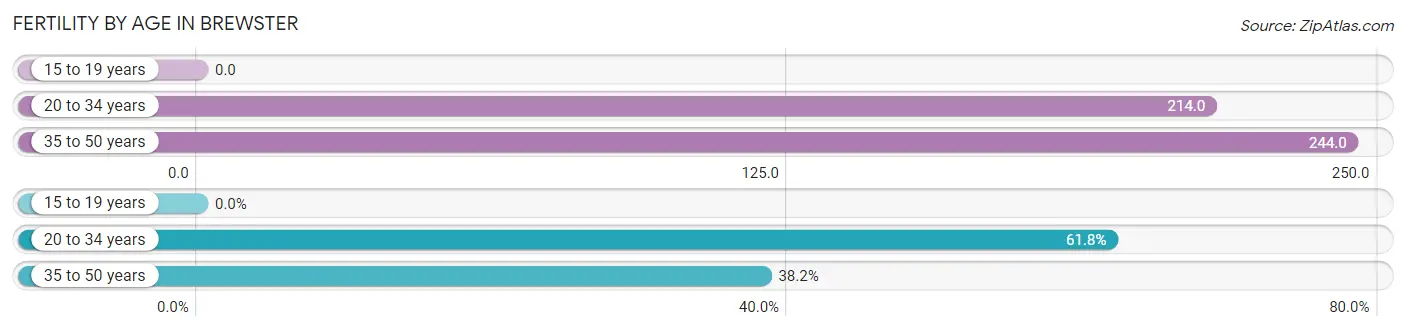
| Age Bracket | Women with Births | Births / 1,000 Women |
| 15 to 19 years | 0 (0.0%) | 0.0 |
| 20 to 34 years | 63 (61.8%) | 214.0 |
| 35 to 50 years | 39 (38.2%) | 244.0 |
| Total | 102 (100.0%) | 192.0 |
Fertility by Age by Marriage Status in Brewster
32.4% of women with births (102) in Brewster are married. The highest percentage of unmarried women with births falls into 20 to 34 years age bracket with 100.0% of them unmarried at the time of birth, while the lowest percentage of unmarried women with births belong to 35 to 50 years age bracket with 15.4% of them unmarried.
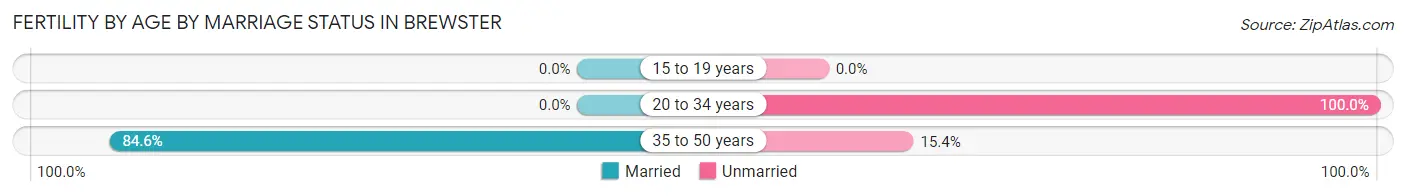
| Age Bracket | Married | Unmarried |
| 15 to 19 years | 0 (0.0%) | 0 (0.0%) |
| 20 to 34 years | 0 (0.0%) | 63 (100.0%) |
| 35 to 50 years | 33 (84.6%) | 6 (15.4%) |
| Total | 33 (32.4%) | 69 (67.6%) |
Fertility by Education in Brewster
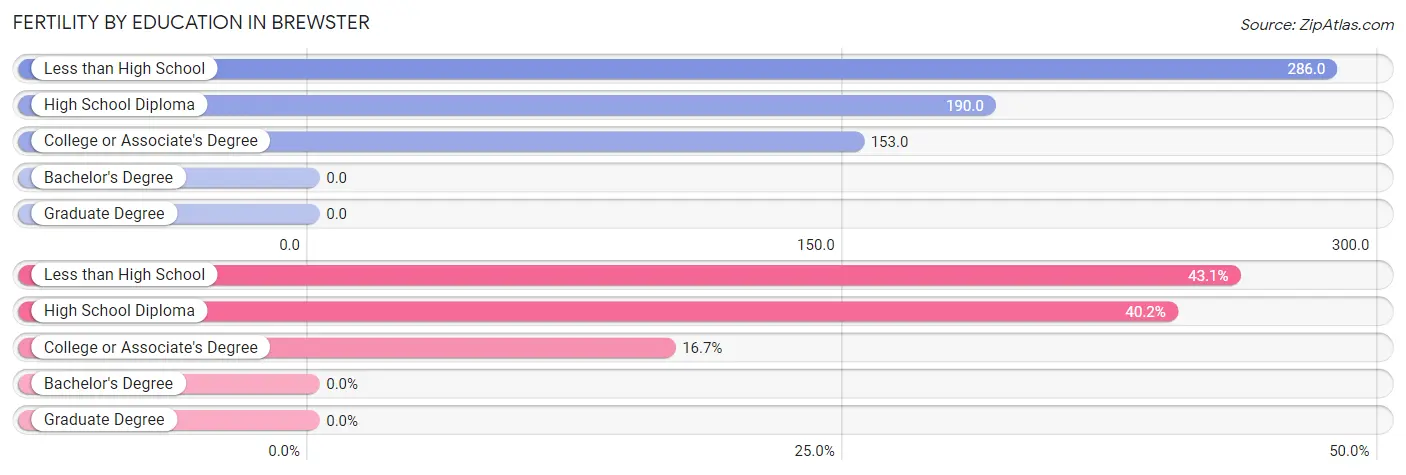
| Educational Attainment | Women with Births | Births / 1,000 Women |
| Less than High School | 44 (43.1%) | 286.0 |
| High School Diploma | 41 (40.2%) | 190.0 |
| College or Associate's Degree | 17 (16.7%) | 153.0 |
| Bachelor's Degree | 0 (0.0%) | 0.0 |
| Graduate Degree | 0 (0.0%) | 0.0 |
| Total | 102 (100.0%) | 192.0 |
Fertility by Education by Marriage Status in Brewster
67.6% of women with births in Brewster are unmarried. Women with the educational attainment of less than high school are most likely to be married with 75.0% of them married at childbirth, while women with the educational attainment of high school diploma are least likely to be married with 100.0% of them unmarried at childbirth.
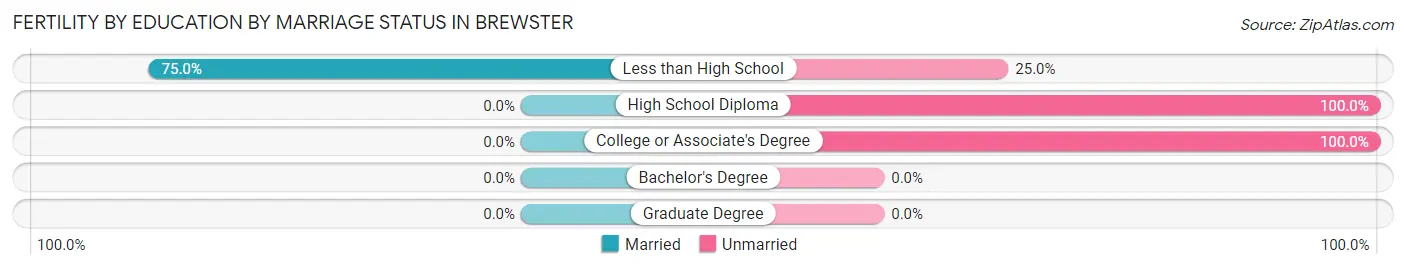
| Educational Attainment | Married | Unmarried |
| Less than High School | 33 (75.0%) | 11 (25.0%) |
| High School Diploma | 0 (0.0%) | 41 (100.0%) |
| College or Associate's Degree | 0 (0.0%) | 17 (100.0%) |
| Bachelor's Degree | 0 (0.0%) | 0 (0.0%) |
| Graduate Degree | 0 (0.0%) | 0 (0.0%) |
| Total | 33 (32.4%) | 69 (67.6%) |
Employment Characteristics in Brewster
Employment by Class of Employer in Brewster
Among the 842 employed individuals in Brewster, private company employees (662 | 78.6%), local government employees (67 | 8.0%), and state government employees (41 | 4.9%) make up the most common classes of employment.
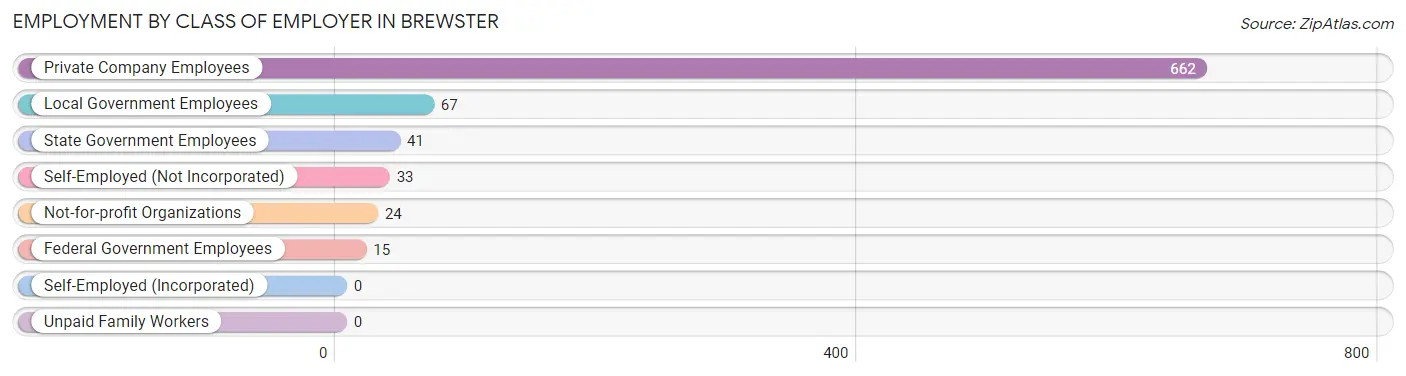
| Employer Class | # Employees | % Employees |
| Private Company Employees | 662 | 78.6% |
| Self-Employed (Incorporated) | 0 | 0.0% |
| Self-Employed (Not Incorporated) | 33 | 3.9% |
| Not-for-profit Organizations | 24 | 2.9% |
| Local Government Employees | 67 | 8.0% |
| State Government Employees | 41 | 4.9% |
| Federal Government Employees | 15 | 1.8% |
| Unpaid Family Workers | 0 | 0.0% |
| Total | 842 | 100.0% |
Employment Status by Age in Brewster
According to the labor force statistics for Brewster, out of the total population over 16 years of age (1,390), 64.7% or 899 individuals are in the labor force, with 3.6% or 32 of them unemployed. The age group with the highest labor force participation rate is 55 to 59 years, with 100.0% or 119 individuals in the labor force. Within the labor force, the 65 to 74 years age range has the highest percentage of unemployed individuals, with 23.7% or 9 of them being unemployed.
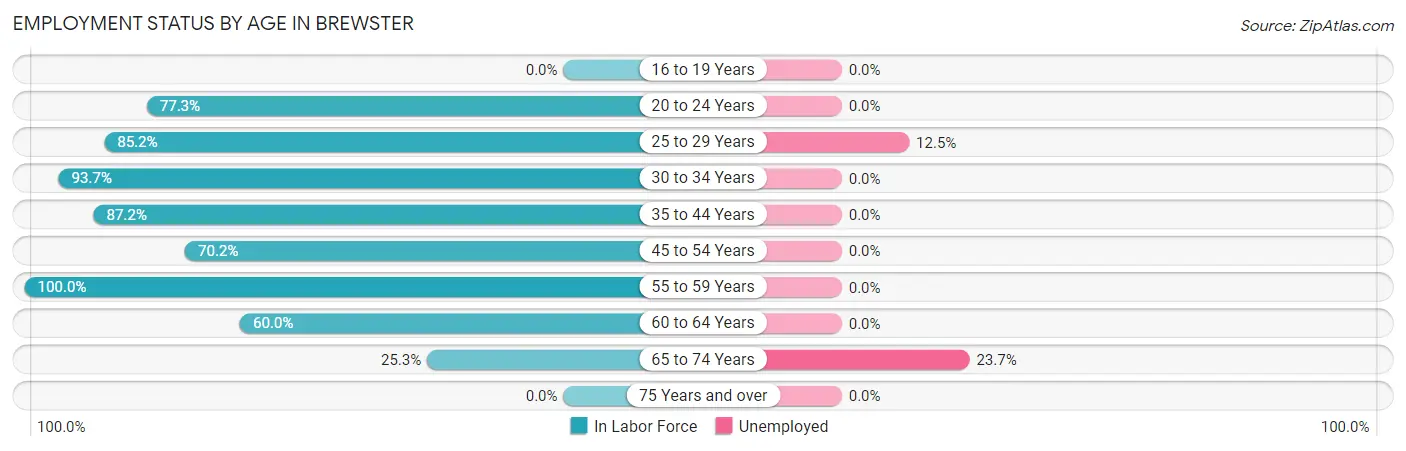
| Age Bracket | In Labor Force | Unemployed |
| 16 to 19 Years | 0 (0.0%) | 0 (0.0%) |
| 20 to 24 Years | 99 (77.3%) | 0 (0.0%) |
| 25 to 29 Years | 184 (85.2%) | 23 (12.5%) |
| 30 to 34 Years | 148 (93.7%) | 0 (0.0%) |
| 35 to 44 Years | 190 (87.2%) | 0 (0.0%) |
| 45 to 54 Years | 80 (70.2%) | 0 (0.0%) |
| 55 to 59 Years | 119 (100.0%) | 0 (0.0%) |
| 60 to 64 Years | 42 (60.0%) | 0 (0.0%) |
| 65 to 74 Years | 38 (25.3%) | 9 (23.7%) |
| 75 Years and over | 0 (0.0%) | 0 (0.0%) |
| Total | 899 (64.7%) | 32 (3.6%) |
Employment Status by Educational Attainment in Brewster
According to labor force statistics for Brewster, 85.3% of individuals (763) out of the total population between 25 and 64 years of age (895) are in the labor force, with 3.0% or 23 of them being unemployed. The group with the highest labor force participation rate are those with the educational attainment of less than high school, with 92.7% or 304 individuals in the labor force. Within the labor force, individuals with less than high school education have the highest percentage of unemployment, with 7.6% or 23 of them being unemployed.
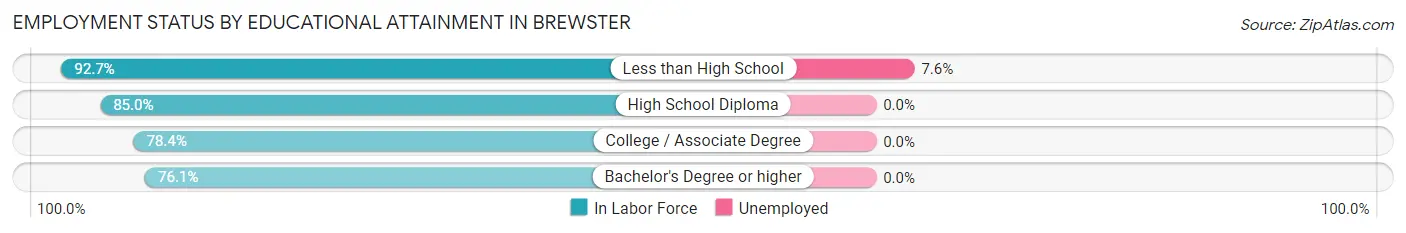
| Educational Attainment | In Labor Force | Unemployed |
| Less than High School | 304 (92.7%) | 25 (7.6%) |
| High School Diploma | 215 (85.0%) | 0 (0.0%) |
| College / Associate Degree | 174 (78.4%) | 0 (0.0%) |
| Bachelor's Degree or higher | 70 (76.1%) | 0 (0.0%) |
| Total | 763 (85.3%) | 27 (3.0%) |
Employment Occupations by Sex in Brewster
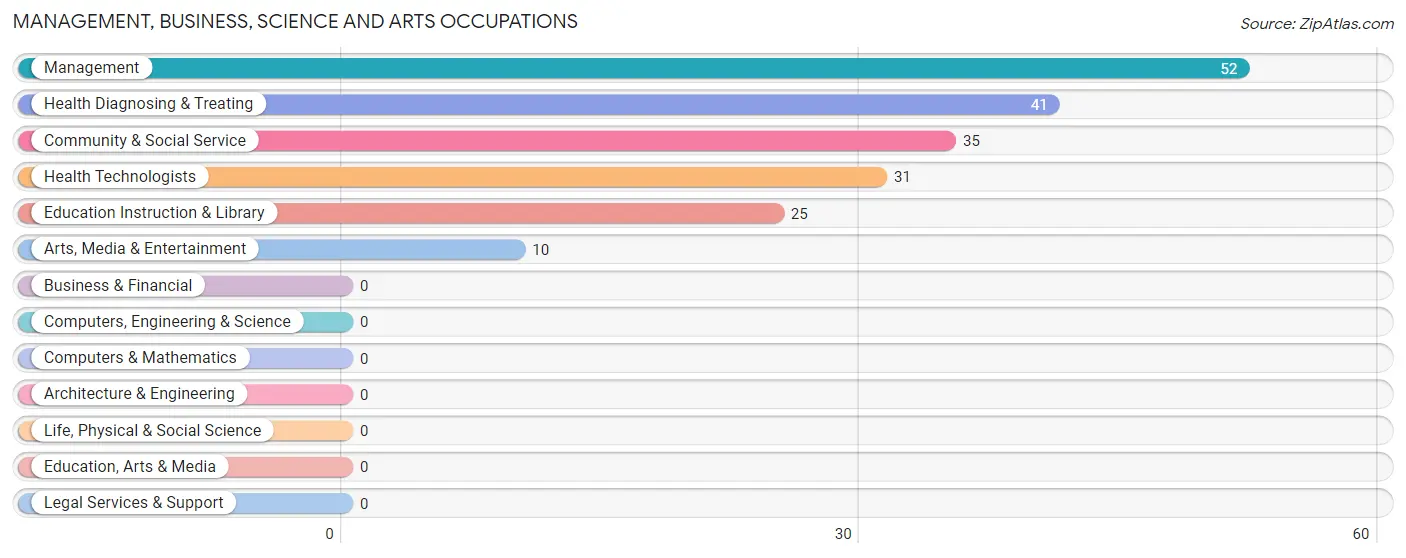
Management, Business, Science and Arts Occupations
The most common Management, Business, Science and Arts occupations in Brewster are Management (52 | 6.1%), Health Diagnosing & Treating (41 | 4.8%), Community & Social Service (35 | 4.1%), Health Technologists (31 | 3.6%), and Education Instruction & Library (25 | 2.9%).
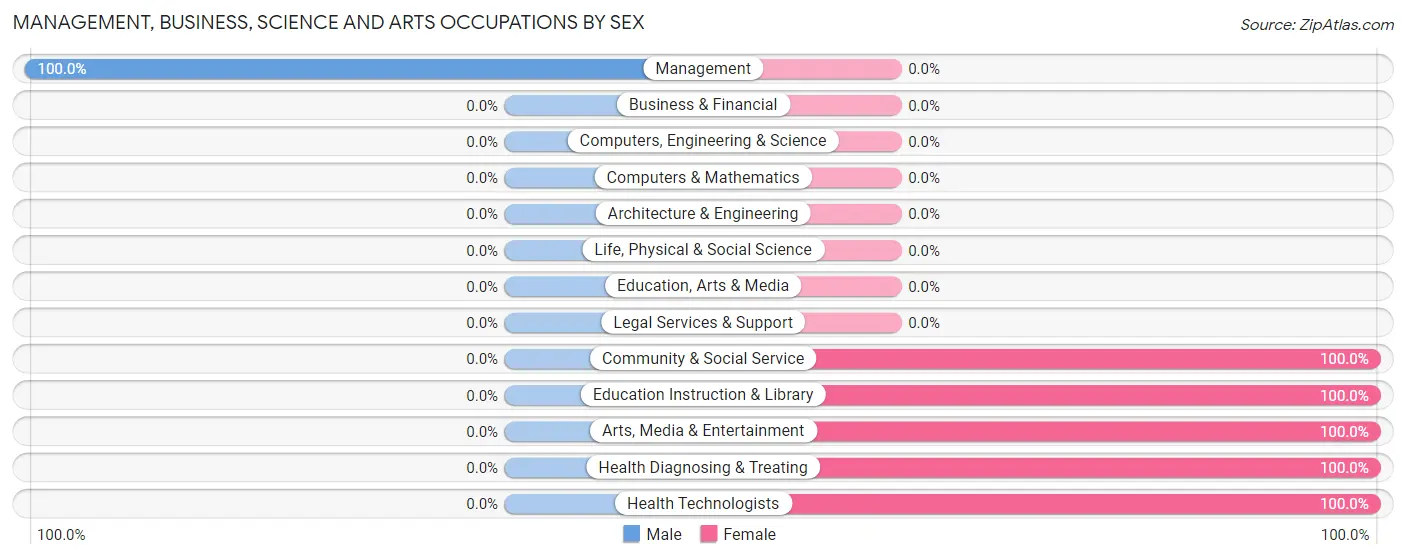
Management, Business, Science and Arts Occupations by Sex
| Occupation | Male | Female |
| Management | 52 (100.0%) | 0 (0.0%) |
| Business & Financial | 0 (0.0%) | 0 (0.0%) |
| Computers, Engineering & Science | 0 (0.0%) | 0 (0.0%) |
| Computers & Mathematics | 0 (0.0%) | 0 (0.0%) |
| Architecture & Engineering | 0 (0.0%) | 0 (0.0%) |
| Life, Physical & Social Science | 0 (0.0%) | 0 (0.0%) |
| Community & Social Service | 0 (0.0%) | 35 (100.0%) |
| Education, Arts & Media | 0 (0.0%) | 0 (0.0%) |
| Legal Services & Support | 0 (0.0%) | 0 (0.0%) |
| Education Instruction & Library | 0 (0.0%) | 25 (100.0%) |
| Arts, Media & Entertainment | 0 (0.0%) | 10 (100.0%) |
| Health Diagnosing & Treating | 0 (0.0%) | 41 (100.0%) |
| Health Technologists | 0 (0.0%) | 31 (100.0%) |
| Total (Category) | 52 (40.6%) | 76 (59.4%) |
| Total (Overall) | 410 (48.1%) | 443 (51.9%) |
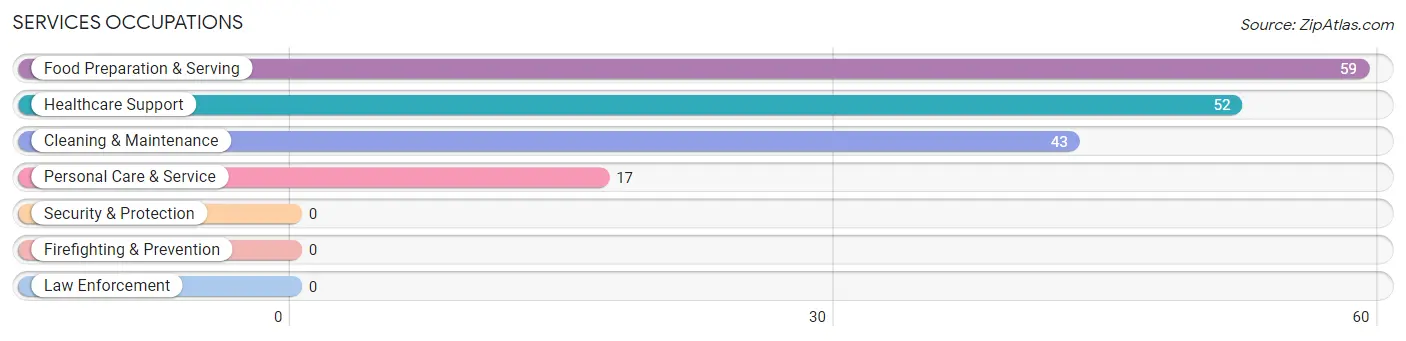
Services Occupations
The most common Services occupations in Brewster are Food Preparation & Serving (59 | 6.9%), Healthcare Support (52 | 6.1%), Cleaning & Maintenance (43 | 5.0%), and Personal Care & Service (17 | 2.0%).
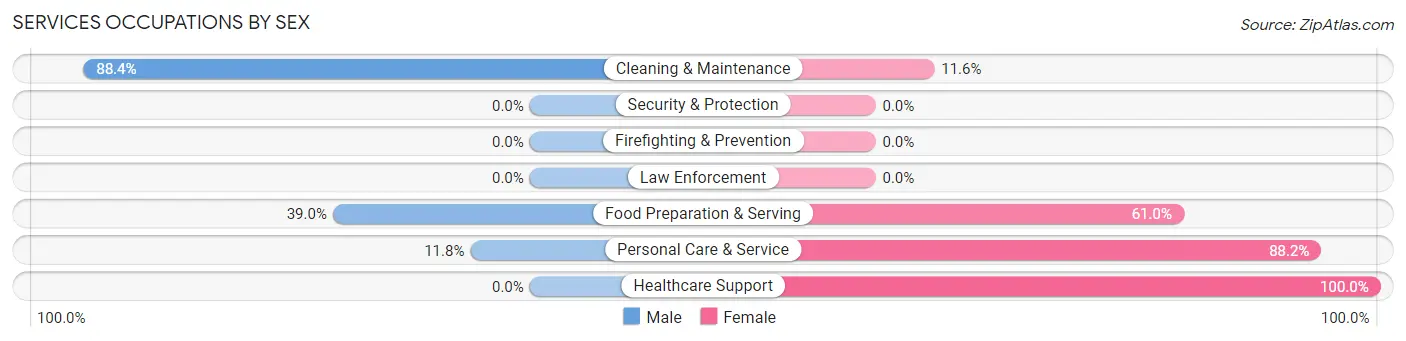
Services Occupations by Sex
Within the Services occupations in Brewster, the most male-oriented occupations are Cleaning & Maintenance (88.4%), Food Preparation & Serving (39.0%), and Personal Care & Service (11.8%), while the most female-oriented occupations are Healthcare Support (100.0%), Personal Care & Service (88.2%), and Food Preparation & Serving (61.0%).
| Occupation | Male | Female |
| Healthcare Support | 0 (0.0%) | 52 (100.0%) |
| Security & Protection | 0 (0.0%) | 0 (0.0%) |
| Firefighting & Prevention | 0 (0.0%) | 0 (0.0%) |
| Law Enforcement | 0 (0.0%) | 0 (0.0%) |
| Food Preparation & Serving | 23 (39.0%) | 36 (61.0%) |
| Cleaning & Maintenance | 38 (88.4%) | 5 (11.6%) |
| Personal Care & Service | 2 (11.8%) | 15 (88.2%) |
| Total (Category) | 63 (36.8%) | 108 (63.2%) |
| Total (Overall) | 410 (48.1%) | 443 (51.9%) |
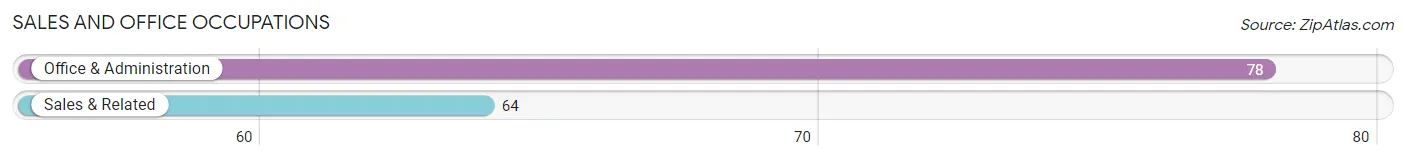
Sales and Office Occupations
The most common Sales and Office occupations in Brewster are Office & Administration (78 | 9.1%), and Sales & Related (64 | 7.5%).
Sales and Office Occupations by Sex
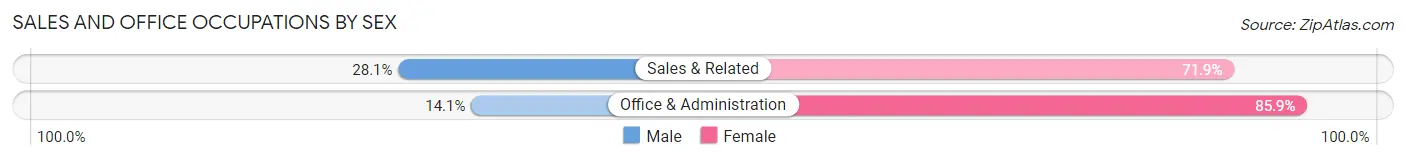
| Occupation | Male | Female |
| Sales & Related | 18 (28.1%) | 46 (71.9%) |
| Office & Administration | 11 (14.1%) | 67 (85.9%) |
| Total (Category) | 29 (20.4%) | 113 (79.6%) |
| Total (Overall) | 410 (48.1%) | 443 (51.9%) |
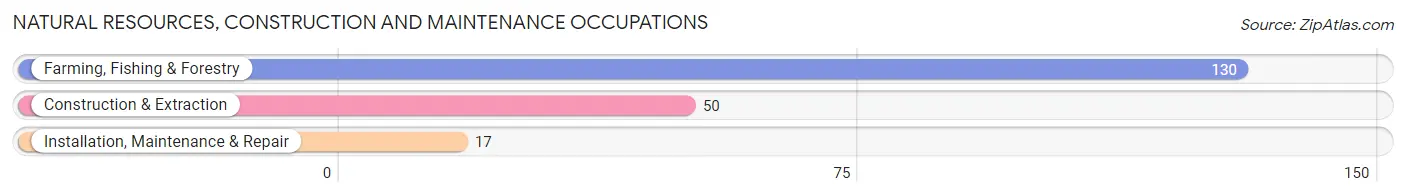
Natural Resources, Construction and Maintenance Occupations
The most common Natural Resources, Construction and Maintenance occupations in Brewster are Farming, Fishing & Forestry (130 | 15.2%), Construction & Extraction (50 | 5.9%), and Installation, Maintenance & Repair (17 | 2.0%).
Natural Resources, Construction and Maintenance Occupations by Sex
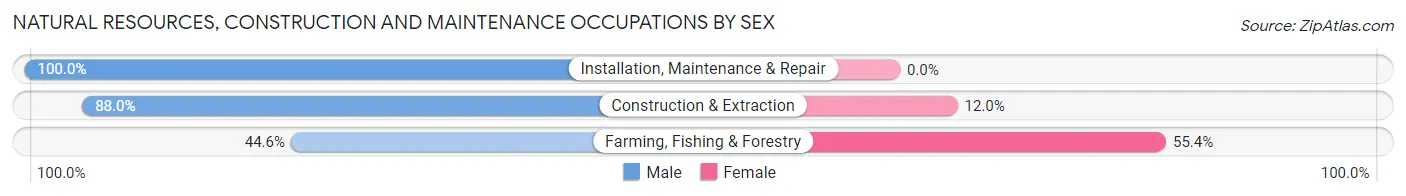
| Occupation | Male | Female |
| Farming, Fishing & Forestry | 58 (44.6%) | 72 (55.4%) |
| Construction & Extraction | 44 (88.0%) | 6 (12.0%) |
| Installation, Maintenance & Repair | 17 (100.0%) | 0 (0.0%) |
| Total (Category) | 119 (60.4%) | 78 (39.6%) |
| Total (Overall) | 410 (48.1%) | 443 (51.9%) |
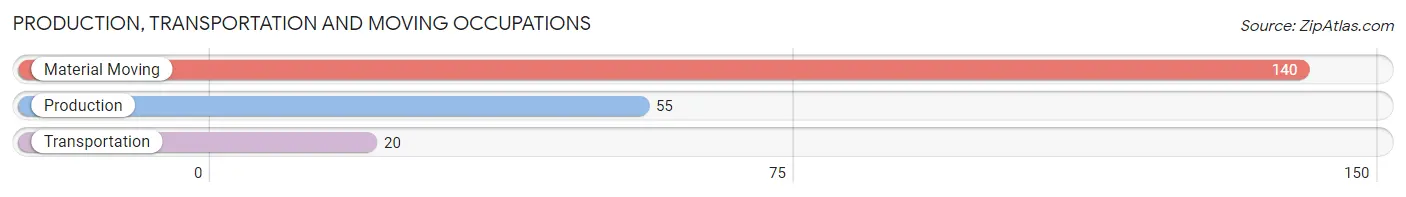
Production, Transportation and Moving Occupations
The most common Production, Transportation and Moving occupations in Brewster are Material Moving (140 | 16.4%), Production (55 | 6.5%), and Transportation (20 | 2.3%).
Production, Transportation and Moving Occupations by Sex
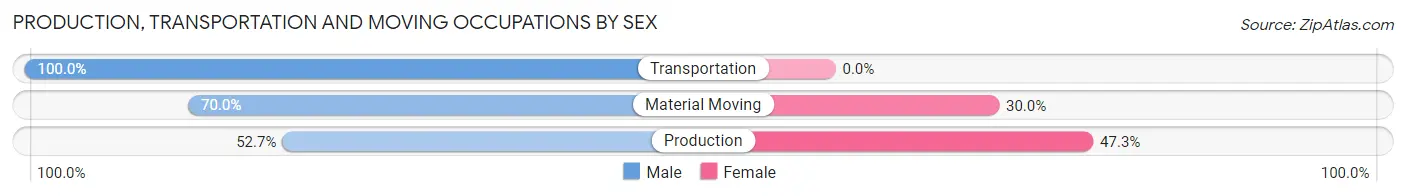
| Occupation | Male | Female |
| Production | 29 (52.7%) | 26 (47.3%) |
| Transportation | 20 (100.0%) | 0 (0.0%) |
| Material Moving | 98 (70.0%) | 42 (30.0%) |
| Total (Category) | 147 (68.4%) | 68 (31.6%) |
| Total (Overall) | 410 (48.1%) | 443 (51.9%) |
Employment Industries by Sex in Brewster
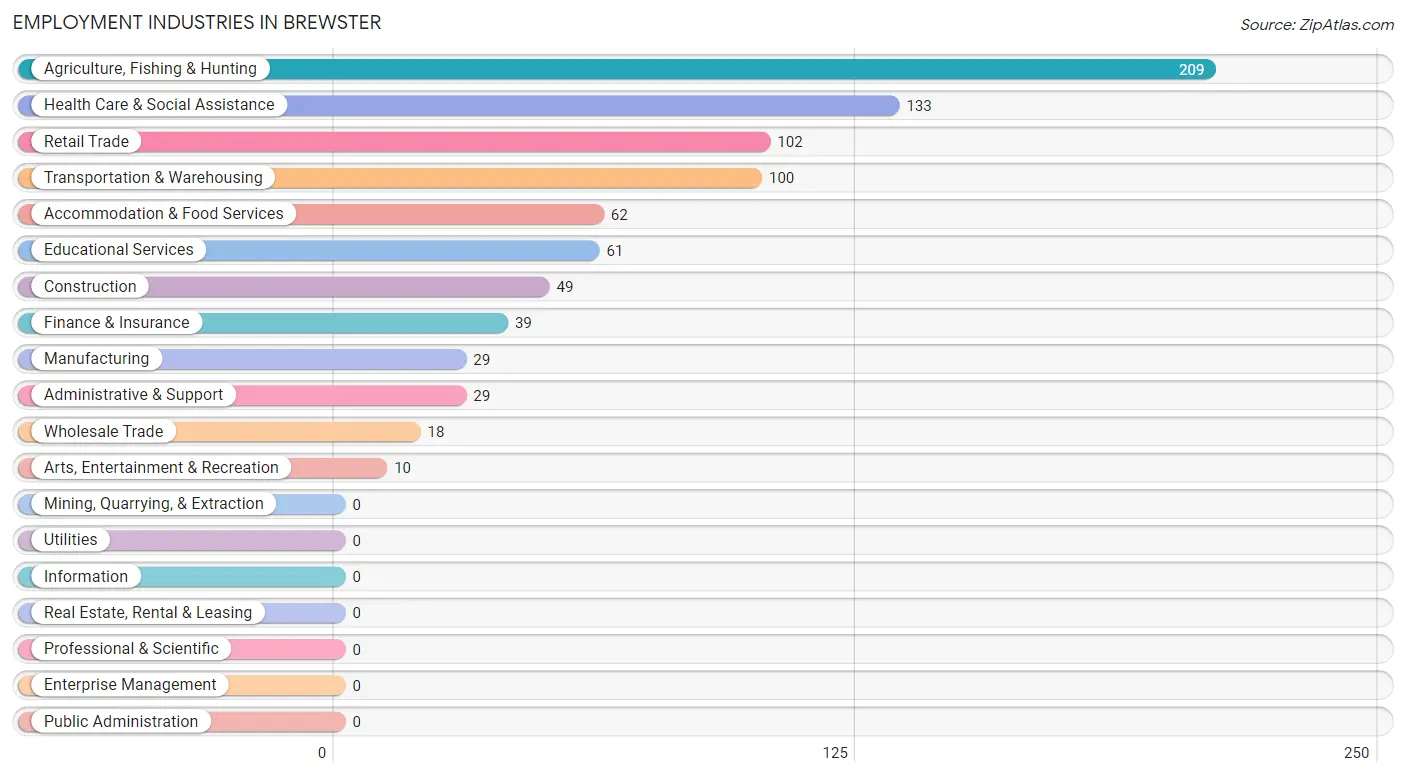
Employment Industries in Brewster
The major employment industries in Brewster include Agriculture, Fishing & Hunting (209 | 24.5%), Health Care & Social Assistance (133 | 15.6%), Retail Trade (102 | 12.0%), Transportation & Warehousing (100 | 11.7%), and Accommodation & Food Services (62 | 7.3%).
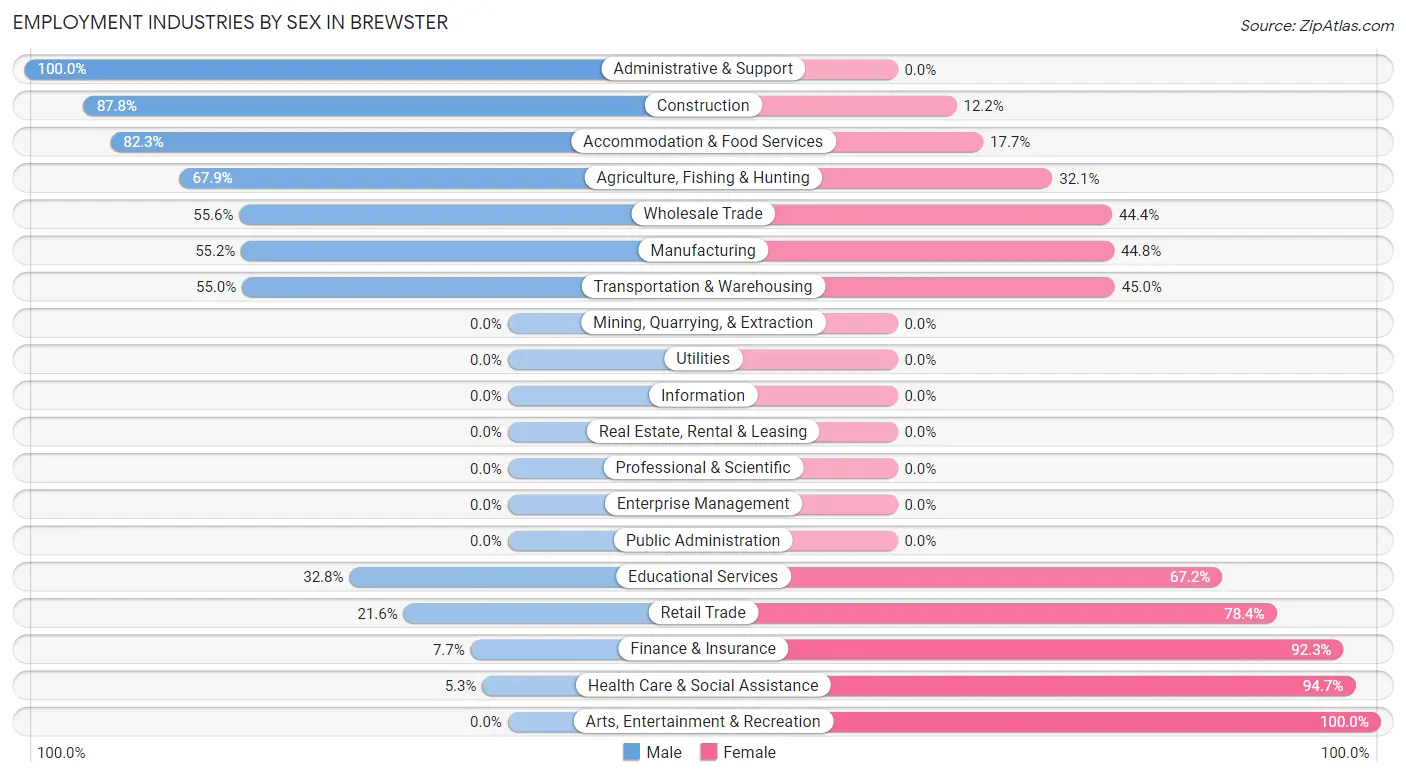
Employment Industries by Sex in Brewster
The Brewster industries that see more men than women are Administrative & Support (100.0%), Construction (87.8%), and Accommodation & Food Services (82.3%), whereas the industries that tend to have a higher number of women are Arts, Entertainment & Recreation (100.0%), Health Care & Social Assistance (94.7%), and Finance & Insurance (92.3%).
| Industry | Male | Female |
| Agriculture, Fishing & Hunting | 142 (67.9%) | 67 (32.1%) |
| Mining, Quarrying, & Extraction | 0 (0.0%) | 0 (0.0%) |
| Construction | 43 (87.8%) | 6 (12.2%) |
| Manufacturing | 16 (55.2%) | 13 (44.8%) |
| Wholesale Trade | 10 (55.6%) | 8 (44.4%) |
| Retail Trade | 22 (21.6%) | 80 (78.4%) |
| Transportation & Warehousing | 55 (55.0%) | 45 (45.0%) |
| Utilities | 0 (0.0%) | 0 (0.0%) |
| Information | 0 (0.0%) | 0 (0.0%) |
| Finance & Insurance | 3 (7.7%) | 36 (92.3%) |
| Real Estate, Rental & Leasing | 0 (0.0%) | 0 (0.0%) |
| Professional & Scientific | 0 (0.0%) | 0 (0.0%) |
| Enterprise Management | 0 (0.0%) | 0 (0.0%) |
| Administrative & Support | 29 (100.0%) | 0 (0.0%) |
| Educational Services | 20 (32.8%) | 41 (67.2%) |
| Health Care & Social Assistance | 7 (5.3%) | 126 (94.7%) |
| Arts, Entertainment & Recreation | 0 (0.0%) | 10 (100.0%) |
| Accommodation & Food Services | 51 (82.3%) | 11 (17.7%) |
| Public Administration | 0 (0.0%) | 0 (0.0%) |
| Total | 410 (48.1%) | 443 (51.9%) |
Education in Brewster
School Enrollment in Brewster
The most common levels of schooling among the 704 students in Brewster are elementary school (212 | 30.1%), high school (181 | 25.7%), and middle school (128 | 18.2%).
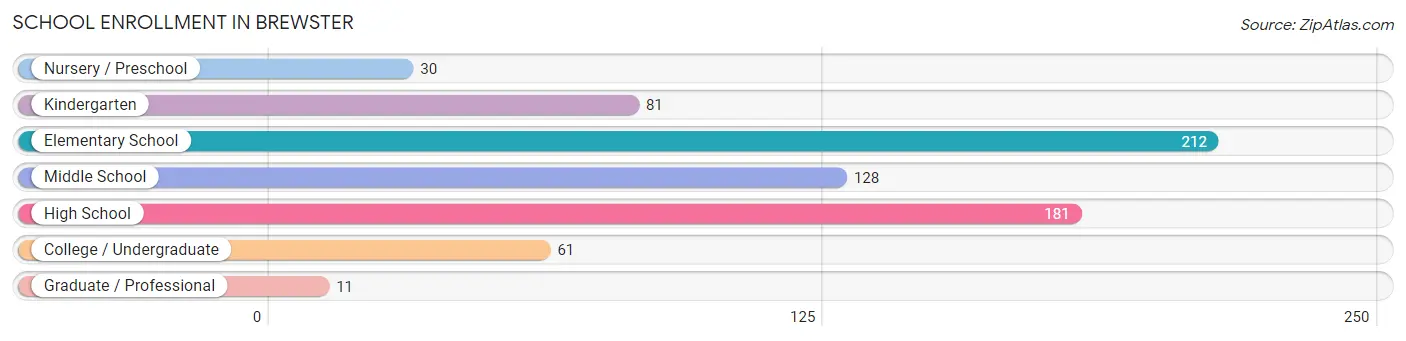
| School Level | # Students | % Students |
| Nursery / Preschool | 30 | 4.3% |
| Kindergarten | 81 | 11.5% |
| Elementary School | 212 | 30.1% |
| Middle School | 128 | 18.2% |
| High School | 181 | 25.7% |
| College / Undergraduate | 61 | 8.7% |
| Graduate / Professional | 11 | 1.6% |
| Total | 704 | 100.0% |
School Enrollment by Age by Funding Source in Brewster
Out of a total of 704 students who are enrolled in schools in Brewster, 40 (5.7%) attend a private institution, while the remaining 664 (94.3%) are enrolled in public schools. The age group of 5 to 9 year old has the highest likelihood of being enrolled in private schools, with 40 (13.7% in the age bracket) enrolled. Conversely, the age group of 3 to 4 year olds has the lowest likelihood of being enrolled in a private school, with 16 (100.0% in the age bracket) attending a public institution.
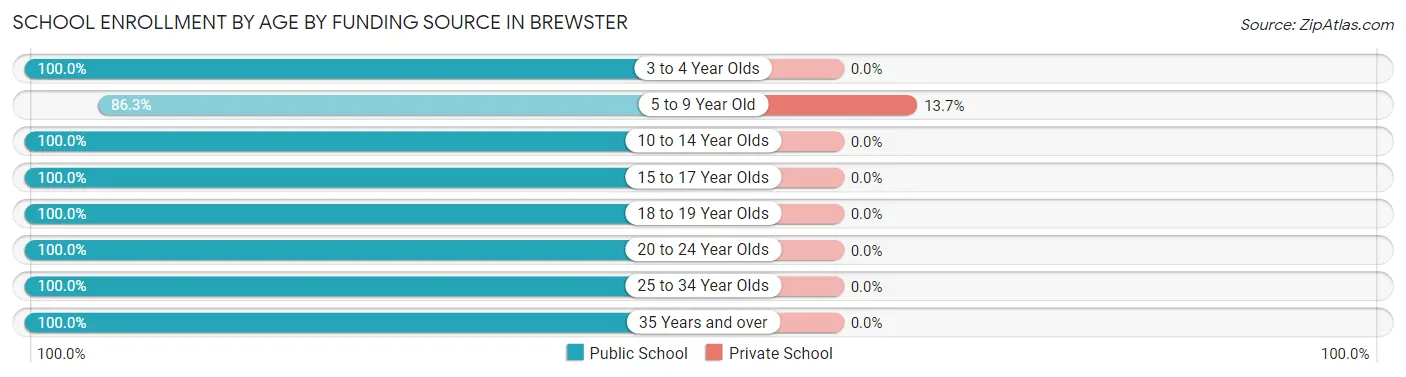
| Age Bracket | Public School | Private School |
| 3 to 4 Year Olds | 16 (100.0%) | 0 (0.0%) |
| 5 to 9 Year Old | 252 (86.3%) | 40 (13.7%) |
| 10 to 14 Year Olds | 176 (100.0%) | 0 (0.0%) |
| 15 to 17 Year Olds | 121 (100.0%) | 0 (0.0%) |
| 18 to 19 Year Olds | 30 (100.0%) | 0 (0.0%) |
| 20 to 24 Year Olds | 14 (100.0%) | 0 (0.0%) |
| 25 to 34 Year Olds | 44 (100.0%) | 0 (0.0%) |
| 35 Years and over | 11 (100.0%) | 0 (0.0%) |
| Total | 664 (94.3%) | 40 (5.7%) |
Educational Attainment by Field of Study in Brewster
Education (47 | 35.1%), arts & humanities (19 | 14.2%), business (17 | 12.7%), bio, nature & agricultural (13 | 9.7%), and psychology (10 | 7.5%) are the most common fields of study among 134 individuals in Brewster who have obtained a bachelor's degree or higher.
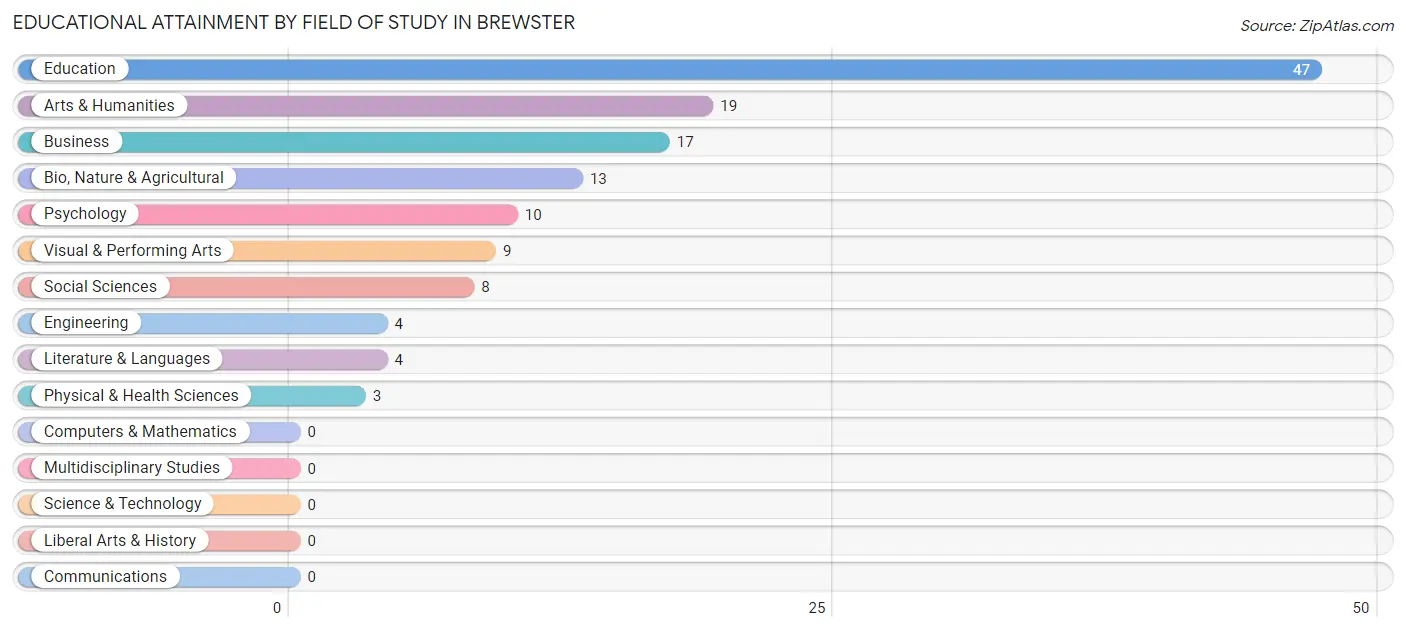
| Field of Study | # Graduates | % Graduates |
| Computers & Mathematics | 0 | 0.0% |
| Bio, Nature & Agricultural | 13 | 9.7% |
| Physical & Health Sciences | 3 | 2.2% |
| Psychology | 10 | 7.5% |
| Social Sciences | 8 | 6.0% |
| Engineering | 4 | 3.0% |
| Multidisciplinary Studies | 0 | 0.0% |
| Science & Technology | 0 | 0.0% |
| Business | 17 | 12.7% |
| Education | 47 | 35.1% |
| Literature & Languages | 4 | 3.0% |
| Liberal Arts & History | 0 | 0.0% |
| Visual & Performing Arts | 9 | 6.7% |
| Communications | 0 | 0.0% |
| Arts & Humanities | 19 | 14.2% |
| Total | 134 | 100.0% |
Transportation & Commute in Brewster
Vehicle Availability by Sex in Brewster
The most prevalent vehicle ownership categories in Brewster are males with 2 vehicles (202, accounting for 49.6%) and females with 2 vehicles (170, making up 46.4%).
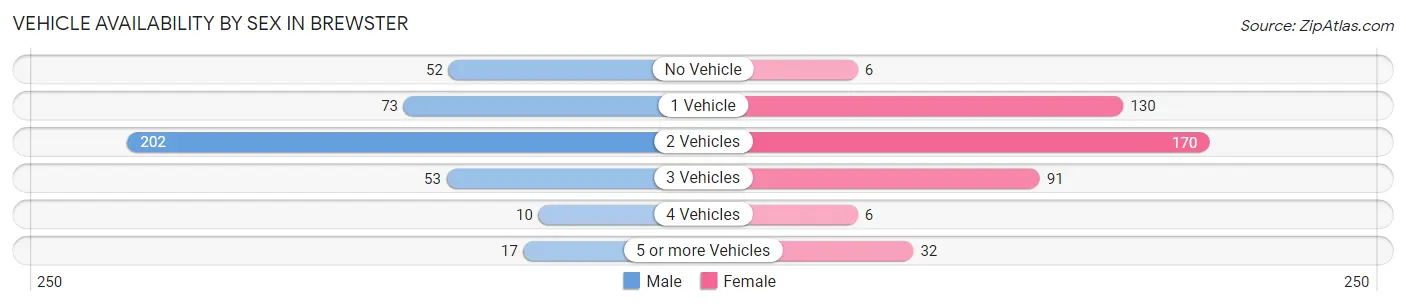
| Vehicles Available | Male | Female |
| No Vehicle | 52 (12.8%) | 6 (1.4%) |
| 1 Vehicle | 73 (17.9%) | 130 (29.9%) |
| 2 Vehicles | 202 (49.6%) | 170 (39.1%) |
| 3 Vehicles | 53 (13.0%) | 91 (20.9%) |
| 4 Vehicles | 10 (2.5%) | 6 (1.4%) |
| 5 or more Vehicles | 17 (4.2%) | 32 (7.4%) |
| Total | 407 (100.0%) | 435 (100.0%) |
Commute Time in Brewster
The most frequently occuring commute durations in Brewster are 5 to 9 minutes (186 commuters, 23.8%), 10 to 14 minutes (129 commuters, 16.5%), and less than 5 minutes (128 commuters, 16.4%).
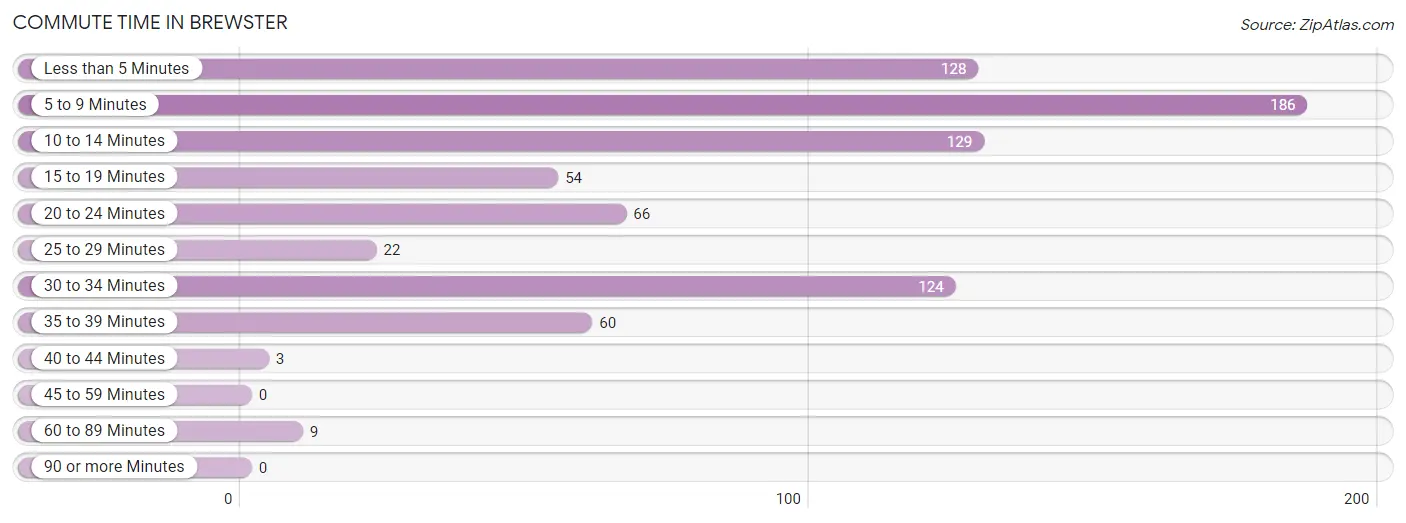
| Commute Time | # Commuters | % Commuters |
| Less than 5 Minutes | 128 | 16.4% |
| 5 to 9 Minutes | 186 | 23.8% |
| 10 to 14 Minutes | 129 | 16.5% |
| 15 to 19 Minutes | 54 | 6.9% |
| 20 to 24 Minutes | 66 | 8.5% |
| 25 to 29 Minutes | 22 | 2.8% |
| 30 to 34 Minutes | 124 | 15.9% |
| 35 to 39 Minutes | 60 | 7.7% |
| 40 to 44 Minutes | 3 | 0.4% |
| 45 to 59 Minutes | 0 | 0.0% |
| 60 to 89 Minutes | 9 | 1.1% |
| 90 or more Minutes | 0 | 0.0% |
Commute Time by Sex in Brewster
The most common commute times in Brewster are 10 to 14 minutes (89 commuters, 22.4%) for males and 5 to 9 minutes (140 commuters, 36.5%) for females.
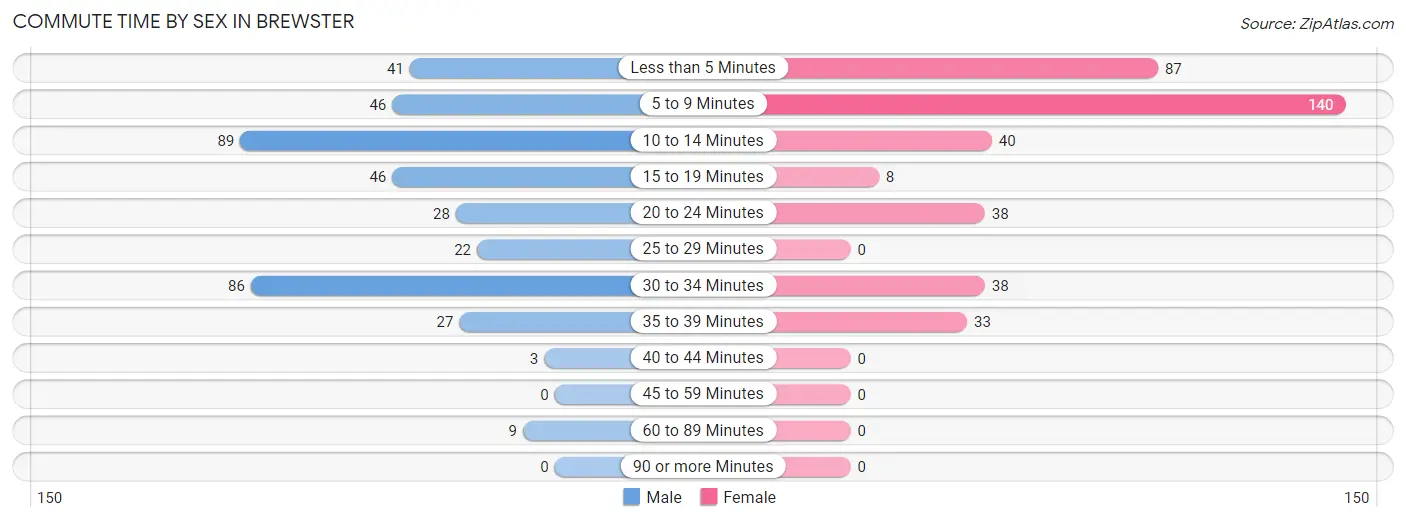
| Commute Time | Male | Female |
| Less than 5 Minutes | 41 (10.3%) | 87 (22.7%) |
| 5 to 9 Minutes | 46 (11.6%) | 140 (36.5%) |
| 10 to 14 Minutes | 89 (22.4%) | 40 (10.4%) |
| 15 to 19 Minutes | 46 (11.6%) | 8 (2.1%) |
| 20 to 24 Minutes | 28 (7.0%) | 38 (9.9%) |
| 25 to 29 Minutes | 22 (5.5%) | 0 (0.0%) |
| 30 to 34 Minutes | 86 (21.7%) | 38 (9.9%) |
| 35 to 39 Minutes | 27 (6.8%) | 33 (8.6%) |
| 40 to 44 Minutes | 3 (0.8%) | 0 (0.0%) |
| 45 to 59 Minutes | 0 (0.0%) | 0 (0.0%) |
| 60 to 89 Minutes | 9 (2.3%) | 0 (0.0%) |
| 90 or more Minutes | 0 (0.0%) | 0 (0.0%) |
Time of Departure to Work by Sex in Brewster
The most frequent times of departure to work in Brewster are 5:30 AM to 5:59 AM (102, 25.7%) for males and 8:00 AM to 8:29 AM (71, 18.5%) for females.
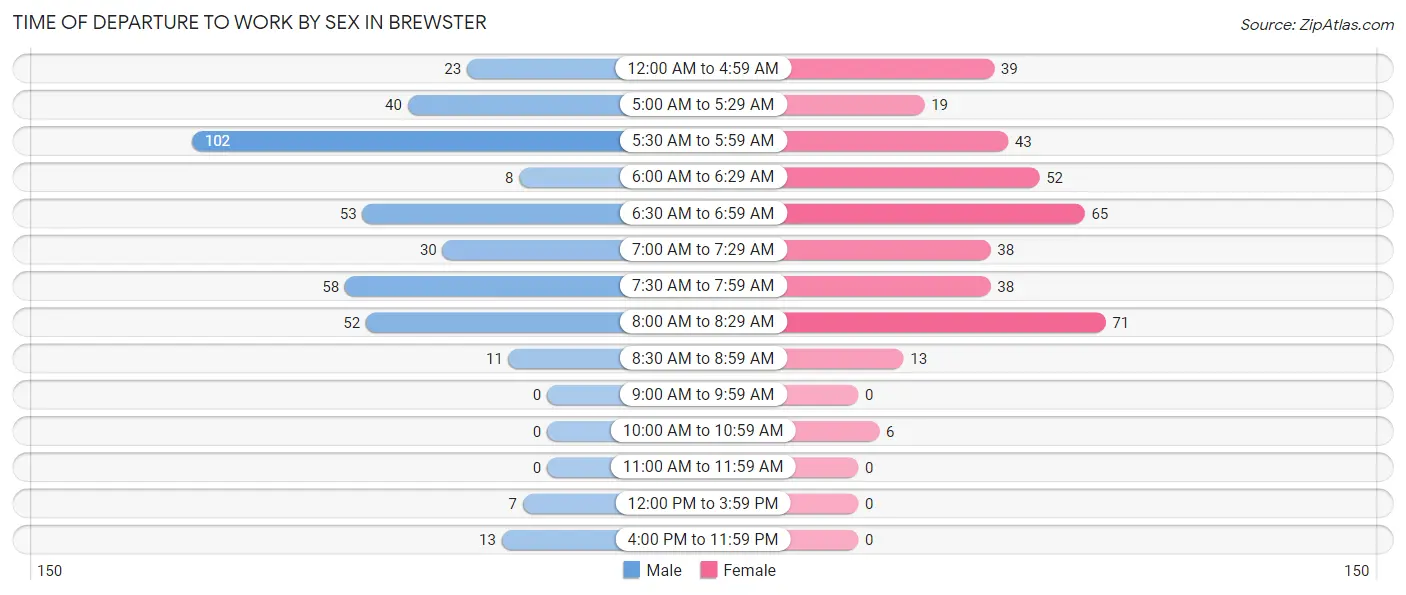
| Time of Departure | Male | Female |
| 12:00 AM to 4:59 AM | 23 (5.8%) | 39 (10.2%) |
| 5:00 AM to 5:29 AM | 40 (10.1%) | 19 (5.0%) |
| 5:30 AM to 5:59 AM | 102 (25.7%) | 43 (11.2%) |
| 6:00 AM to 6:29 AM | 8 (2.0%) | 52 (13.5%) |
| 6:30 AM to 6:59 AM | 53 (13.4%) | 65 (16.9%) |
| 7:00 AM to 7:29 AM | 30 (7.6%) | 38 (9.9%) |
| 7:30 AM to 7:59 AM | 58 (14.6%) | 38 (9.9%) |
| 8:00 AM to 8:29 AM | 52 (13.1%) | 71 (18.5%) |
| 8:30 AM to 8:59 AM | 11 (2.8%) | 13 (3.4%) |
| 9:00 AM to 9:59 AM | 0 (0.0%) | 0 (0.0%) |
| 10:00 AM to 10:59 AM | 0 (0.0%) | 6 (1.6%) |
| 11:00 AM to 11:59 AM | 0 (0.0%) | 0 (0.0%) |
| 12:00 PM to 3:59 PM | 7 (1.8%) | 0 (0.0%) |
| 4:00 PM to 11:59 PM | 13 (3.3%) | 0 (0.0%) |
| Total | 397 (100.0%) | 384 (100.0%) |
Housing Occupancy in Brewster
Occupancy by Ownership in Brewster
Of the total 702 dwellings in Brewster, owner-occupied units account for 327 (46.6%), while renter-occupied units make up 375 (53.4%).
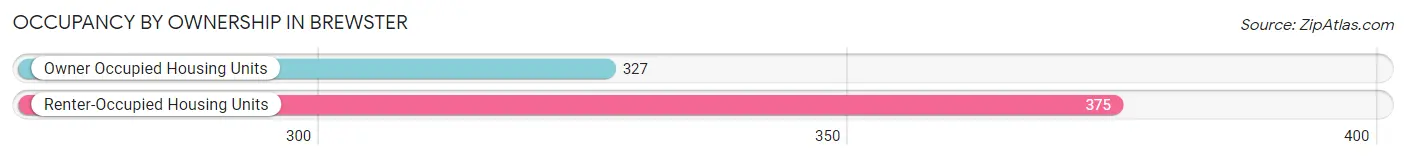
| Occupancy | # Housing Units | % Housing Units |
| Owner Occupied Housing Units | 327 | 46.6% |
| Renter-Occupied Housing Units | 375 | 53.4% |
| Total Occupied Housing Units | 702 | 100.0% |
Occupancy by Household Size in Brewster
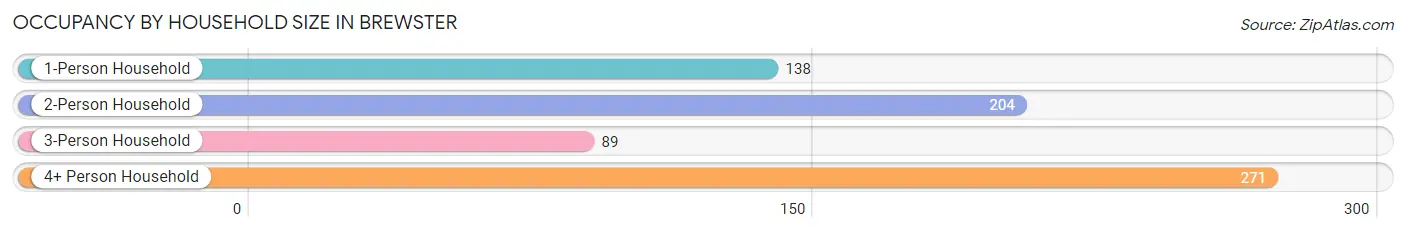
| Household Size | # Housing Units | % Housing Units |
| 1-Person Household | 138 | 19.7% |
| 2-Person Household | 204 | 29.1% |
| 3-Person Household | 89 | 12.7% |
| 4+ Person Household | 271 | 38.6% |
| Total Housing Units | 702 | 100.0% |
Occupancy by Ownership by Household Size in Brewster
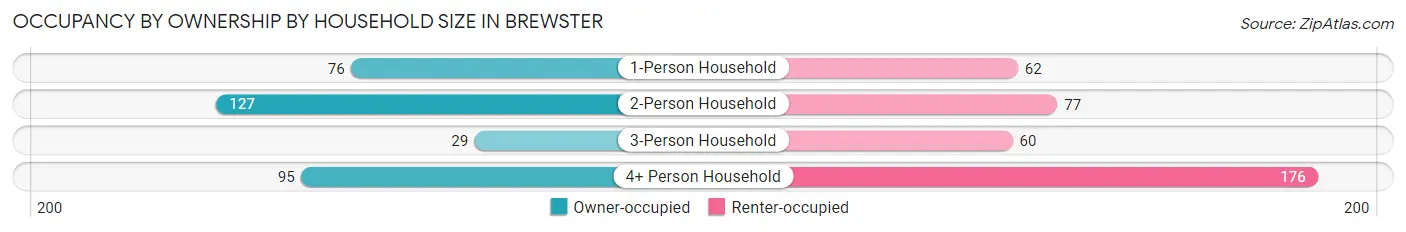
| Household Size | Owner-occupied | Renter-occupied |
| 1-Person Household | 76 (55.1%) | 62 (44.9%) |
| 2-Person Household | 127 (62.3%) | 77 (37.8%) |
| 3-Person Household | 29 (32.6%) | 60 (67.4%) |
| 4+ Person Household | 95 (35.1%) | 176 (64.9%) |
| Total Housing Units | 327 (46.6%) | 375 (53.4%) |
Occupancy by Educational Attainment in Brewster
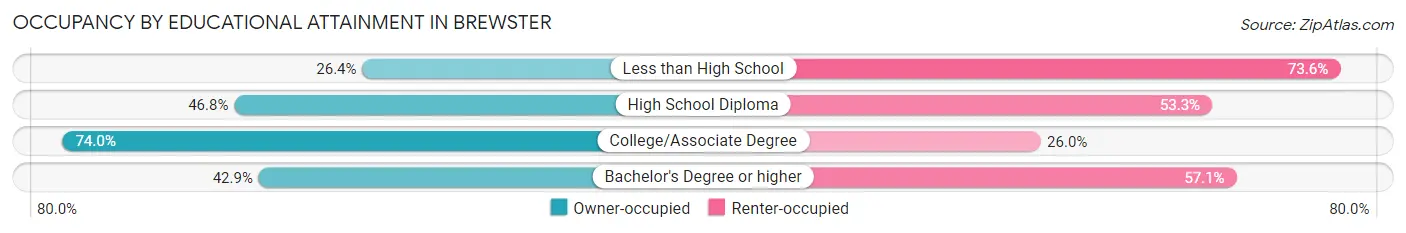
| Household Size | Owner-occupied | Renter-occupied |
| Less than High School | 60 (26.4%) | 167 (73.6%) |
| High School Diploma | 115 (46.8%) | 131 (53.2%) |
| College/Associate Degree | 128 (74.0%) | 45 (26.0%) |
| Bachelor's Degree or higher | 24 (42.9%) | 32 (57.1%) |
Occupancy by Age of Householder in Brewster
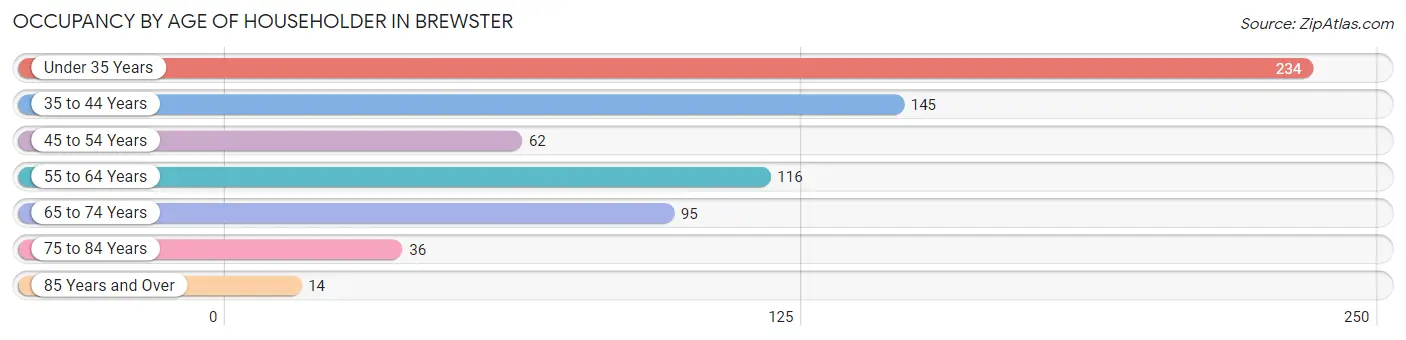
| Age Bracket | # Households | % Households |
| Under 35 Years | 234 | 33.3% |
| 35 to 44 Years | 145 | 20.7% |
| 45 to 54 Years | 62 | 8.8% |
| 55 to 64 Years | 116 | 16.5% |
| 65 to 74 Years | 95 | 13.5% |
| 75 to 84 Years | 36 | 5.1% |
| 85 Years and Over | 14 | 2.0% |
| Total | 702 | 100.0% |
Housing Finances in Brewster
Median Income by Occupancy in Brewster
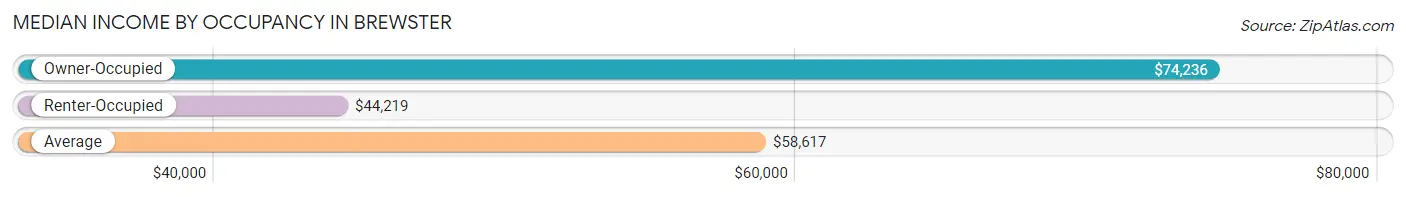
| Occupancy Type | # Households | Median Income |
| Owner-Occupied | 327 (46.6%) | $74,236 |
| Renter-Occupied | 375 (53.4%) | $44,219 |
| Average | 702 (100.0%) | $58,617 |
Occupancy by Householder Income Bracket in Brewster
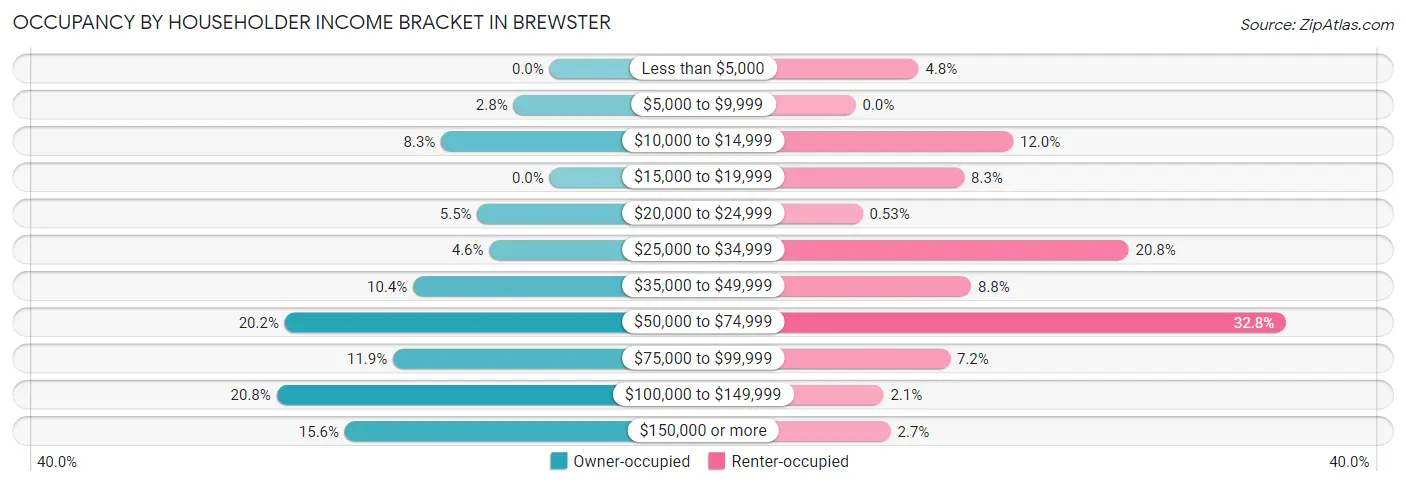
| Income Bracket | Owner-occupied | Renter-occupied |
| Less than $5,000 | 0 (0.0%) | 18 (4.8%) |
| $5,000 to $9,999 | 9 (2.8%) | 0 (0.0%) |
| $10,000 to $14,999 | 27 (8.3%) | 45 (12.0%) |
| $15,000 to $19,999 | 0 (0.0%) | 31 (8.3%) |
| $20,000 to $24,999 | 18 (5.5%) | 2 (0.5%) |
| $25,000 to $34,999 | 15 (4.6%) | 78 (20.8%) |
| $35,000 to $49,999 | 34 (10.4%) | 33 (8.8%) |
| $50,000 to $74,999 | 66 (20.2%) | 123 (32.8%) |
| $75,000 to $99,999 | 39 (11.9%) | 27 (7.2%) |
| $100,000 to $149,999 | 68 (20.8%) | 8 (2.1%) |
| $150,000 or more | 51 (15.6%) | 10 (2.7%) |
| Total | 327 (100.0%) | 375 (100.0%) |
Monthly Housing Cost Tiers in Brewster
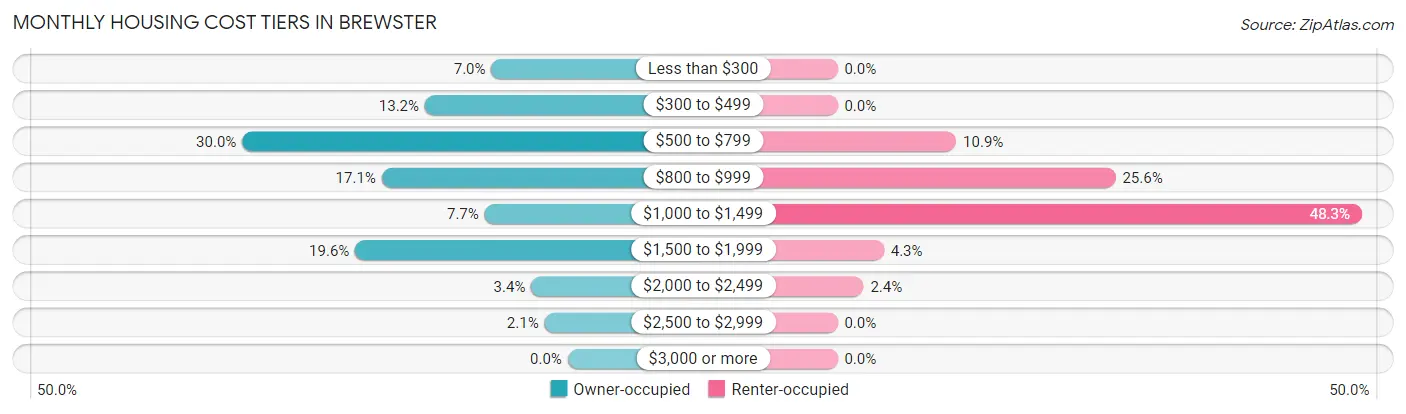
| Monthly Cost | Owner-occupied | Renter-occupied |
| Less than $300 | 23 (7.0%) | 0 (0.0%) |
| $300 to $499 | 43 (13.2%) | 0 (0.0%) |
| $500 to $799 | 98 (30.0%) | 41 (10.9%) |
| $800 to $999 | 56 (17.1%) | 96 (25.6%) |
| $1,000 to $1,499 | 25 (7.6%) | 181 (48.3%) |
| $1,500 to $1,999 | 64 (19.6%) | 16 (4.3%) |
| $2,000 to $2,499 | 11 (3.4%) | 9 (2.4%) |
| $2,500 to $2,999 | 7 (2.1%) | 0 (0.0%) |
| $3,000 or more | 0 (0.0%) | 0 (0.0%) |
| Total | 327 (100.0%) | 375 (100.0%) |
Physical Housing Characteristics in Brewster
Housing Structures in Brewster
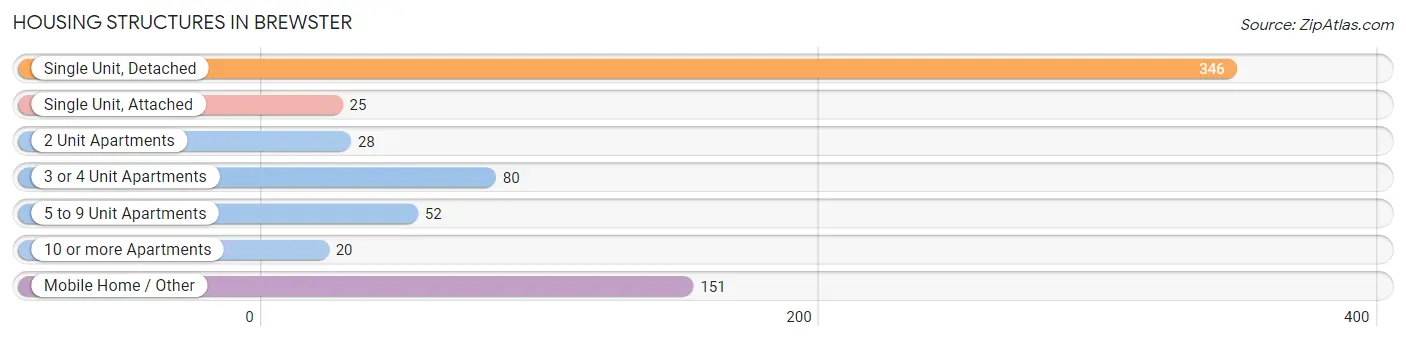
| Structure Type | # Housing Units | % Housing Units |
| Single Unit, Detached | 346 | 49.3% |
| Single Unit, Attached | 25 | 3.6% |
| 2 Unit Apartments | 28 | 4.0% |
| 3 or 4 Unit Apartments | 80 | 11.4% |
| 5 to 9 Unit Apartments | 52 | 7.4% |
| 10 or more Apartments | 20 | 2.9% |
| Mobile Home / Other | 151 | 21.5% |
| Total | 702 | 100.0% |
Housing Structures by Occupancy in Brewster
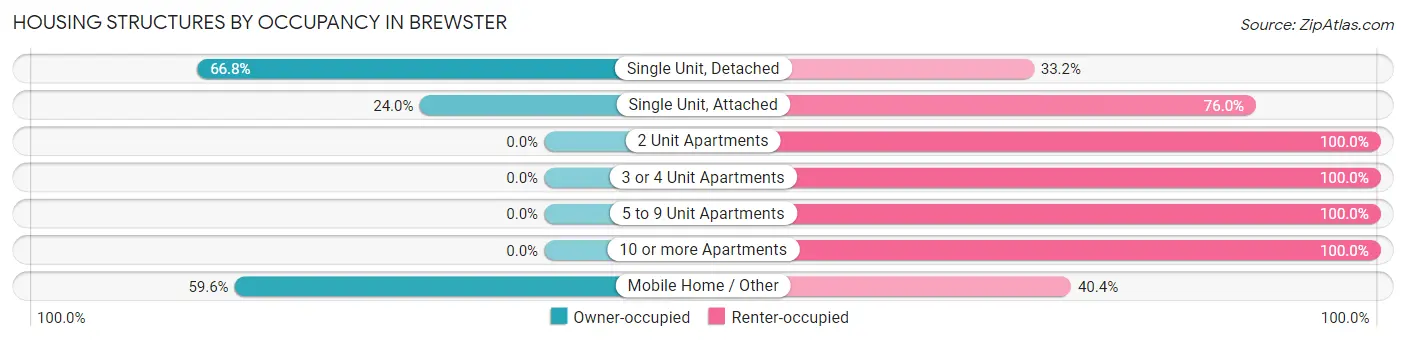
| Structure Type | Owner-occupied | Renter-occupied |
| Single Unit, Detached | 231 (66.8%) | 115 (33.2%) |
| Single Unit, Attached | 6 (24.0%) | 19 (76.0%) |
| 2 Unit Apartments | 0 (0.0%) | 28 (100.0%) |
| 3 or 4 Unit Apartments | 0 (0.0%) | 80 (100.0%) |
| 5 to 9 Unit Apartments | 0 (0.0%) | 52 (100.0%) |
| 10 or more Apartments | 0 (0.0%) | 20 (100.0%) |
| Mobile Home / Other | 90 (59.6%) | 61 (40.4%) |
| Total | 327 (46.6%) | 375 (53.4%) |
Housing Structures by Number of Rooms in Brewster
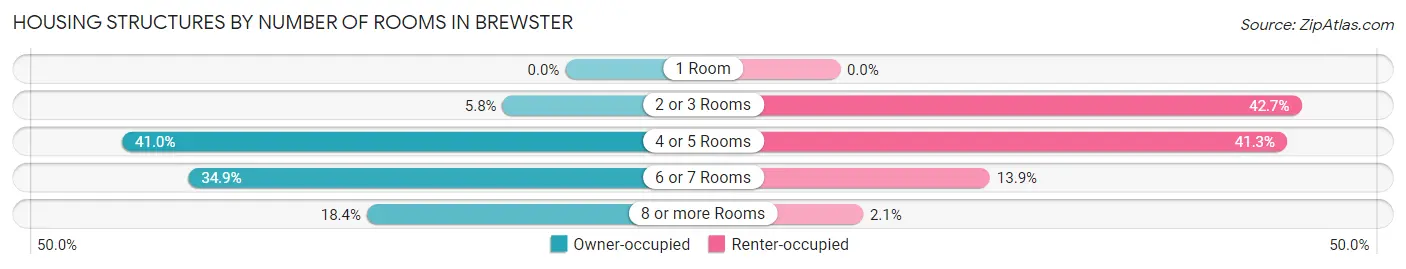
| Number of Rooms | Owner-occupied | Renter-occupied |
| 1 Room | 0 (0.0%) | 0 (0.0%) |
| 2 or 3 Rooms | 19 (5.8%) | 160 (42.7%) |
| 4 or 5 Rooms | 134 (41.0%) | 155 (41.3%) |
| 6 or 7 Rooms | 114 (34.9%) | 52 (13.9%) |
| 8 or more Rooms | 60 (18.3%) | 8 (2.1%) |
| Total | 327 (100.0%) | 375 (100.0%) |
Housing Structure by Heating Type in Brewster
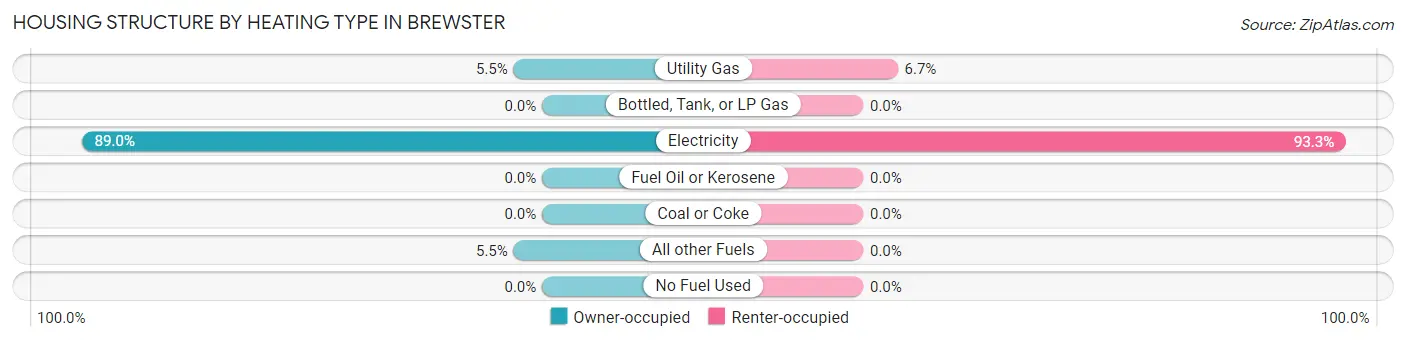
| Heating Type | Owner-occupied | Renter-occupied |
| Utility Gas | 18 (5.5%) | 25 (6.7%) |
| Bottled, Tank, or LP Gas | 0 (0.0%) | 0 (0.0%) |
| Electricity | 291 (89.0%) | 350 (93.3%) |
| Fuel Oil or Kerosene | 0 (0.0%) | 0 (0.0%) |
| Coal or Coke | 0 (0.0%) | 0 (0.0%) |
| All other Fuels | 18 (5.5%) | 0 (0.0%) |
| No Fuel Used | 0 (0.0%) | 0 (0.0%) |
| Total | 327 (100.0%) | 375 (100.0%) |
Household Vehicle Usage in Brewster
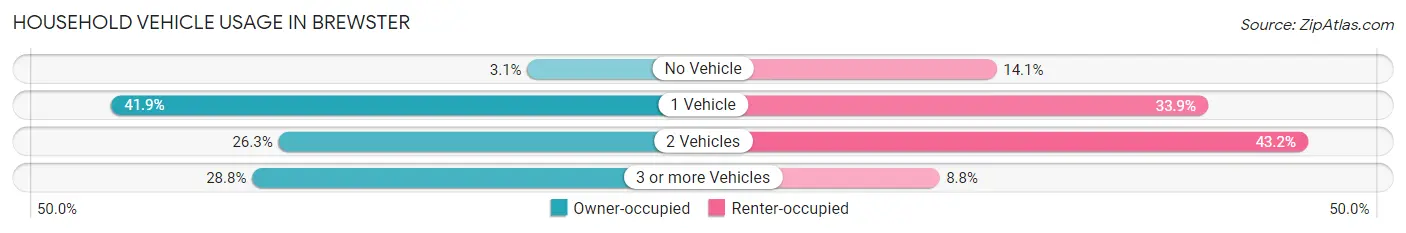
| Vehicles per Household | Owner-occupied | Renter-occupied |
| No Vehicle | 10 (3.1%) | 53 (14.1%) |
| 1 Vehicle | 137 (41.9%) | 127 (33.9%) |
| 2 Vehicles | 86 (26.3%) | 162 (43.2%) |
| 3 or more Vehicles | 94 (28.7%) | 33 (8.8%) |
| Total | 327 (100.0%) | 375 (100.0%) |
Real Estate & Mortgages in Brewster
Real Estate and Mortgage Overview in Brewster
| Characteristic | Without Mortgage | With Mortgage |
| Housing Units | 175 | 152 |
| Median Property Value | $165,700 | $283,300 |
| Median Household Income | $99,417 | $23 |
| Monthly Housing Costs | $590 | $0 |
| Real Estate Taxes | $1,421 | $10 |
Property Value by Mortgage Status in Brewster
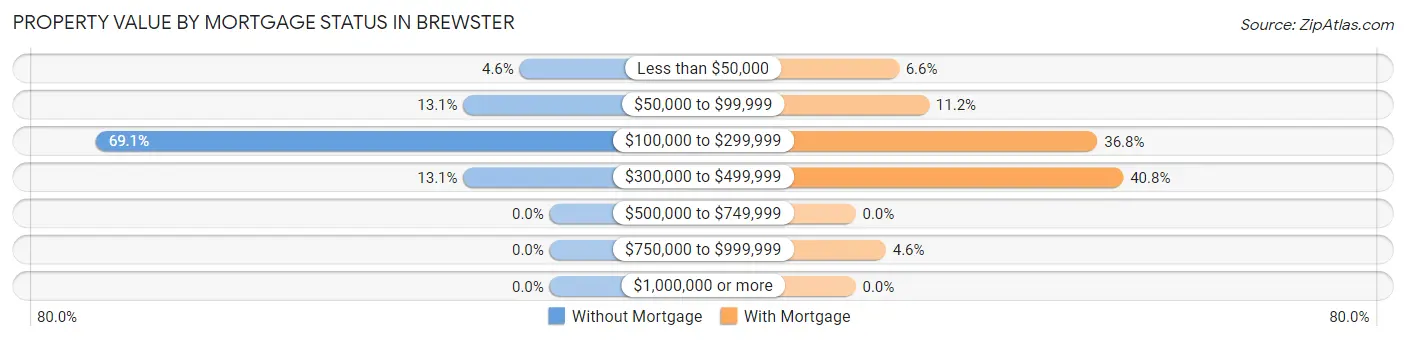
| Property Value | Without Mortgage | With Mortgage |
| Less than $50,000 | 8 (4.6%) | 10 (6.6%) |
| $50,000 to $99,999 | 23 (13.1%) | 17 (11.2%) |
| $100,000 to $299,999 | 121 (69.1%) | 56 (36.8%) |
| $300,000 to $499,999 | 23 (13.1%) | 62 (40.8%) |
| $500,000 to $749,999 | 0 (0.0%) | 0 (0.0%) |
| $750,000 to $999,999 | 0 (0.0%) | 7 (4.6%) |
| $1,000,000 or more | 0 (0.0%) | 0 (0.0%) |
| Total | 175 (100.0%) | 152 (100.0%) |
Household Income by Mortgage Status in Brewster
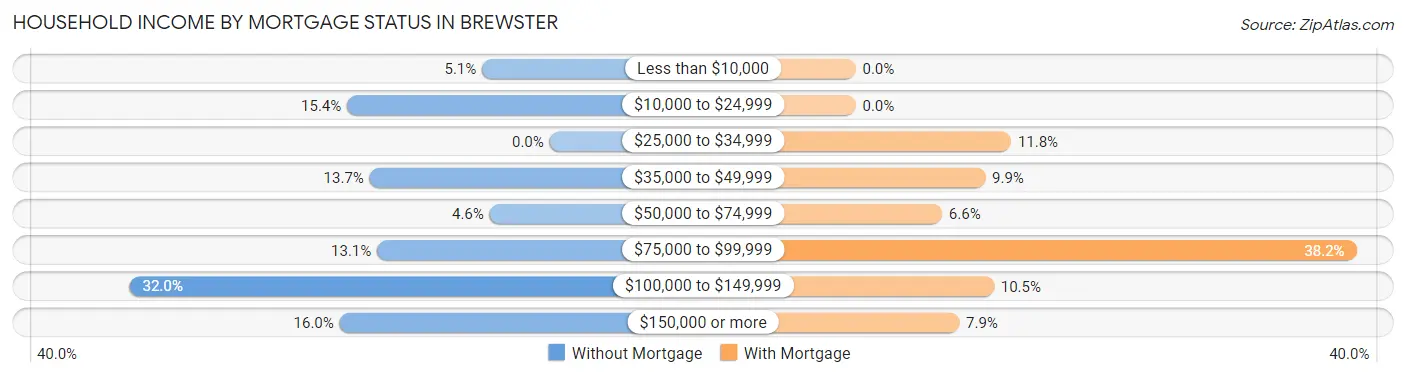
| Household Income | Without Mortgage | With Mortgage |
| Less than $10,000 | 9 (5.1%) | 0 (0.0%) |
| $10,000 to $24,999 | 27 (15.4%) | 0 (0.0%) |
| $25,000 to $34,999 | 0 (0.0%) | 18 (11.8%) |
| $35,000 to $49,999 | 24 (13.7%) | 15 (9.9%) |
| $50,000 to $74,999 | 8 (4.6%) | 10 (6.6%) |
| $75,000 to $99,999 | 23 (13.1%) | 58 (38.2%) |
| $100,000 to $149,999 | 56 (32.0%) | 16 (10.5%) |
| $150,000 or more | 28 (16.0%) | 12 (7.9%) |
| Total | 175 (100.0%) | 152 (100.0%) |
Property Value to Household Income Ratio in Brewster
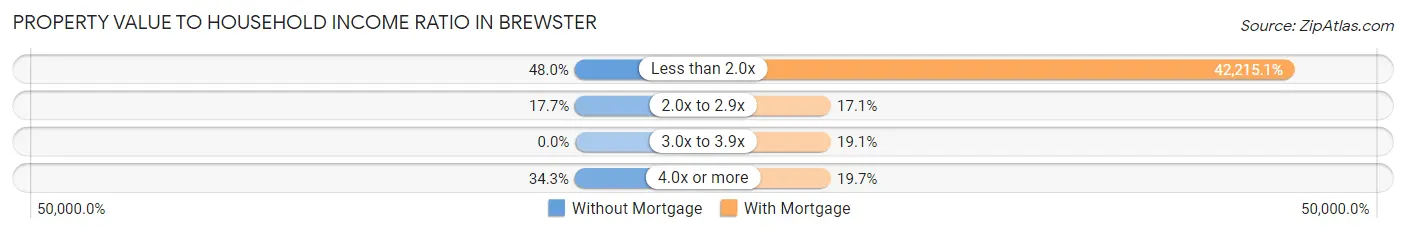
| Value-to-Income Ratio | Without Mortgage | With Mortgage |
| Less than 2.0x | 84 (48.0%) | 64,167 (42,215.1%) |
| 2.0x to 2.9x | 31 (17.7%) | 26 (17.1%) |
| 3.0x to 3.9x | 0 (0.0%) | 29 (19.1%) |
| 4.0x or more | 60 (34.3%) | 30 (19.7%) |
| Total | 175 (100.0%) | 152 (100.0%) |
Real Estate Taxes by Mortgage Status in Brewster
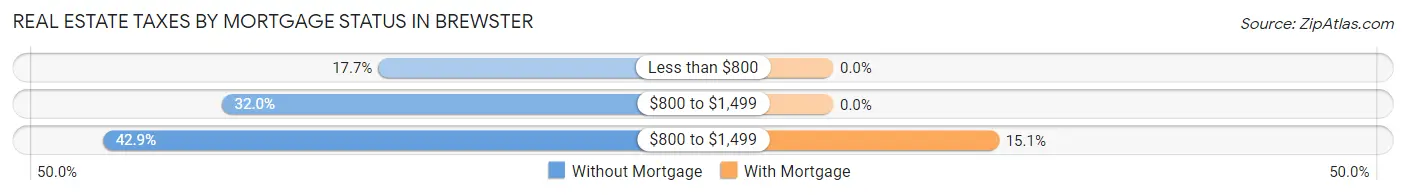
| Property Taxes | Without Mortgage | With Mortgage |
| Less than $800 | 31 (17.7%) | 0 (0.0%) |
| $800 to $1,499 | 56 (32.0%) | 0 (0.0%) |
| $800 to $1,499 | 75 (42.9%) | 23 (15.1%) |
| Total | 175 (100.0%) | 152 (100.0%) |
Health & Disability in Brewster
Health Insurance Coverage by Age in Brewster
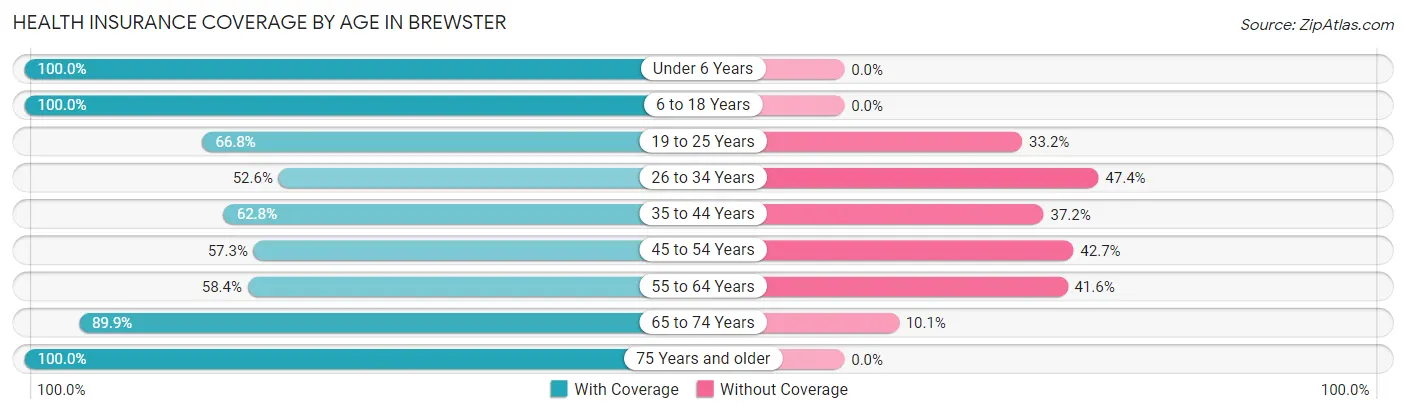
| Age Bracket | With Coverage | Without Coverage |
| Under 6 Years | 393 (100.0%) | 0 (0.0%) |
| 6 to 18 Years | 560 (100.0%) | 0 (0.0%) |
| 19 to 25 Years | 137 (66.8%) | 68 (33.2%) |
| 26 to 34 Years | 151 (52.6%) | 136 (47.4%) |
| 35 to 44 Years | 137 (62.8%) | 81 (37.2%) |
| 45 to 54 Years | 63 (57.3%) | 47 (42.7%) |
| 55 to 64 Years | 108 (58.4%) | 77 (41.6%) |
| 65 to 74 Years | 124 (89.9%) | 14 (10.1%) |
| 75 Years and older | 80 (100.0%) | 0 (0.0%) |
| Total | 1,753 (80.6%) | 423 (19.4%) |
Health Insurance Coverage by Citizenship Status in Brewster
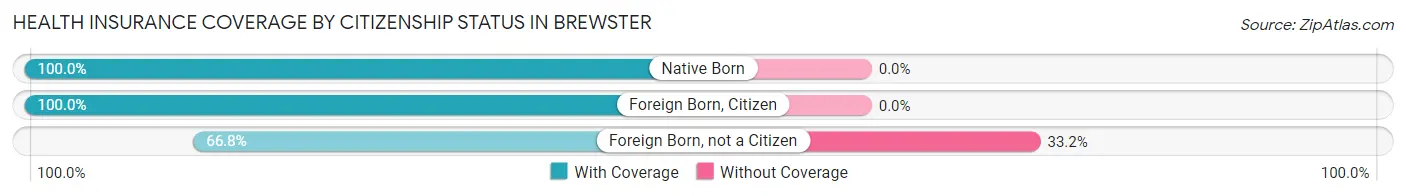
| Citizenship Status | With Coverage | Without Coverage |
| Native Born | 393 (100.0%) | 0 (0.0%) |
| Foreign Born, Citizen | 560 (100.0%) | 0 (0.0%) |
| Foreign Born, not a Citizen | 137 (66.8%) | 68 (33.2%) |
Health Insurance Coverage by Household Income in Brewster
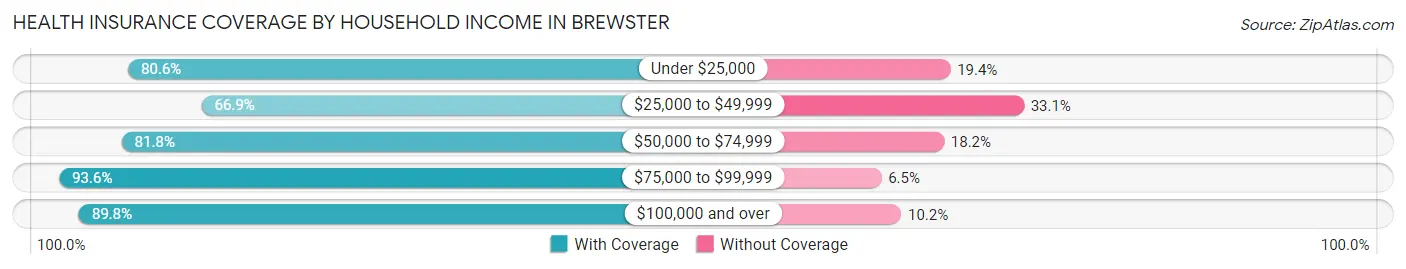
| Household Income | With Coverage | Without Coverage |
| Under $25,000 | 358 (80.6%) | 86 (19.4%) |
| $25,000 to $49,999 | 339 (66.9%) | 168 (33.1%) |
| $50,000 to $74,999 | 513 (81.8%) | 114 (18.2%) |
| $75,000 to $99,999 | 145 (93.5%) | 10 (6.5%) |
| $100,000 and over | 398 (89.8%) | 45 (10.2%) |
Public vs Private Health Insurance Coverage by Age in Brewster
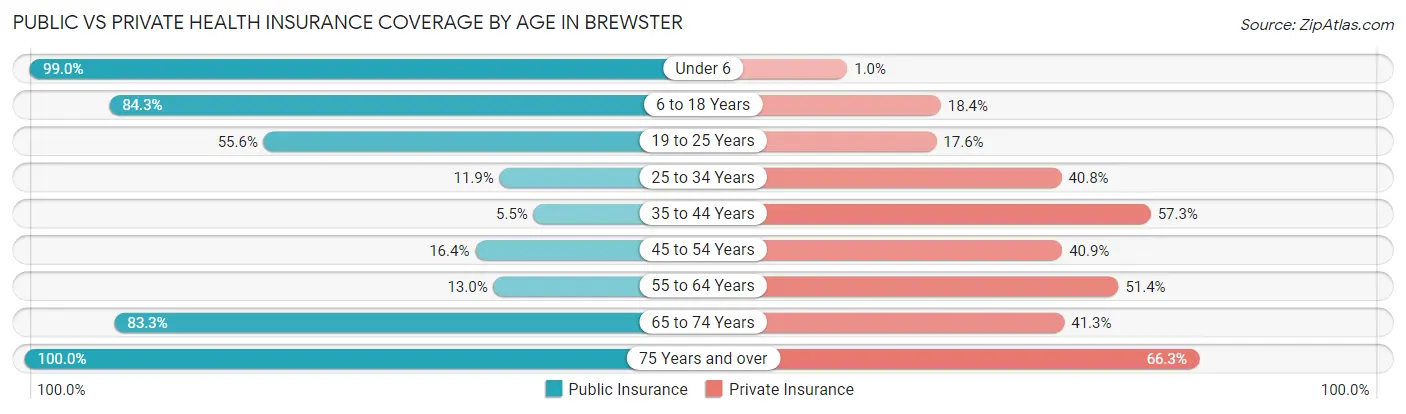
| Age Bracket | Public Insurance | Private Insurance |
| Under 6 | 389 (99.0%) | 4 (1.0%) |
| 6 to 18 Years | 472 (84.3%) | 103 (18.4%) |
| 19 to 25 Years | 114 (55.6%) | 36 (17.6%) |
| 25 to 34 Years | 34 (11.8%) | 117 (40.8%) |
| 35 to 44 Years | 12 (5.5%) | 125 (57.3%) |
| 45 to 54 Years | 18 (16.4%) | 45 (40.9%) |
| 55 to 64 Years | 24 (13.0%) | 95 (51.3%) |
| 65 to 74 Years | 115 (83.3%) | 57 (41.3%) |
| 75 Years and over | 80 (100.0%) | 53 (66.2%) |
| Total | 1,258 (57.8%) | 635 (29.2%) |
Disability Status by Sex by Age in Brewster
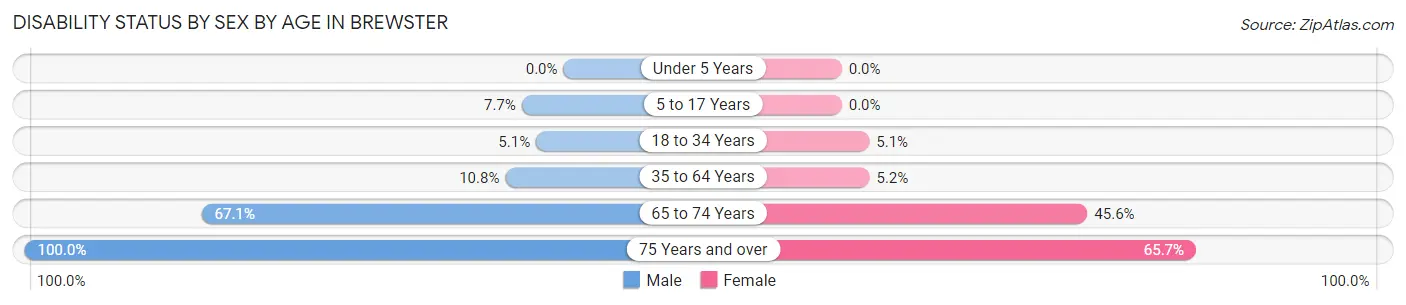
| Age Bracket | Male | Female |
| Under 5 Years | 0 (0.0%) | 0 (0.0%) |
| 5 to 17 Years | 36 (7.7%) | 0 (0.0%) |
| 18 to 34 Years | 10 (5.1%) | 17 (5.1%) |
| 35 to 64 Years | 26 (10.8%) | 14 (5.1%) |
| 65 to 74 Years | 47 (67.1%) | 31 (45.6%) |
| 75 Years and over | 45 (100.0%) | 23 (65.7%) |
Disability Class by Sex by Age in Brewster
Disability Class: Hearing Difficulty
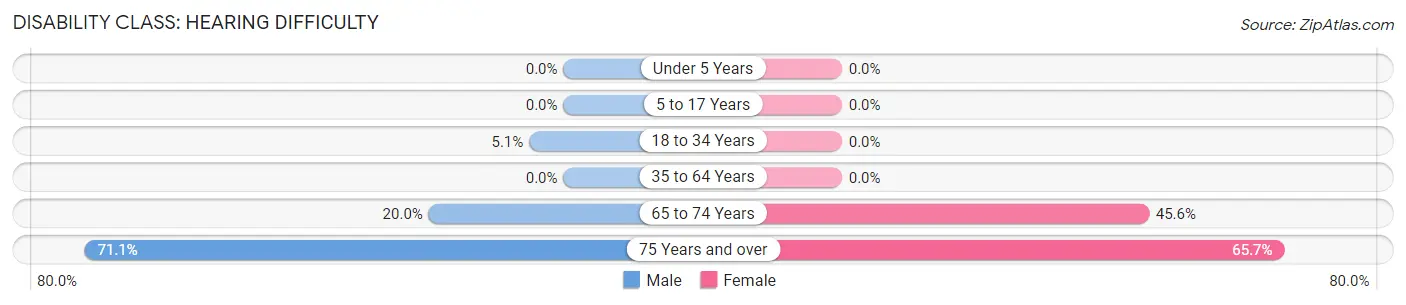
| Age Bracket | Male | Female |
| Under 5 Years | 0 (0.0%) | 0 (0.0%) |
| 5 to 17 Years | 0 (0.0%) | 0 (0.0%) |
| 18 to 34 Years | 10 (5.1%) | 0 (0.0%) |
| 35 to 64 Years | 0 (0.0%) | 0 (0.0%) |
| 65 to 74 Years | 14 (20.0%) | 31 (45.6%) |
| 75 Years and over | 32 (71.1%) | 23 (65.7%) |
Disability Class: Vision Difficulty
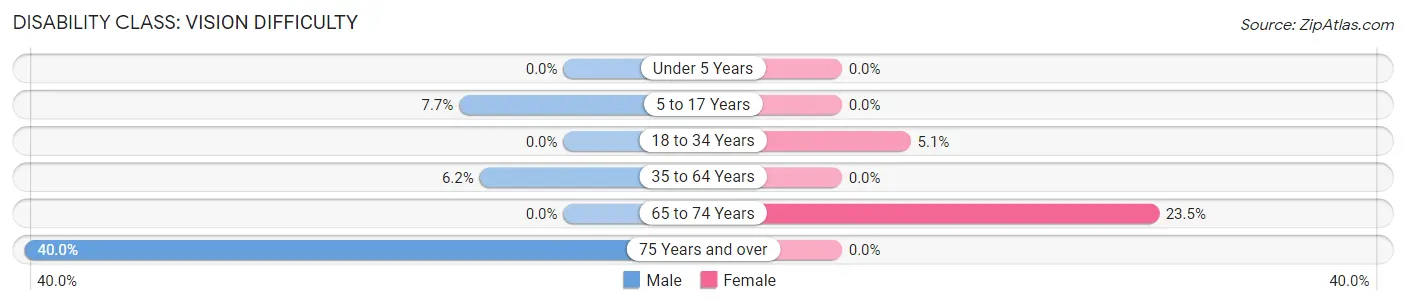
| Age Bracket | Male | Female |
| Under 5 Years | 0 (0.0%) | 0 (0.0%) |
| 5 to 17 Years | 36 (7.7%) | 0 (0.0%) |
| 18 to 34 Years | 0 (0.0%) | 17 (5.1%) |
| 35 to 64 Years | 15 (6.2%) | 0 (0.0%) |
| 65 to 74 Years | 0 (0.0%) | 16 (23.5%) |
| 75 Years and over | 18 (40.0%) | 0 (0.0%) |
Disability Class: Cognitive Difficulty
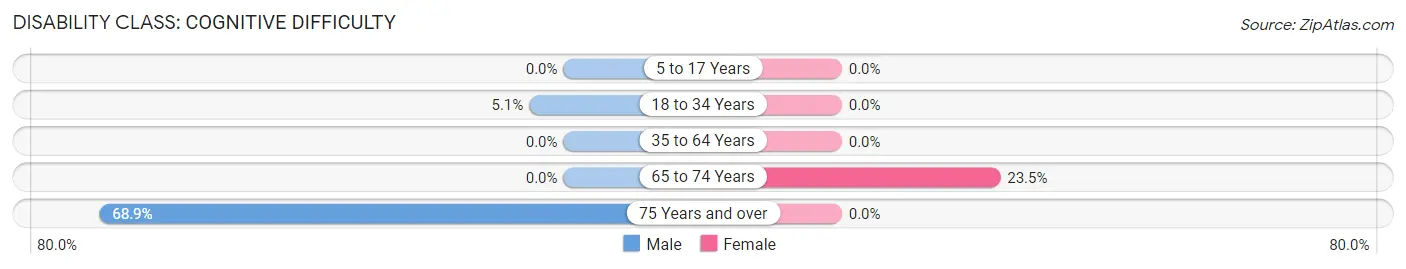
| Age Bracket | Male | Female |
| 5 to 17 Years | 0 (0.0%) | 0 (0.0%) |
| 18 to 34 Years | 10 (5.1%) | 0 (0.0%) |
| 35 to 64 Years | 0 (0.0%) | 0 (0.0%) |
| 65 to 74 Years | 0 (0.0%) | 16 (23.5%) |
| 75 Years and over | 31 (68.9%) | 0 (0.0%) |
Disability Class: Ambulatory Difficulty
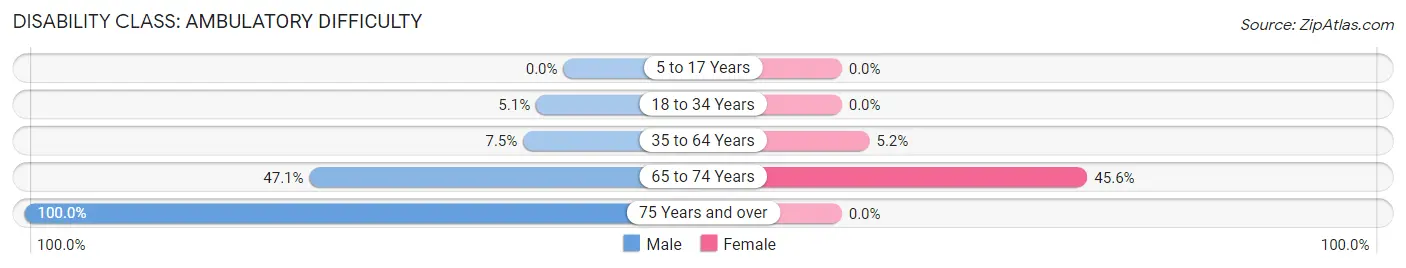
| Age Bracket | Male | Female |
| 5 to 17 Years | 0 (0.0%) | 0 (0.0%) |
| 18 to 34 Years | 10 (5.1%) | 0 (0.0%) |
| 35 to 64 Years | 18 (7.5%) | 14 (5.1%) |
| 65 to 74 Years | 33 (47.1%) | 31 (45.6%) |
| 75 Years and over | 45 (100.0%) | 0 (0.0%) |
Disability Class: Self-Care Difficulty
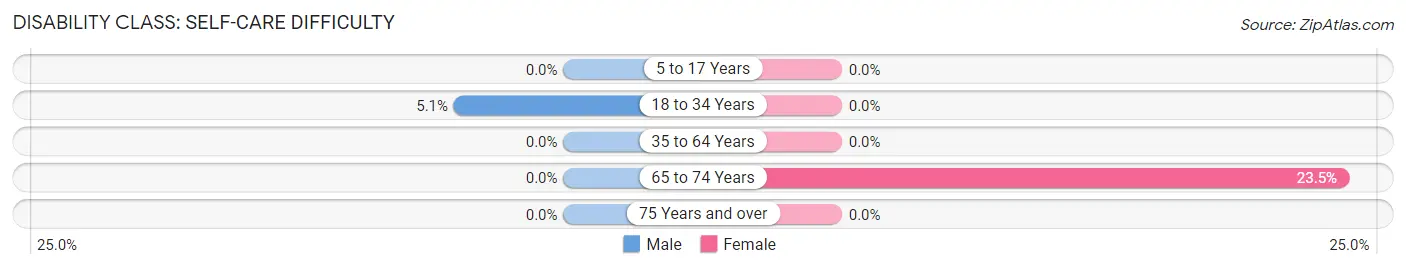
| Age Bracket | Male | Female |
| 5 to 17 Years | 0 (0.0%) | 0 (0.0%) |
| 18 to 34 Years | 10 (5.1%) | 0 (0.0%) |
| 35 to 64 Years | 0 (0.0%) | 0 (0.0%) |
| 65 to 74 Years | 0 (0.0%) | 16 (23.5%) |
| 75 Years and over | 0 (0.0%) | 0 (0.0%) |
Technology Access in Brewster
Computing Device Access in Brewster
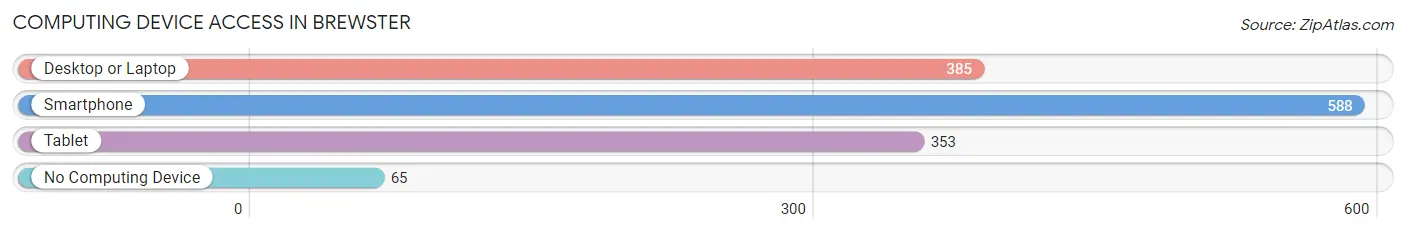
| Device Type | # Households | % Households |
| Desktop or Laptop | 385 | 54.8% |
| Smartphone | 588 | 83.8% |
| Tablet | 353 | 50.3% |
| No Computing Device | 65 | 9.3% |
| Total | 702 | 100.0% |
Internet Access in Brewster
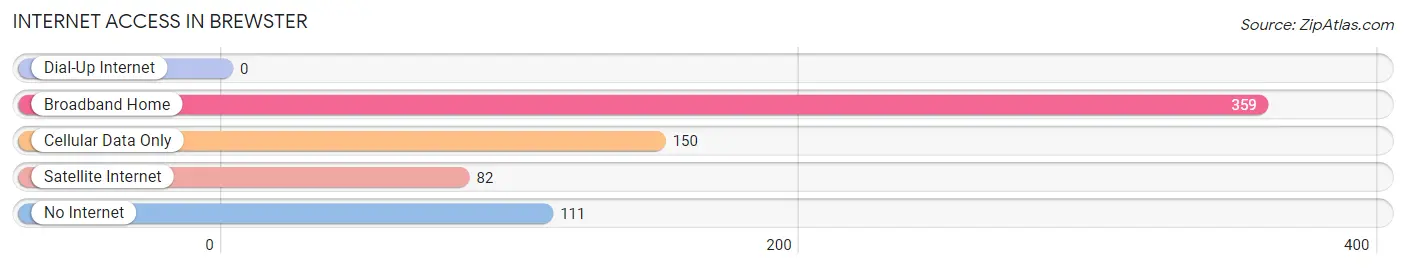
| Internet Type | # Households | % Households |
| Dial-Up Internet | 0 | 0.0% |
| Broadband Home | 359 | 51.1% |
| Cellular Data Only | 150 | 21.4% |
| Satellite Internet | 82 | 11.7% |
| No Internet | 111 | 15.8% |
| Total | 702 | 100.0% |
Brewster Summary
Brewster, Washington is a small city located in Okanogan County in the north-central part of the state. It is situated on the banks of the Columbia River, near the confluence of the Okanogan and Columbia Rivers. The city has a population of 2,370 as of the 2010 census, making it the largest city in Okanogan County.
Brewster is located in the heart of the Okanogan Valley, a region known for its agricultural production. The city is surrounded by orchards, vineyards, and farms, and is home to several wineries. The city is also known for its outdoor recreation opportunities, including fishing, hunting, camping, and hiking.
History
Brewster was founded in 1891 by a group of settlers from the Midwest. The city was named after William Brewster, a settler who had come to the area in the late 1880s. The city was incorporated in 1895, and the first mayor was elected in 1896.
The city grew rapidly in the early 20th century, and by 1910, it had a population of 1,000. The city was a major hub for the lumber industry, and the local economy was largely based on the production of lumber and wood products.
In the 1950s, the city began to diversify its economy, and the lumber industry began to decline. The city began to focus on agriculture, and the local economy shifted to include fruit and vegetable production.
Geography
Brewster is located in the Okanogan Valley, a region of rolling hills and fertile farmland. The city is situated on the banks of the Columbia River, near the confluence of the Okanogan and Columbia Rivers. The city is surrounded by orchards, vineyards, and farms, and is home to several wineries.
The city has a total area of 2.3 square miles, all of which is land. The city is located at an elevation of 1,068 feet above sea level.
Economy
The economy of Brewster is largely based on agriculture and tourism. The city is surrounded by orchards, vineyards, and farms, and is home to several wineries. The city is also known for its outdoor recreation opportunities, including fishing, hunting, camping, and hiking.
The city is home to several businesses, including a grocery store, a hardware store, a bank, and several restaurants. The city also has a hospital and a library.
Demographics
As of the 2010 census, the population of Brewster was 2,370. The racial makeup of the city was 87.3% White, 0.3% African American, 0.9% Native American, 0.3% Asian, 0.1% Pacific Islander, 8.2% from other races, and 2.9% from two or more races. Hispanic or Latino of any race were 16.2% of the population.
The median household income in Brewster was $35,938, and the median family income was $41,250. The per capita income for the city was $17,845. About 16.2% of families and 19.2% of the population were below the poverty line, including 25.2% of those under age 18 and 8.3% of those age 65 or over.
Common Questions
What is Per Capita Income in Brewster?
Per Capita income in Brewster is $18,865.
What is the Median Family Income in Brewster?
Median Family Income in Brewster is $58,148.
What is the Median Household income in Brewster?
Median Household Income in Brewster is $58,617.
What is Income or Wage Gap in Brewster?
Income or Wage Gap in Brewster is 15.0%.
Women in Brewster earn 85.0 cents for every dollar earned by a man.
What is Inequality or Gini Index in Brewster?
Inequality or Gini Index in Brewster is 0.39.
What is the Total Population of Brewster?
Total Population of Brewster is 2,241.
What is the Total Male Population of Brewster?
Total Male Population of Brewster is 1,317.
What is the Total Female Population of Brewster?
Total Female Population of Brewster is 924.
What is the Ratio of Males per 100 Females in Brewster?
There are 142.53 Males per 100 Females in Brewster.
What is the Ratio of Females per 100 Males in Brewster?
There are 70.16 Females per 100 Males in Brewster.
What is the Median Population Age in Brewster?
Median Population Age in Brewster is 25.4 Years.
What is the Average Family Size in Brewster
Average Family Size in Brewster is 3.6 People.
What is the Average Household Size in Brewster
Average Household Size in Brewster is 3.1 People.
How Large is the Labor Force in Brewster?
There are 899 People in the Labor Forcein in Brewster.
What is the Percentage of People in the Labor Force in Brewster?
64.7% of People are in the Labor Force in Brewster.
What is the Unemployment Rate in Brewster?
Unemployment Rate in Brewster is 3.6%.