Cities with the Highest Percentage of Births to Unmarried Women over the Age of 35 in Alaska

RELATED REPORTS & OPTIONS

Highest Illegitimacy | Women 35+
Population
Families and Households
Female Fertility
Female Fertility (Unmarried)
Race (Community Size)
Race (Percentage)
Ancestry (Community Size)
AfghanAfricanAlaska NativeAlaskan AthabascanAlbanianAleutAlsatianAmericanApacheArabArapahoArgentineanArmenianAssyrian / Chaldean / SyriacAustralianAustrianBahamianBangladeshiBarbadianBasqueBelgianBelizeanBermudanBhutaneseBlackfeetBolivianBrazilianBritishBritish West IndianBulgarianBurmeseCajunCambodianCanadianCape VerdeanCarpatho RusynCelticCentral AmericanCentral American IndianCherokeeCheyenneChickasawChileanChineseChippewaChoctawColombianColvilleComancheCosta RicanCreeCreekCroatianCrowCubanCypriotCzechCzechoslovakianDanishDelawareDominicanDutchDutch West IndianEastern EuropeanEcuadorianEgyptianEnglishEstonianEthiopianEuropeanFijianFilipinoFinnishFrenchFrench American IndianFrench CanadianGermanGerman RussianGhanaianGreekGuamanian / ChamorroGuatemalanGuyaneseHaitianHmongHonduranHopiHoumaHungarianIcelanderIndian (Asian)IndonesianInupiatIranianIraqiIrishIroquoisIsraeliItalianJamaicanJapaneseJordanianKenyanKiowaKoreanLaotianLatvianLebaneseLiberianLithuanianLumbeeLuxembourgerMacedonianMalaysianMalteseMarshalleseMenomineeMexicanMexican American IndianMongolianMoroccanNative HawaiianNavajoNepaleseNew ZealanderNicaraguanNigerianNorthern EuropeanNorwegianOkinawanOsageOttawaPaiutePakistaniPalestinianPanamanianParaguayanPennsylvania GermanPeruvianPimaPolishPortuguesePotawatomiPuebloPuerto RicanPuget Sound SalishRomanianRussianSalvadoranSamoanScandinavianScotch-IrishScottishSeminoleSenegaleseSerbianShoshoneSierra LeoneanSiouxSlavicSlovakSloveneSomaliSouth AfricanSouth AmericanSouth American IndianSoviet UnionSpaniardSpanishSpanish AmericanSpanish American IndianSri LankanSubsaharan AfricanSudaneseSwedishSwissSyrianTaiwaneseThaiTlingit-HaidaTohono O'OdhamTonganTrinidadian and TobagonianTsimshianTurkishU.S. Virgin IslanderUgandanUkrainianUruguayanUteVenezuelanVietnameseWelshWest IndianYakamaYaquiYugoslavianYumanYup'ikZimbabwean
Ancestry (Percentage)
AfghanAfricanAlaska NativeAlaskan AthabascanAlbanianAleutAlsatianAmericanApacheArabArapahoArgentineanArmenianAssyrian / Chaldean / SyriacAustralianAustrianBahamianBangladeshiBarbadianBasqueBelgianBelizeanBermudanBhutaneseBlackfeetBolivianBrazilianBritishBritish West IndianBulgarianBurmeseCajunCambodianCanadianCape VerdeanCarpatho RusynCelticCentral AmericanCentral American IndianCherokeeCheyenneChickasawChileanChineseChippewaChoctawColombianColvilleComancheCosta RicanCreeCreekCroatianCrowCubanCypriotCzechCzechoslovakianDanishDelawareDominicanDutchDutch West IndianEastern EuropeanEcuadorianEgyptianEnglishEstonianEthiopianEuropeanFijianFilipinoFinnishFrenchFrench American IndianFrench CanadianGermanGerman RussianGhanaianGreekGuamanian / ChamorroGuatemalanGuyaneseHaitianHmongHonduranHopiHoumaHungarianIcelanderIndian (Asian)IndonesianInupiatIranianIraqiIrishIroquoisIsraeliItalianJamaicanJapaneseJordanianKenyanKiowaKoreanLaotianLatvianLebaneseLiberianLithuanianLumbeeLuxembourgerMacedonianMalaysianMalteseMarshalleseMenomineeMexicanMexican American IndianMongolianMoroccanNative HawaiianNavajoNepaleseNew ZealanderNicaraguanNigerianNorthern EuropeanNorwegianOkinawanOsageOttawaPaiutePakistaniPalestinianPanamanianParaguayanPennsylvania GermanPeruvianPimaPolishPortuguesePotawatomiPuebloPuerto RicanPuget Sound SalishRomanianRussianSalvadoranSamoanScandinavianScotch-IrishScottishSeminoleSenegaleseSerbianShoshoneSierra LeoneanSiouxSlavicSlovakSloveneSomaliSouth AfricanSouth AmericanSouth American IndianSoviet UnionSpaniardSpanishSpanish AmericanSpanish American IndianSri LankanSubsaharan AfricanSudaneseSwedishSwissSyrianTaiwaneseThaiTlingit-HaidaTohono O'OdhamTonganTrinidadian and TobagonianTsimshianTurkishU.S. Virgin IslanderUgandanUkrainianUruguayanUteVenezuelanVietnameseWelshWest IndianYakamaYaquiYugoslavianYumanYup'ikZimbabwean
Immigrant Origin (Total)
AfghanistanAfricaAlbaniaArgentinaArmeniaAsiaAustraliaAustriaAzoresBahamasBangladeshBarbadosBelarusBelgiumBelizeBoliviaBosnia and HerzegovinaBrazilBulgariaBurma / MyanmarCabo VerdeCambodiaCameroonCanadaCaribbeanCentral AmericaChileChinaColombiaCongoCosta RicaCroatiaCubaCzechoslovakiaDenmarkDominicaDominican RepublicEastern AfricaEastern AsiaEastern EuropeEcuadorEgyptEl SalvadorEnglandEritreaEthiopiaEuropeFijiFranceGermanyGhanaGreeceGrenadaGuatemalaGuyanaHaitiHondurasHong KongHungaryIndiaIndonesiaIranIraqIrelandIsraelItalyJamaicaJapanJordanKazakhstanKenyaKoreaKuwaitLaosLatin AmericaLatviaLebanonLiberiaLithuaniaMalaysiaMexicoMicronesiaMiddle AfricaMoldovaMoroccoNepalNetherlandsNicaraguaNigeriaNorth MacedoniaNorthern AfricaNorthern EuropeNorwayOceaniaPakistanPanamaPeruPhilippinesPolandPortugalRomaniaRussiaSaudi ArabiaScotlandSenegalSerbiaSierra LeoneSingaporeSomaliaSouth AfricaSouth AmericaSouth Central AsiaSouth Eastern AsiaSouthern EuropeSpainSri LankaSt. Vincent and the GrenadinesSudanSwedenSwitzerlandSyriaTaiwanThailandTrinidad and TobagoTurkeyUgandaUkraineUruguayUzbekistanVenezuelaVietnamWest IndiesWestern AfricaWestern AsiaWestern EuropeYemenZaireZimbabwe
Immigrant Origin (Percentage)
AfghanistanAfricaAlbaniaArgentinaArmeniaAsiaAustraliaAustriaAzoresBahamasBangladeshBarbadosBelarusBelgiumBelizeBoliviaBosnia and HerzegovinaBrazilBulgariaBurma / MyanmarCabo VerdeCambodiaCameroonCanadaCaribbeanCentral AmericaChileChinaColombiaCongoCosta RicaCroatiaCubaCzechoslovakiaDenmarkDominicaDominican RepublicEastern AfricaEastern AsiaEastern EuropeEcuadorEgyptEl SalvadorEnglandEritreaEthiopiaEuropeFijiFranceGermanyGhanaGreeceGrenadaGuatemalaGuyanaHaitiHondurasHong KongHungaryIndiaIndonesiaIranIraqIrelandIsraelItalyJamaicaJapanJordanKazakhstanKenyaKoreaKuwaitLaosLatin AmericaLatviaLebanonLiberiaLithuaniaMalaysiaMexicoMicronesiaMiddle AfricaMoldovaMoroccoNepalNetherlandsNicaraguaNigeriaNorth MacedoniaNorthern AfricaNorthern EuropeNorwayOceaniaPakistanPanamaPeruPhilippinesPolandPortugalRomaniaRussiaSaudi ArabiaScotlandSenegalSerbiaSierra LeoneSingaporeSomaliaSouth AfricaSouth AmericaSouth Central AsiaSouth Eastern AsiaSouthern EuropeSpainSri LankaSt. Vincent and the GrenadinesSudanSwedenSwitzerlandSyriaTaiwanThailandTrinidad and TobagoTurkeyUgandaUkraineUruguayUzbekistanVenezuelaVietnamWest IndiesWestern AfricaWestern AsiaWestern EuropeYemenZaireZimbabwe
Income
Income (Families)
Income (Households)
Poverty
Poverty (Families)
Unemployment
Employment Occupations
Employment Industries
Employer Class
Commute Time
Commute Means
School Enrollment
Education by Degree Field
Occupancy
Finances
Physical Characteristics
Alaska
Compare Cities
Comparison Subject

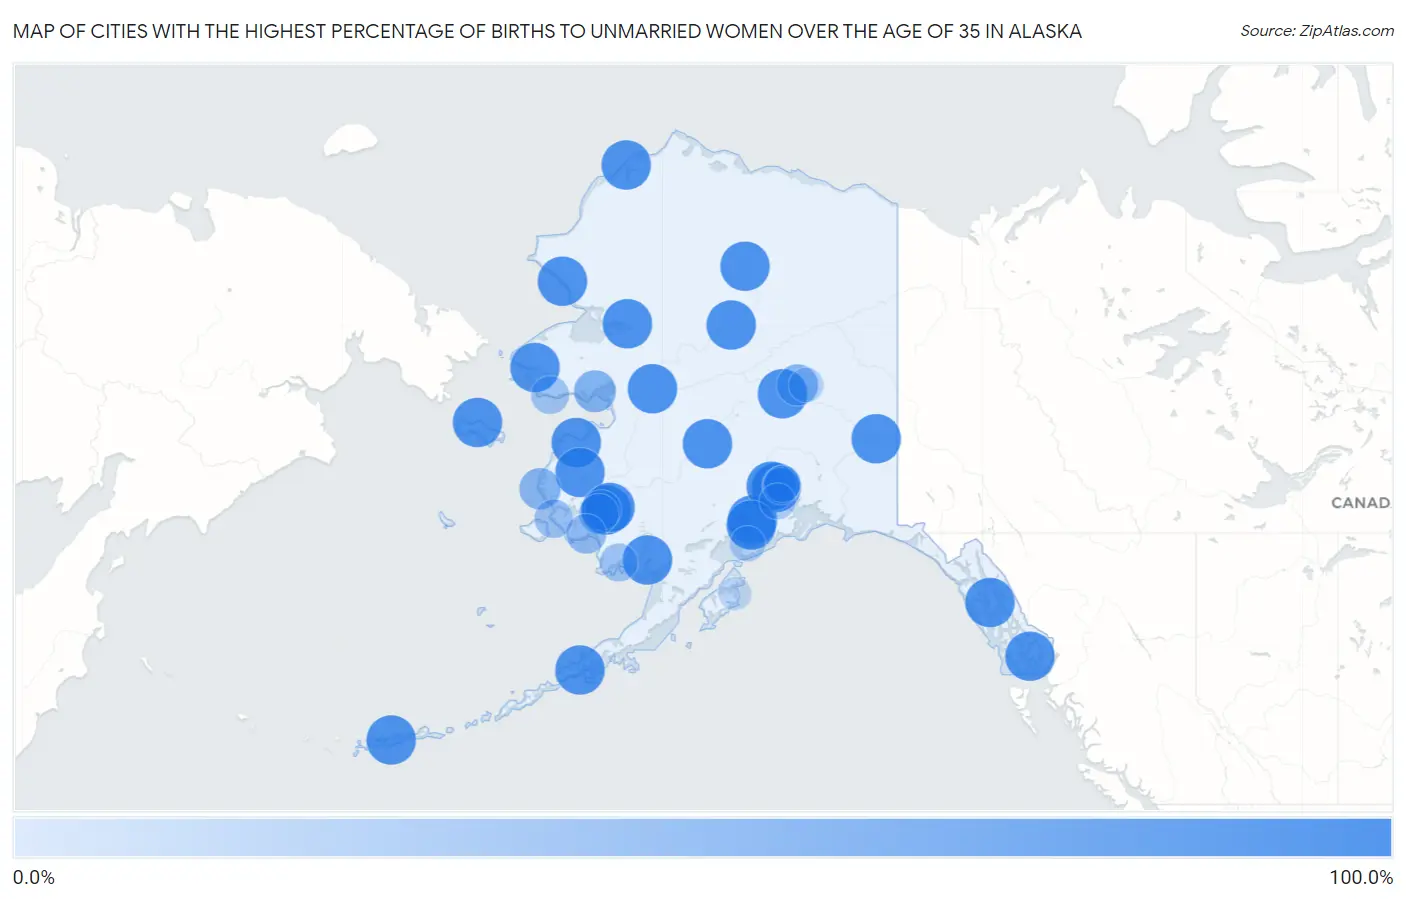
Map of Cities with the Highest Percentage of Births to Unmarried Women over the Age of 35 in Alaska

0.0%
100.0%
Cities with the Highest Percentage of Births to Unmarried Women over the Age of 35 in Alaska Map

Cities with the Highest Percentage of Births to Unmarried Women over the Age of 35 in Alaska

City % Unmarried vs State vs National
1.Wasilla100.0%24.9%(+75.1)#120.1%(+79.9)#206
2.Kalifornsky100.0%24.9%(+75.1)#220.1%(+79.9)#229
3.Ketchikan100.0%24.9%(+75.1)#320.1%(+79.9)#238
4.Dillingham100.0%24.9%(+75.1)#420.1%(+79.9)#676
5.Houston100.0%24.9%(+75.1)#520.1%(+79.9)#804
6.Cohoe100.0%24.9%(+75.1)#620.1%(+79.9)#827
7.Kotlik100.0%24.9%(+75.1)#720.1%(+79.9)#891
8.St Mary S100.0%24.9%(+75.1)#820.1%(+79.9)#973
9.Savoonga100.0%24.9%(+75.1)#920.1%(+79.9)#1,054
10.Kivalina100.0%24.9%(+75.1)#1020.1%(+79.9)#1,071
11.Brevig Mission100.0%24.9%(+75.1)#1120.1%(+79.9)#1,136
12.Wainwright100.0%24.9%(+75.1)#1220.1%(+79.9)#1,139
13.Kwethluk100.0%24.9%(+75.1)#1320.1%(+79.9)#1,171
14.Selawik100.0%24.9%(+75.1)#1420.1%(+79.9)#1,174
15.Nenana100.0%24.9%(+75.1)#1520.1%(+79.9)#1,209
16.Angoon100.0%24.9%(+75.1)#1620.1%(+79.9)#1,258
17.Akiak100.0%24.9%(+75.1)#1720.1%(+79.9)#1,314
18.Nulato100.0%24.9%(+75.1)#1820.1%(+79.9)#1,346
19.Adak100.0%24.9%(+75.1)#1920.1%(+79.9)#1,347
20.Anaktuvuk Pass100.0%24.9%(+75.1)#2020.1%(+79.9)#1,372
21.Allakaket100.0%24.9%(+75.1)#2120.1%(+79.9)#1,376
22.Tetlin100.0%24.9%(+75.1)#2220.1%(+79.9)#1,384
23.False Pass100.0%24.9%(+75.1)#2320.1%(+79.9)#1,428
24.Nikolai100.0%24.9%(+75.1)#2420.1%(+79.9)#1,438
25.Elim60.0%24.9%(+35.1)#2520.1%(+39.9)#1,895
26.Chena Ridge57.5%24.9%(+32.6)#2620.1%(+37.4)#1,942
27.Hooper Bay57.1%24.9%(+32.2)#2720.1%(+37.0)#1,960
28.South Lakes51.7%24.9%(+26.8)#2820.1%(+31.6)#2,074
29.Bethel50.0%24.9%(+25.1)#2920.1%(+29.9)#2,130
30.Napakiak50.0%24.9%(+25.1)#3020.1%(+29.9)#2,151
31.Kongiganak50.0%24.9%(+25.1)#3120.1%(+29.9)#2,160
32.Toksook Bay42.9%24.9%(+18.0)#3220.1%(+22.8)#2,360
33.Nome40.0%24.9%(+15.1)#3320.1%(+19.9)#2,438
34.Togiak40.0%24.9%(+15.1)#3420.1%(+19.9)#2,446
35.Farm Loop37.5%24.9%(+12.6)#3520.1%(+17.4)#2,533
36.Palmer33.3%24.9%(+8.40)#3620.1%(+13.2)#2,701
37.Buffalo Soapstone33.3%24.9%(+8.40)#3720.1%(+13.2)#2,719
38.Anchorage30.2%24.9%(+5.30)#3820.1%(+10.1)#2,830
39.Homer27.3%24.9%(+2.40)#3920.1%(+7.20)#2,971
40.Badger22.7%24.9%(-2.20)#4020.1%(+2.60)#3,174
41.Kodiak14.7%24.9%(-10.2)#4120.1%(-5.40)#3,593
42.Sitka City And Borough5.4%24.9%(-19.5)#4220.1%(-14.7)#4,050

Common Questions

What are the Top 10 Cities with the Highest Percentage of Births to Unmarried Women over the Age of 35 in Alaska?
Top 10 Cities with the Highest Percentage of Births to Unmarried Women over the Age of 35 in Alaska are:
#1
100.0%
#2
100.0%
#3
100.0%
#4
100.0%
#5
100.0%
#6
100.0%
#7
100.0%
#8
100.0%
#9
100.0%
#10
100.0%
What city has the Highest Percentage of Births to Unmarried Women over the Age of 35 in Alaska?
Wasilla has the Highest Percentage of Births to Unmarried Women over the Age of 35 in Alaska with 100.0%.
What is the Percentage of Births to Unmarried Women over the Age of 35 in the State of Alaska?
Percentage of Births to Unmarried Women over the Age of 35 in Alaska is 24.9%.
What is the Percentage of Births to Unmarried Women over the Age of 35 in the United States?
Percentage of Births to Unmarried Women over the Age of 35 in the United States is 20.1%.