Cities with the Highest Percentage of Births to Unmarried Women over the Age of 35 in Minnesota
RELATED REPORTS & OPTIONS
Highest Illegitimacy | Women 35+
Minnesota
Compare Cities
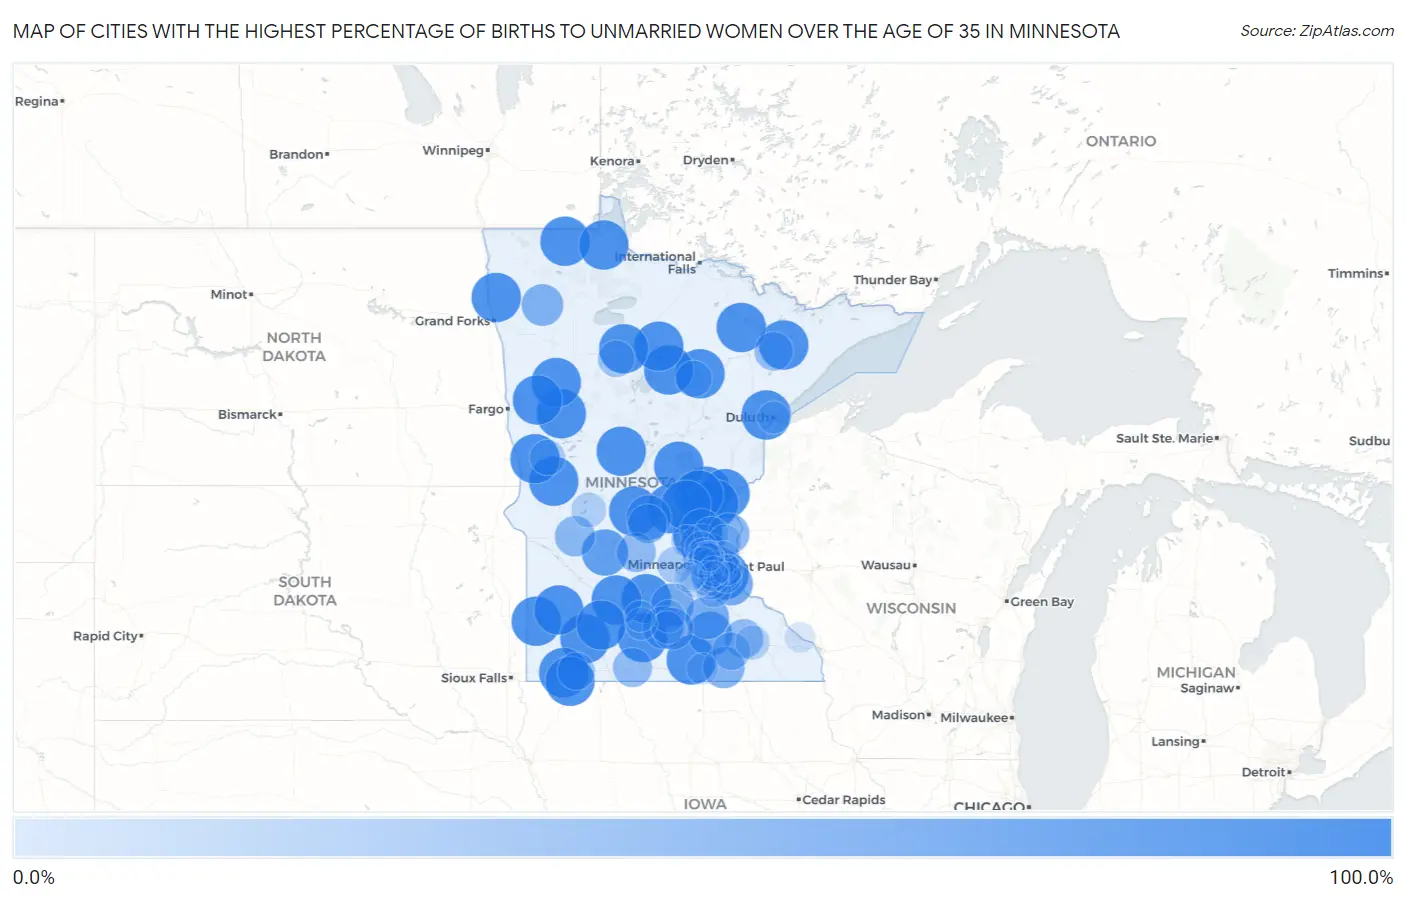
Map of Cities with the Highest Percentage of Births to Unmarried Women over the Age of 35 in Minnesota
0.0%
100.0%
Cities with the Highest Percentage of Births to Unmarried Women over the Age of 35 in Minnesota
| City | % Unmarried | vs State | vs National | |
| 1. | Hermantown | 100.0% | 14.8%(+85.2)#1 | 20.1%(+79.9)#182 |
| 2. | Detroit Lakes | 100.0% | 14.8%(+85.2)#2 | 20.1%(+79.9)#186 |
| 3. | St Paul Park | 100.0% | 14.8%(+85.2)#3 | 20.1%(+79.9)#355 |
| 4. | Nowthen | 100.0% | 14.8%(+85.2)#4 | 20.1%(+79.9)#416 |
| 5. | Mora | 100.0% | 14.8%(+85.2)#5 | 20.1%(+79.9)#480 |
| 6. | Pine City | 100.0% | 14.8%(+85.2)#6 | 20.1%(+79.9)#522 |
| 7. | Albany | 100.0% | 14.8%(+85.2)#7 | 20.1%(+79.9)#573 |
| 8. | Roseau | 100.0% | 14.8%(+85.2)#8 | 20.1%(+79.9)#582 |
| 9. | Foley | 100.0% | 14.8%(+85.2)#9 | 20.1%(+79.9)#594 |
| 10. | Madelia | 100.0% | 14.8%(+85.2)#10 | 20.1%(+79.9)#653 |
| 11. | Staples | 100.0% | 14.8%(+85.2)#11 | 20.1%(+79.9)#658 |
| 12. | Braham | 100.0% | 14.8%(+85.2)#12 | 20.1%(+79.9)#785 |
| 13. | Babbitt | 100.0% | 14.8%(+85.2)#13 | 20.1%(+79.9)#858 |
| 14. | Winthrop | 100.0% | 14.8%(+85.2)#14 | 20.1%(+79.9)#884 |
| 15. | Elbow Lake | 100.0% | 14.8%(+85.2)#15 | 20.1%(+79.9)#930 |
| 16. | Westbrook | 100.0% | 14.8%(+85.2)#16 | 20.1%(+79.9)#1,052 |
| 17. | Vineland | 100.0% | 14.8%(+85.2)#17 | 20.1%(+79.9)#1,060 |
| 18. | Bovey | 100.0% | 14.8%(+85.2)#18 | 20.1%(+79.9)#1,061 |
| 19. | Lake Benton | 100.0% | 14.8%(+85.2)#19 | 20.1%(+79.9)#1,126 |
| 20. | Franklin | 100.0% | 14.8%(+85.2)#20 | 20.1%(+79.9)#1,189 |
| 21. | Lynd | 100.0% | 14.8%(+85.2)#21 | 20.1%(+79.9)#1,202 |
| 22. | Cook | 100.0% | 14.8%(+85.2)#22 | 20.1%(+79.9)#1,235 |
| 23. | Ogilvie | 100.0% | 14.8%(+85.2)#23 | 20.1%(+79.9)#1,261 |
| 24. | Waubun | 100.0% | 14.8%(+85.2)#24 | 20.1%(+79.9)#1,271 |
| 25. | Sanborn | 100.0% | 14.8%(+85.2)#25 | 20.1%(+79.9)#1,288 |
| 26. | Rushmore | 100.0% | 14.8%(+85.2)#26 | 20.1%(+79.9)#1,295 |
| 27. | Hitterdal | 100.0% | 14.8%(+85.2)#27 | 20.1%(+79.9)#1,301 |
| 28. | Freeborn | 100.0% | 14.8%(+85.2)#28 | 20.1%(+79.9)#1,309 |
| 29. | Alvarado | 100.0% | 14.8%(+85.2)#29 | 20.1%(+79.9)#1,330 |
| 30. | Bigelow | 100.0% | 14.8%(+85.2)#30 | 20.1%(+79.9)#1,341 |
| 31. | Pease | 100.0% | 14.8%(+85.2)#31 | 20.1%(+79.9)#1,373 |
| 32. | Roosevelt | 100.0% | 14.8%(+85.2)#32 | 20.1%(+79.9)#1,399 |
| 33. | Ball Club | 100.0% | 14.8%(+85.2)#33 | 20.1%(+79.9)#1,421 |
| 34. | Foxhome | 100.0% | 14.8%(+85.2)#34 | 20.1%(+79.9)#1,424 |
| 35. | Squaw Lake | 100.0% | 14.8%(+85.2)#35 | 20.1%(+79.9)#1,430 |
| 36. | Turtle River | 100.0% | 14.8%(+85.2)#36 | 20.1%(+79.9)#1,446 |
| 37. | Willmar | 85.2% | 14.8%(+70.4)#37 | 20.1%(+65.1)#1,510 |
| 38. | St Joseph | 76.5% | 14.8%(+61.7)#38 | 20.1%(+56.4)#1,597 |
| 39. | Owatonna | 75.0% | 14.8%(+60.2)#39 | 20.1%(+54.9)#1,611 |
| 40. | Hastings | 70.0% | 14.8%(+55.2)#40 | 20.1%(+49.9)#1,676 |
| 41. | Faribault | 69.7% | 14.8%(+54.9)#41 | 20.1%(+49.6)#1,679 |
| 42. | Le Sueur | 69.5% | 14.8%(+54.7)#42 | 20.1%(+49.4)#1,684 |
| 43. | North Mankato | 66.7% | 14.8%(+51.9)#43 | 20.1%(+46.6)#1,720 |
| 44. | St Francis | 64.7% | 14.8%(+49.9)#44 | 20.1%(+44.6)#1,770 |
| 45. | Anoka | 63.6% | 14.8%(+48.8)#45 | 20.1%(+43.5)#1,800 |
| 46. | St Anthony City Hennepin And Ramsey Counties | 63.2% | 14.8%(+48.4)#46 | 20.1%(+43.1)#1,810 |
| 47. | Eagle Lake | 62.5% | 14.8%(+47.7)#47 | 20.1%(+42.4)#1,827 |
| 48. | Thief River Falls | 62.2% | 14.8%(+47.4)#48 | 20.1%(+42.1)#1,838 |
| 49. | Austin | 61.6% | 14.8%(+46.8)#49 | 20.1%(+41.5)#1,852 |
| 50. | Chisago City | 60.0% | 14.8%(+45.2)#50 | 20.1%(+39.9)#1,887 |
| 51. | Benson | 55.2% | 14.8%(+40.4)#51 | 20.1%(+35.1)#1,992 |
| 52. | South St Paul | 53.8% | 14.8%(+39.0)#52 | 20.1%(+33.7)#2,021 |
| 53. | Crystal | 50.0% | 14.8%(+35.2)#53 | 20.1%(+29.9)#2,115 |
| 54. | Litchfield | 50.0% | 14.8%(+35.2)#54 | 20.1%(+29.9)#2,127 |
| 55. | Byron | 50.0% | 14.8%(+35.2)#55 | 20.1%(+29.9)#2,129 |
| 56. | Rockville | 50.0% | 14.8%(+35.2)#56 | 20.1%(+29.9)#2,139 |
| 57. | Welcome | 50.0% | 14.8%(+35.2)#57 | 20.1%(+29.9)#2,149 |
| 58. | Spring Lake Park | 47.6% | 14.8%(+32.8)#58 | 20.1%(+27.5)#2,209 |
| 59. | Hoyt Lakes | 47.1% | 14.8%(+32.3)#59 | 20.1%(+27.0)#2,226 |
| 60. | Hayfield | 43.5% | 14.8%(+28.7)#60 | 20.1%(+23.4)#2,335 |
| 61. | Worthington | 41.0% | 14.8%(+26.2)#61 | 20.1%(+20.9)#2,403 |
| 62. | Bemidji | 38.2% | 14.8%(+23.4)#62 | 20.1%(+18.1)#2,496 |
| 63. | Maplewood | 38.0% | 14.8%(+23.2)#63 | 20.1%(+17.9)#2,507 |
| 64. | Grand Rapids | 36.2% | 14.8%(+21.4)#64 | 20.1%(+16.1)#2,577 |
| 65. | Watertown | 34.1% | 14.8%(+19.3)#65 | 20.1%(+14.0)#2,664 |
| 66. | Fergus Falls | 31.9% | 14.8%(+17.1)#66 | 20.1%(+11.8)#2,773 |
| 67. | Glenwood | 28.6% | 14.8%(+13.8)#67 | 20.1%(+8.50)#2,910 |
| 68. | Farmington | 27.0% | 14.8%(+12.2)#68 | 20.1%(+6.90)#2,984 |
| 69. | Rochester | 25.8% | 14.8%(+11.0)#69 | 20.1%(+5.70)#3,041 |
| 70. | East Bethel | 25.8% | 14.8%(+11.0)#70 | 20.1%(+5.70)#3,046 |
| 71. | Apple Valley | 25.6% | 14.8%(+10.8)#71 | 20.1%(+5.50)#3,050 |
| 72. | Richfield | 24.2% | 14.8%(+9.40)#72 | 20.1%(+4.10)#3,111 |
| 73. | New Brighton | 23.6% | 14.8%(+8.80)#73 | 20.1%(+3.50)#3,135 |
| 74. | Forest Lake | 22.2% | 14.8%(+7.40)#74 | 20.1%(+2.10)#3,191 |
| 75. | Birchwood Village | 20.0% | 14.8%(+5.20)#75 | 20.1%(-0.100)#3,310 |
| 76. | Otsego | 19.3% | 14.8%(+4.50)#76 | 20.1%(-0.800)#3,345 |
| 77. | St Peter | 19.2% | 14.8%(+4.40)#77 | 20.1%(-0.900)#3,346 |
| 78. | Burnsville | 19.0% | 14.8%(+4.20)#78 | 20.1%(-1.10)#3,351 |
| 79. | Mankato | 18.8% | 14.8%(+4.00)#79 | 20.1%(-1.30)#3,361 |
| 80. | Champlin | 18.4% | 14.8%(+3.60)#80 | 20.1%(-1.70)#3,382 |
| 81. | St Paul | 18.0% | 14.8%(+3.20)#81 | 20.1%(-2.10)#3,401 |
| 82. | Minneapolis | 17.9% | 14.8%(+3.10)#82 | 20.1%(-2.20)#3,409 |
| 83. | Shakopee | 17.5% | 14.8%(+2.70)#83 | 20.1%(-2.60)#3,431 |
| 84. | Brooklyn Center | 17.2% | 14.8%(+2.40)#84 | 20.1%(-2.90)#3,449 |
| 85. | Duluth | 17.0% | 14.8%(+2.20)#85 | 20.1%(-3.10)#3,454 |
| 86. | Searles | 16.7% | 14.8%(+1.90)#86 | 20.1%(-3.40)#3,481 |
| 87. | Brooklyn Park | 15.1% | 14.8%(+0.300)#87 | 20.1%(-5.00)#3,565 |
| 88. | Albert Lea | 13.4% | 14.8%(-1.40)#88 | 20.1%(-6.70)#3,676 |
| 89. | New Ulm | 12.2% | 14.8%(-2.60)#89 | 20.1%(-7.90)#3,745 |
| 90. | Columbia Heights | 10.4% | 14.8%(-4.40)#90 | 20.1%(-9.70)#3,821 |
| 91. | Bloomington | 10.1% | 14.8%(-4.70)#91 | 20.1%(-10.0)#3,831 |
| 92. | Cottage Grove | 9.7% | 14.8%(-5.10)#92 | 20.1%(-10.4)#3,854 |
| 93. | Winona | 9.1% | 14.8%(-5.70)#93 | 20.1%(-11.0)#3,879 |
| 94. | Golden Valley | 8.9% | 14.8%(-5.90)#94 | 20.1%(-11.2)#3,889 |
| 95. | Woodbury | 8.7% | 14.8%(-6.10)#95 | 20.1%(-11.4)#3,894 |
| 96. | Mendota Heights | 8.7% | 14.8%(-6.10)#96 | 20.1%(-11.4)#3,899 |
| 97. | Eagan | 7.9% | 14.8%(-6.90)#97 | 20.1%(-12.2)#3,931 |
| 98. | Fridley | 7.9% | 14.8%(-6.90)#98 | 20.1%(-12.2)#3,937 |
| 99. | Chanhassen | 7.8% | 14.8%(-7.00)#99 | 20.1%(-12.3)#3,943 |
| 100. | Chaska | 7.2% | 14.8%(-7.60)#100 | 20.1%(-12.9)#3,968 |
Common Questions
What are the Top 10 Cities with the Highest Percentage of Births to Unmarried Women over the Age of 35 in Minnesota?
Top 10 Cities with the Highest Percentage of Births to Unmarried Women over the Age of 35 in Minnesota are:
#1
100.0%
#2
100.0%
#3
100.0%
#4
100.0%
#5
100.0%
#6
100.0%
#7
100.0%
#8
100.0%
#9
100.0%
#10
100.0%
What city has the Highest Percentage of Births to Unmarried Women over the Age of 35 in Minnesota?
Hermantown has the Highest Percentage of Births to Unmarried Women over the Age of 35 in Minnesota with 100.0%.
What is the Percentage of Births to Unmarried Women over the Age of 35 in the State of Minnesota?
Percentage of Births to Unmarried Women over the Age of 35 in Minnesota is 14.8%.
What is the Percentage of Births to Unmarried Women over the Age of 35 in the United States?
Percentage of Births to Unmarried Women over the Age of 35 in the United States is 20.1%.