Harrah, WA Map & Demographics
Harrah Map
Harrah Overview
$28,174
PER CAPITA INCOME
$65,938
AVG FAMILY INCOME
$68,333
AVG HOUSEHOLD INCOME
24.3%
WAGE / INCOME GAP [ % ]
75.7¢/ $1
WAGE / INCOME GAP [ $ ]
0.38
INEQUALITY / GINI INDEX
640
TOTAL POPULATION
306
MALE POPULATION
334
FEMALE POPULATION
91.62
MALES / 100 FEMALES
109.15
FEMALES / 100 MALES
35.2
MEDIAN AGE
3.4
AVG FAMILY SIZE
3.0
AVG HOUSEHOLD SIZE
346
LABOR FORCE [ PEOPLE ]
67.7%
PERCENT IN LABOR FORCE
11.6%
UNEMPLOYMENT RATE
Harrah Zip Codes
Harrah Area Codes
Income in Harrah
Income Overview in Harrah
Per Capita Income in Harrah is $28,174, while median incomes of families and households are $65,938 and $68,333 respectively.
| Characteristic | Number | Measure |
| Per Capita Income | 640 | $28,174 |
| Median Family Income | 161 | $65,938 |
| Mean Family Income | 161 | $88,048 |
| Median Household Income | 210 | $68,333 |
| Mean Household Income | 210 | $86,603 |
| Income Deficit | 161 | $0 |
| Wage / Income Gap (%) | 640 | 24.30% |
| Wage / Income Gap ($) | 640 | 75.70¢ per $1 |
| Gini / Inequality Index | 640 | 0.38 |
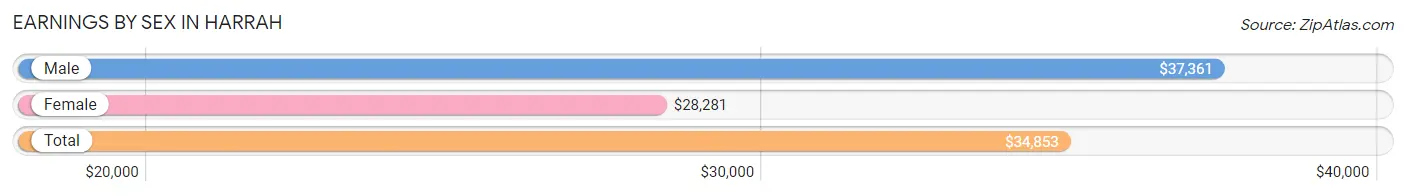
Earnings by Sex in Harrah
Average Earnings in Harrah are $34,853, $37,361 for men and $28,281 for women, a difference of 24.3%.
| Sex | Number | Average Earnings |
| Male | 203 (56.4%) | $37,361 |
| Female | 157 (43.6%) | $28,281 |
| Total | 360 (100.0%) | $34,853 |
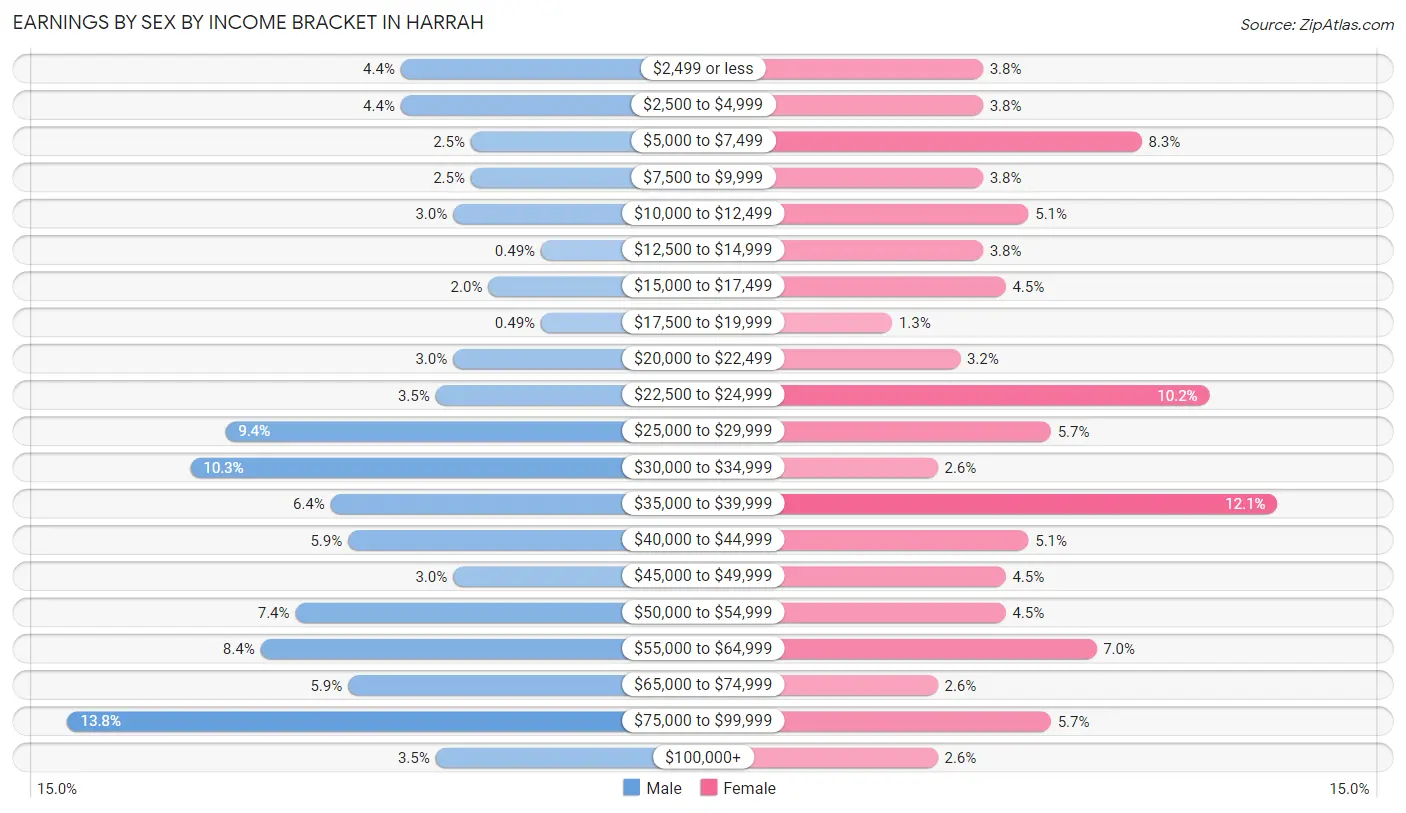
Earnings by Sex by Income Bracket in Harrah
The most common earnings brackets in Harrah are $75,000 to $99,999 for men (28 | 13.8%) and $35,000 to $39,999 for women (19 | 12.1%).
| Income | Male | Female |
| $2,499 or less | 9 (4.4%) | 6 (3.8%) |
| $2,500 to $4,999 | 9 (4.4%) | 6 (3.8%) |
| $5,000 to $7,499 | 5 (2.5%) | 13 (8.3%) |
| $7,500 to $9,999 | 5 (2.5%) | 6 (3.8%) |
| $10,000 to $12,499 | 6 (3.0%) | 8 (5.1%) |
| $12,500 to $14,999 | 1 (0.5%) | 6 (3.8%) |
| $15,000 to $17,499 | 4 (2.0%) | 7 (4.5%) |
| $17,500 to $19,999 | 1 (0.5%) | 2 (1.3%) |
| $20,000 to $22,499 | 6 (3.0%) | 5 (3.2%) |
| $22,500 to $24,999 | 7 (3.5%) | 16 (10.2%) |
| $25,000 to $29,999 | 19 (9.4%) | 9 (5.7%) |
| $30,000 to $34,999 | 21 (10.3%) | 4 (2.5%) |
| $35,000 to $39,999 | 13 (6.4%) | 19 (12.1%) |
| $40,000 to $44,999 | 12 (5.9%) | 8 (5.1%) |
| $45,000 to $49,999 | 6 (3.0%) | 7 (4.5%) |
| $50,000 to $54,999 | 15 (7.4%) | 7 (4.5%) |
| $55,000 to $64,999 | 17 (8.4%) | 11 (7.0%) |
| $65,000 to $74,999 | 12 (5.9%) | 4 (2.5%) |
| $75,000 to $99,999 | 28 (13.8%) | 9 (5.7%) |
| $100,000+ | 7 (3.5%) | 4 (2.5%) |
| Total | 203 (100.0%) | 157 (100.0%) |
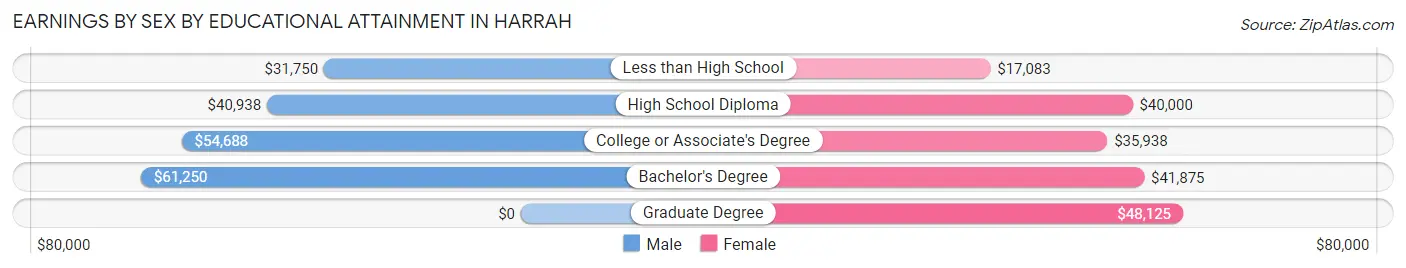
Earnings by Sex by Educational Attainment in Harrah
Average earnings in Harrah are $43,214 for men and $35,667 for women, a difference of 17.5%. Men with an educational attainment of bachelor's degree enjoy the highest average annual earnings of $61,250, while those with less than high school education earn the least with $31,750. Women with an educational attainment of graduate degree earn the most with the average annual earnings of $48,125, while those with less than high school education have the smallest earnings of $17,083.
| Educational Attainment | Male Income | Female Income |
| Less than High School | $31,750 | $17,083 |
| High School Diploma | $40,938 | $40,000 |
| College or Associate's Degree | $54,688 | $35,938 |
| Bachelor's Degree | $61,250 | $41,875 |
| Graduate Degree | - | - |
| Total | $43,214 | $35,667 |
Family Income in Harrah
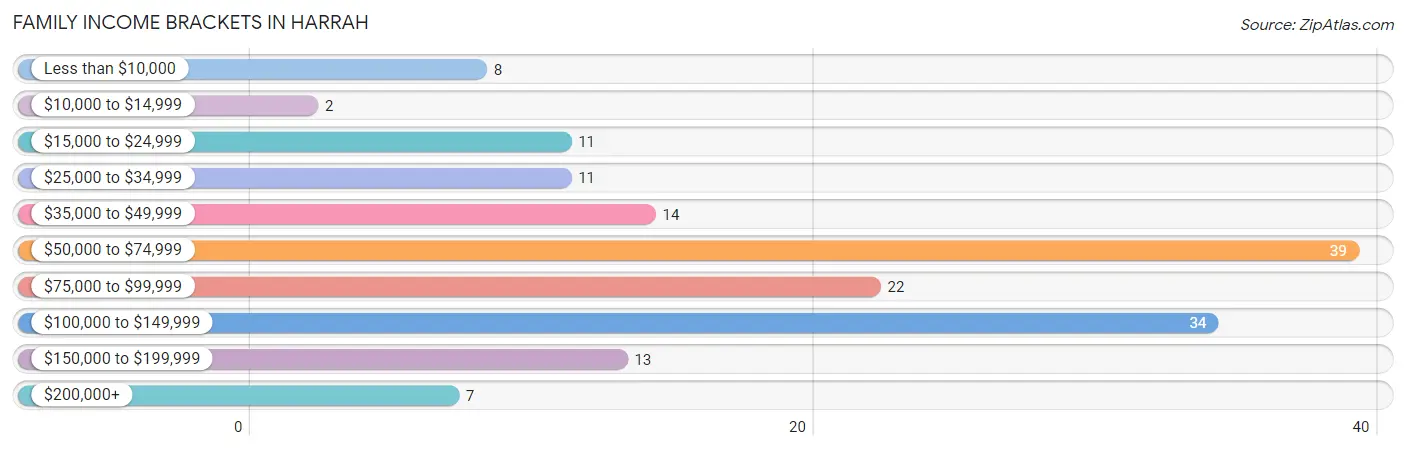
Family Income Brackets in Harrah
According to the Harrah family income data, there are 39 families falling into the $50,000 to $74,999 income range, which is the most common income bracket and makes up 24.2% of all families. Conversely, the $10,000 to $14,999 income bracket is the least frequent group with only 2 families (1.2%) belonging to this category.
| Income Bracket | # Families | % Families |
| Less than $10,000 | 8 | 5.0% |
| $10,000 to $14,999 | 2 | 1.2% |
| $15,000 to $24,999 | 11 | 6.8% |
| $25,000 to $34,999 | 11 | 6.8% |
| $35,000 to $49,999 | 14 | 8.7% |
| $50,000 to $74,999 | 39 | 24.2% |
| $75,000 to $99,999 | 22 | 13.7% |
| $100,000 to $149,999 | 34 | 21.1% |
| $150,000 to $199,999 | 13 | 8.1% |
| $200,000+ | 7 | 4.3% |
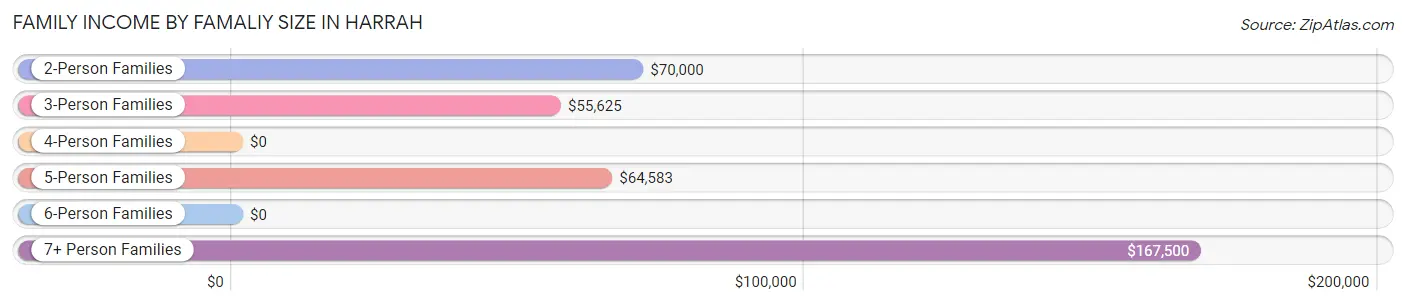
Family Income by Famaliy Size in Harrah
7+ person families (6 | 3.7%) account for the highest median family income in Harrah with $167,500 per family, while 2-person families (68 | 42.2%) have the highest median income of $35,000 per family member.
| Income Bracket | # Families | Median Income |
| 2-Person Families | 68 (42.2%) | $70,000 |
| 3-Person Families | 41 (25.5%) | $55,625 |
| 4-Person Families | 22 (13.7%) | $0 |
| 5-Person Families | 21 (13.0%) | $64,583 |
| 6-Person Families | 3 (1.9%) | $0 |
| 7+ Person Families | 6 (3.7%) | $167,500 |
| Total | 161 (100.0%) | $65,938 |
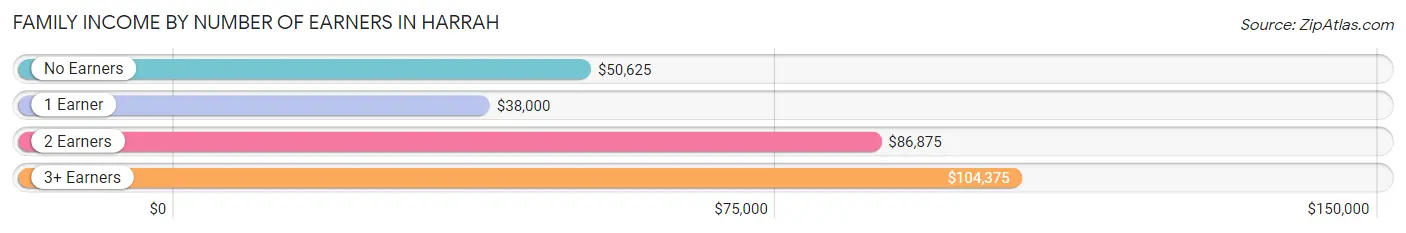
Family Income by Number of Earners in Harrah
The median family income in Harrah is $65,938, with families comprising 3+ earners (39) having the highest median family income of $104,375, while families with 1 earner (48) have the lowest median family income of $38,000, accounting for 24.2% and 29.8% of families, respectively.
| Number of Earners | # Families | Median Income |
| No Earners | 19 (11.8%) | $50,625 |
| 1 Earner | 48 (29.8%) | $38,000 |
| 2 Earners | 55 (34.2%) | $86,875 |
| 3+ Earners | 39 (24.2%) | $104,375 |
| Total | 161 (100.0%) | $65,938 |
Household Income in Harrah
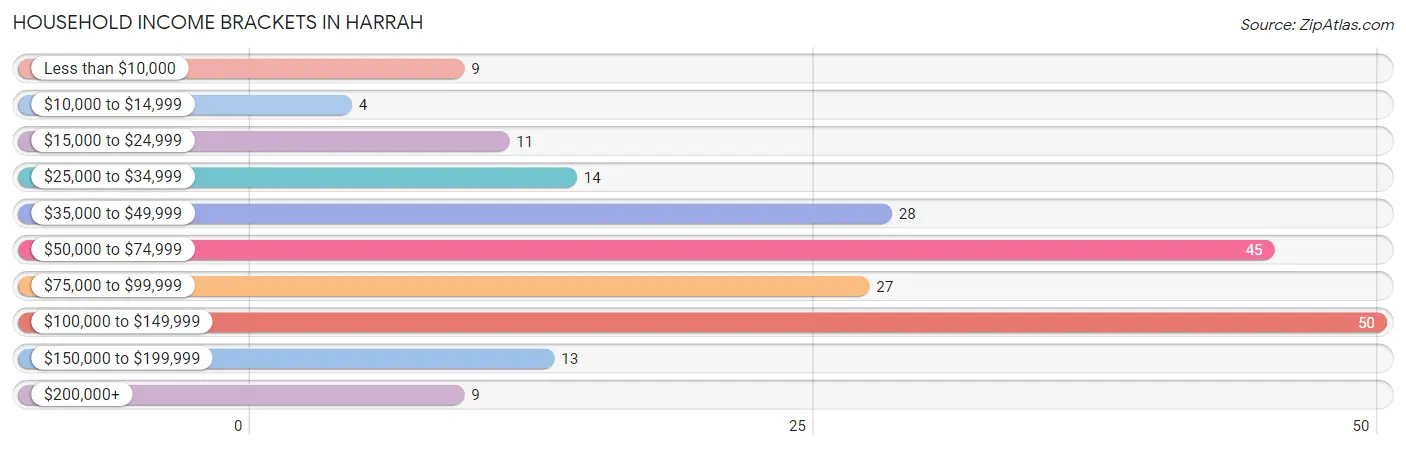
Household Income Brackets in Harrah
With 50 households falling in the category, the $100,000 to $149,999 income range is the most frequent in Harrah, accounting for 23.8% of all households. In contrast, only 4 households (1.9%) fall into the $10,000 to $14,999 income bracket, making it the least populous group.
| Income Bracket | # Households | % Households |
| Less than $10,000 | 9 | 4.3% |
| $10,000 to $14,999 | 4 | 1.9% |
| $15,000 to $24,999 | 11 | 5.2% |
| $25,000 to $34,999 | 14 | 6.7% |
| $35,000 to $49,999 | 28 | 13.3% |
| $50,000 to $74,999 | 45 | 21.4% |
| $75,000 to $99,999 | 27 | 12.9% |
| $100,000 to $149,999 | 50 | 23.8% |
| $150,000 to $199,999 | 13 | 6.2% |
| $200,000+ | 9 | 4.3% |
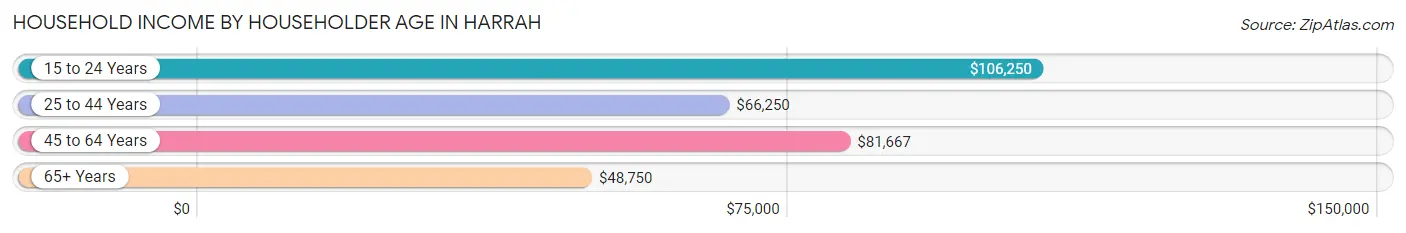
Household Income by Householder Age in Harrah
The median household income in Harrah is $68,333, with the highest median household income of $106,250 found in the 15 to 24 years age bracket for the primary householder. A total of 8 households (3.8%) fall into this category. Meanwhile, the 65+ years age bracket for the primary householder has the lowest median household income of $48,750, with 52 households (24.8%) in this group.
| Income Bracket | # Households | Median Income |
| 15 to 24 Years | 8 (3.8%) | $106,250 |
| 25 to 44 Years | 62 (29.5%) | $66,250 |
| 45 to 64 Years | 88 (41.9%) | $81,667 |
| 65+ Years | 52 (24.8%) | $48,750 |
| Total | 210 (100.0%) | $68,333 |
Poverty in Harrah
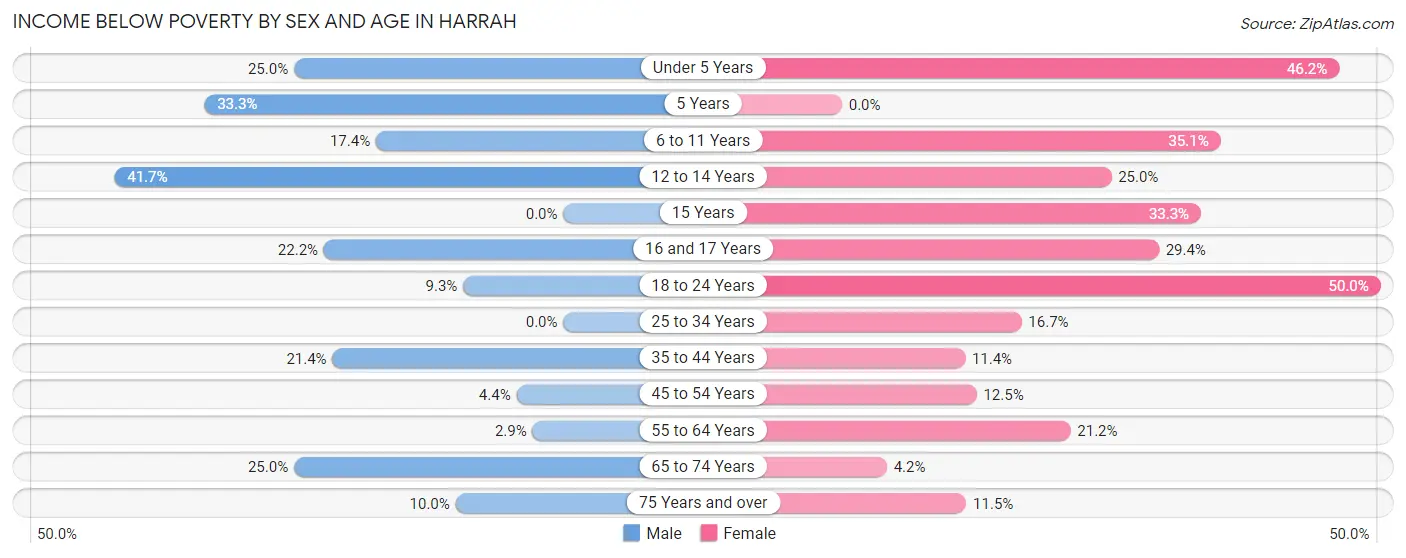
Income Below Poverty by Sex and Age in Harrah
With 12.2% poverty level for males and 22.2% for females among the residents of Harrah, 12 to 14 year old males and 18 to 24 year old females are the most vulnerable to poverty, with 5 males (41.7%) and 15 females (50.0%) in their respective age groups living below the poverty level.
| Age Bracket | Male | Female |
| Under 5 Years | 2 (25.0%) | 6 (46.2%) |
| 5 Years | 1 (33.3%) | 0 (0.0%) |
| 6 to 11 Years | 4 (17.4%) | 13 (35.1%) |
| 12 to 14 Years | 5 (41.7%) | 5 (25.0%) |
| 15 Years | 0 (0.0%) | 2 (33.3%) |
| 16 and 17 Years | 4 (22.2%) | 5 (29.4%) |
| 18 to 24 Years | 4 (9.3%) | 15 (50.0%) |
| 25 to 34 Years | 0 (0.0%) | 7 (16.7%) |
| 35 to 44 Years | 9 (21.4%) | 4 (11.4%) |
| 45 to 54 Years | 2 (4.3%) | 6 (12.5%) |
| 55 to 64 Years | 1 (2.9%) | 7 (21.2%) |
| 65 to 74 Years | 3 (25.0%) | 1 (4.2%) |
| 75 Years and over | 2 (10.0%) | 3 (11.5%) |
| Total | 37 (12.2%) | 74 (22.2%) |
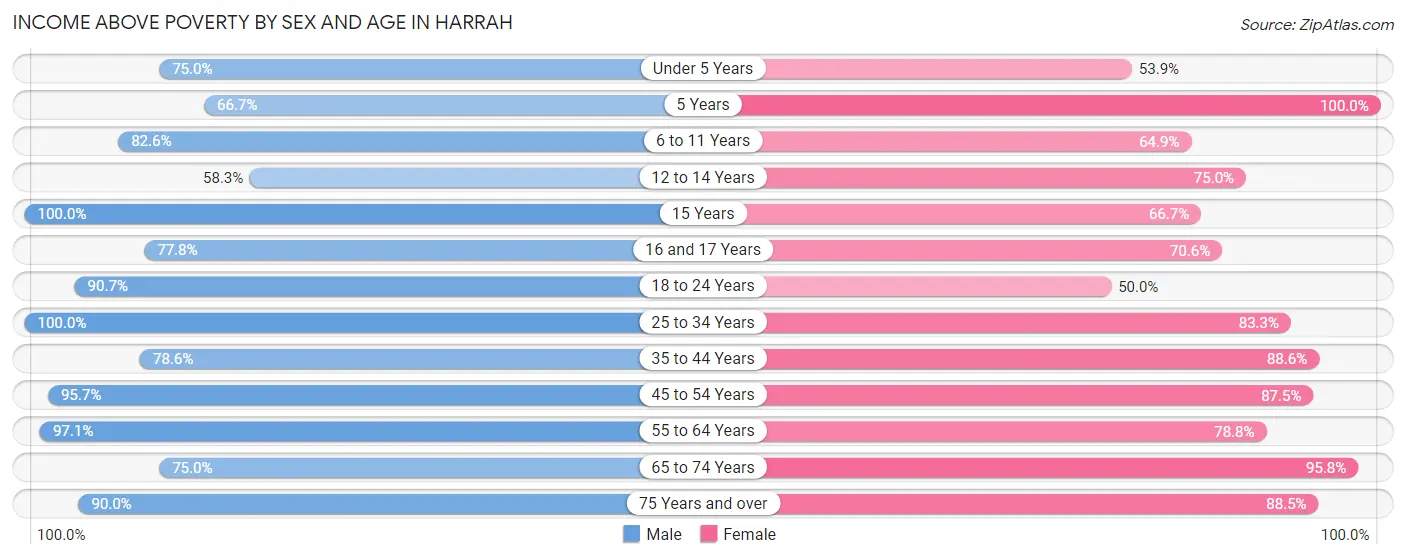
Income Above Poverty by Sex and Age in Harrah
According to the poverty statistics in Harrah, males aged 15 years and females aged 5 years are the age groups that are most secure financially, with 100.0% of males and 100.0% of females in these age groups living above the poverty line.
| Age Bracket | Male | Female |
| Under 5 Years | 6 (75.0%) | 7 (53.8%) |
| 5 Years | 2 (66.7%) | 2 (100.0%) |
| 6 to 11 Years | 19 (82.6%) | 24 (64.9%) |
| 12 to 14 Years | 7 (58.3%) | 15 (75.0%) |
| 15 Years | 2 (100.0%) | 4 (66.7%) |
| 16 and 17 Years | 14 (77.8%) | 12 (70.6%) |
| 18 to 24 Years | 39 (90.7%) | 15 (50.0%) |
| 25 to 34 Years | 40 (100.0%) | 35 (83.3%) |
| 35 to 44 Years | 33 (78.6%) | 31 (88.6%) |
| 45 to 54 Years | 44 (95.7%) | 42 (87.5%) |
| 55 to 64 Years | 34 (97.1%) | 26 (78.8%) |
| 65 to 74 Years | 9 (75.0%) | 23 (95.8%) |
| 75 Years and over | 18 (90.0%) | 23 (88.5%) |
| Total | 267 (87.8%) | 259 (77.8%) |
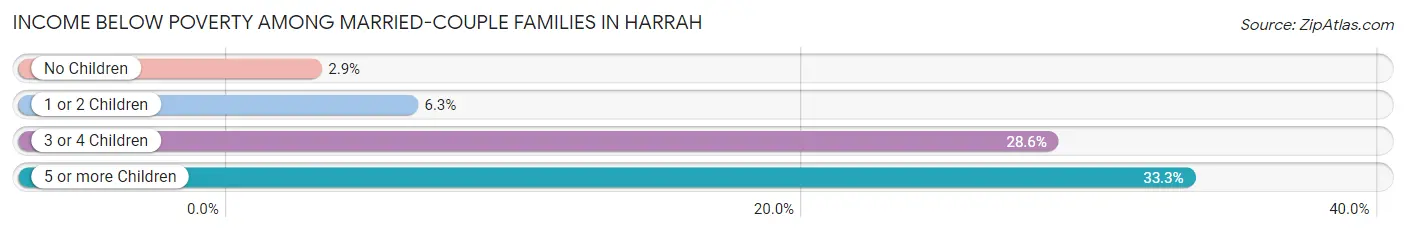
Income Below Poverty Among Married-Couple Families in Harrah
The poverty statistics for married-couple families in Harrah show that 6.3% or 7 of the total 111 families live below the poverty line. Families with 5 or more children have the highest poverty rate of 33.3%, comprising of 1 families. On the other hand, families with no children have the lowest poverty rate of 2.9%, which includes 2 families.
| Children | Above Poverty | Below Poverty |
| No Children | 67 (97.1%) | 2 (2.9%) |
| 1 or 2 Children | 30 (93.8%) | 2 (6.2%) |
| 3 or 4 Children | 5 (71.4%) | 2 (28.6%) |
| 5 or more Children | 2 (66.7%) | 1 (33.3%) |
| Total | 104 (93.7%) | 7 (6.3%) |
Income Below Poverty Among Single-Parent Households in Harrah
According to the poverty data in Harrah, 8.7% or 2 single-father households and 44.4% or 12 single-mother households are living below the poverty line. Among single-father households, those with 1 or 2 children have the highest poverty rate, with 2 households (14.3%) experiencing poverty. Likewise, among single-mother households, those with 3 or 4 children have the highest poverty rate, with 2 households (66.7%) falling below the poverty line.
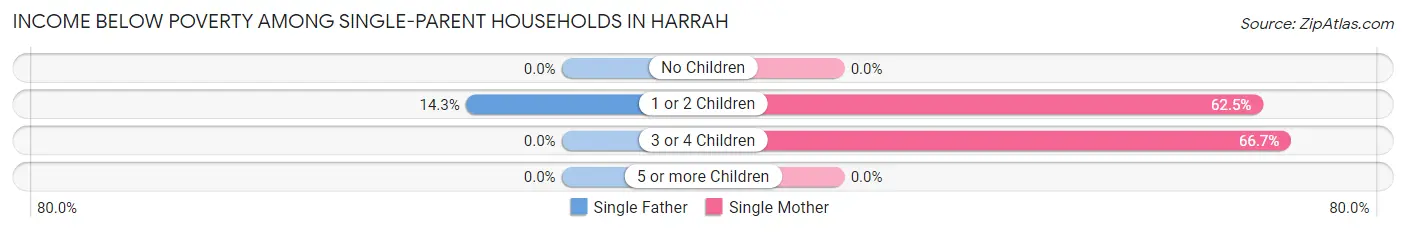
| Children | Single Father | Single Mother |
| No Children | 0 (0.0%) | 0 (0.0%) |
| 1 or 2 Children | 2 (14.3%) | 10 (62.5%) |
| 3 or 4 Children | 0 (0.0%) | 2 (66.7%) |
| 5 or more Children | 0 (0.0%) | 0 (0.0%) |
| Total | 2 (8.7%) | 12 (44.4%) |
Income Below Poverty Among Married-Couple vs Single-Parent Households in Harrah
The poverty data for Harrah shows that 7 of the married-couple family households (6.3%) and 14 of the single-parent households (28.0%) are living below the poverty level. Within the married-couple family households, those with 5 or more children have the highest poverty rate, with 1 households (33.3%) falling below the poverty line. Among the single-parent households, those with 3 or 4 children have the highest poverty rate, with 2 household (66.7%) living below poverty.
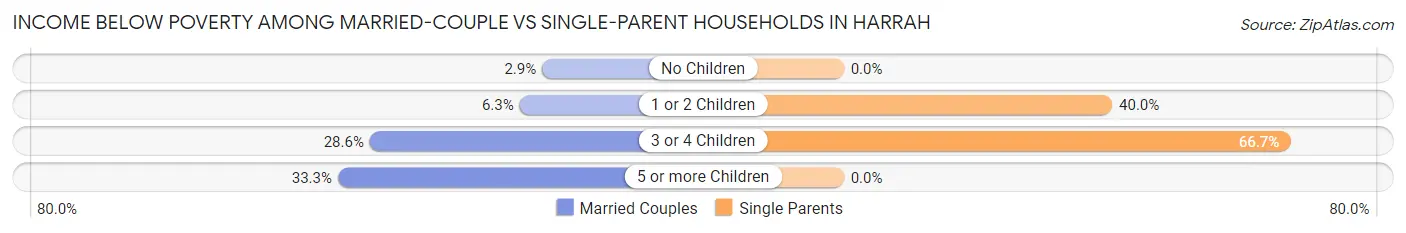
| Children | Married-Couple Families | Single-Parent Households |
| No Children | 2 (2.9%) | 0 (0.0%) |
| 1 or 2 Children | 2 (6.2%) | 12 (40.0%) |
| 3 or 4 Children | 2 (28.6%) | 2 (66.7%) |
| 5 or more Children | 1 (33.3%) | 0 (0.0%) |
| Total | 7 (6.3%) | 14 (28.0%) |
Race in Harrah
The most populous races in Harrah are Hispanic or Latino (427 | 66.7%), White / Caucasian (261 | 40.8%), and Some other Race (143 | 22.3%).
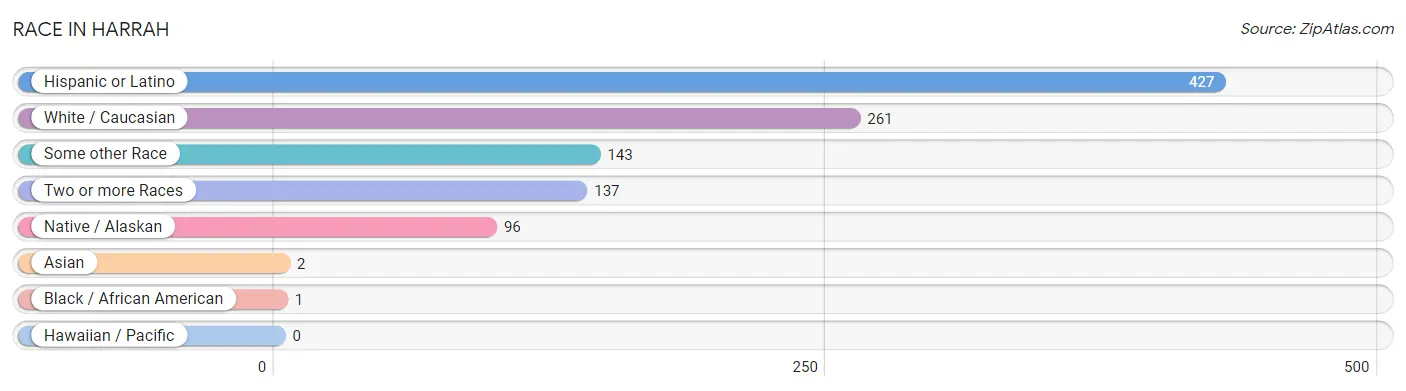
| Race | # Population | % Population |
| Asian | 2 | 0.3% |
| Black / African American | 1 | 0.2% |
| Hawaiian / Pacific | 0 | 0.0% |
| Hispanic or Latino | 427 | 66.7% |
| Native / Alaskan | 96 | 15.0% |
| White / Caucasian | 261 | 40.8% |
| Two or more Races | 137 | 21.4% |
| Some other Race | 143 | 22.3% |
| Total | 640 | 100.0% |
Ancestry in Harrah
The most populous ancestries reported in Harrah are Mexican (401 | 62.7%), Yakama (76 | 11.9%), German (28 | 4.4%), Irish (20 | 3.1%), and English (19 | 3.0%), together accounting for 85.0% of all Harrah residents.
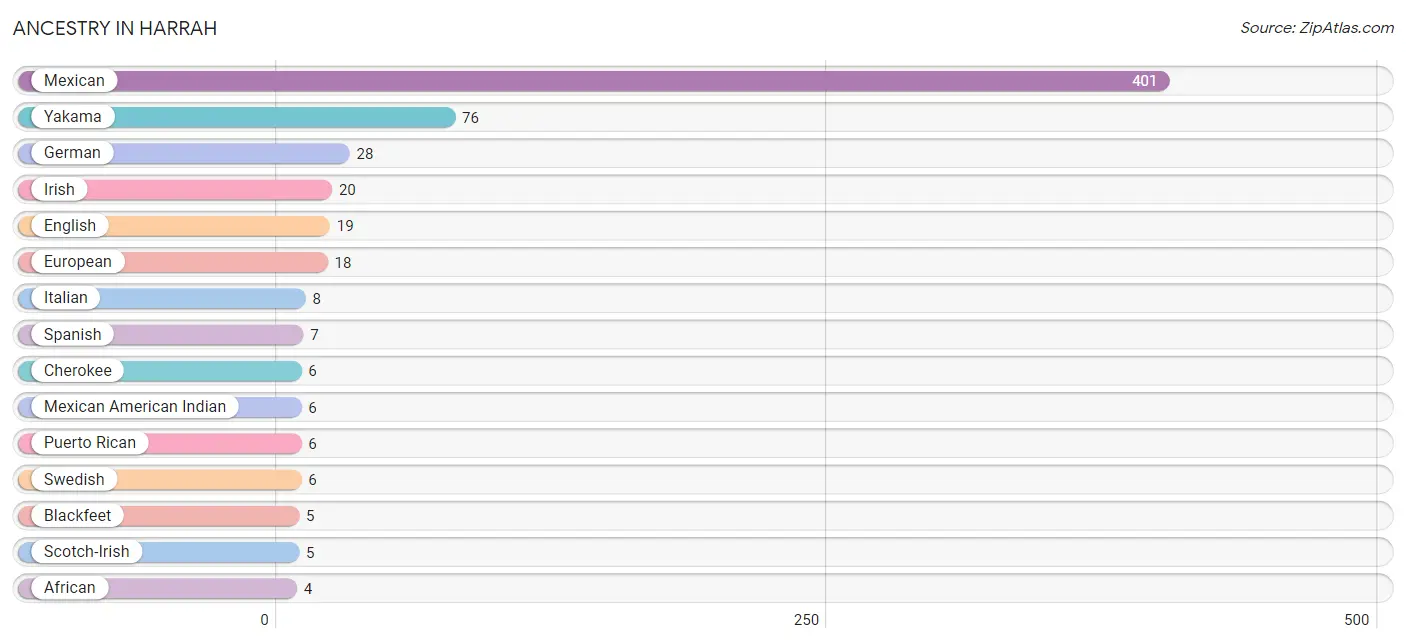
| Ancestry | # Population | % Population |
| African | 4 | 0.6% |
| American | 1 | 0.2% |
| Blackfeet | 5 | 0.8% |
| Central American | 4 | 0.6% |
| Cherokee | 6 | 0.9% |
| Chippewa | 4 | 0.6% |
| Colville | 4 | 0.6% |
| Czech | 1 | 0.2% |
| Danish | 1 | 0.2% |
| Eastern European | 1 | 0.2% |
| English | 19 | 3.0% |
| European | 18 | 2.8% |
| French | 4 | 0.6% |
| French Canadian | 4 | 0.6% |
| German | 28 | 4.4% |
| Honduran | 2 | 0.3% |
| Inupiat | 1 | 0.2% |
| Irish | 20 | 3.1% |
| Italian | 8 | 1.3% |
| Korean | 2 | 0.3% |
| Mexican | 401 | 62.7% |
| Mexican American Indian | 6 | 0.9% |
| Norwegian | 2 | 0.3% |
| Polish | 1 | 0.2% |
| Potawatomi | 2 | 0.3% |
| Puerto Rican | 6 | 0.9% |
| Puget Sound Salish | 4 | 0.6% |
| Salvadoran | 2 | 0.3% |
| Scotch-Irish | 5 | 0.8% |
| Scottish | 3 | 0.5% |
| Spaniard | 3 | 0.5% |
| Spanish | 7 | 1.1% |
| Subsaharan African | 4 | 0.6% |
| Swedish | 6 | 0.9% |
| Welsh | 4 | 0.6% |
| Yakama | 76 | 11.9% |
| Yuman | 2 | 0.3% | View All 37 Rows |
Immigrants in Harrah
The most numerous immigrant groups reported in Harrah came from Central America (171 | 26.7%), Latin America (171 | 26.7%), Mexico (167 | 26.1%), El Salvador (2 | 0.3%), and Honduras (2 | 0.3%), together accounting for 80.1% of all Harrah residents.
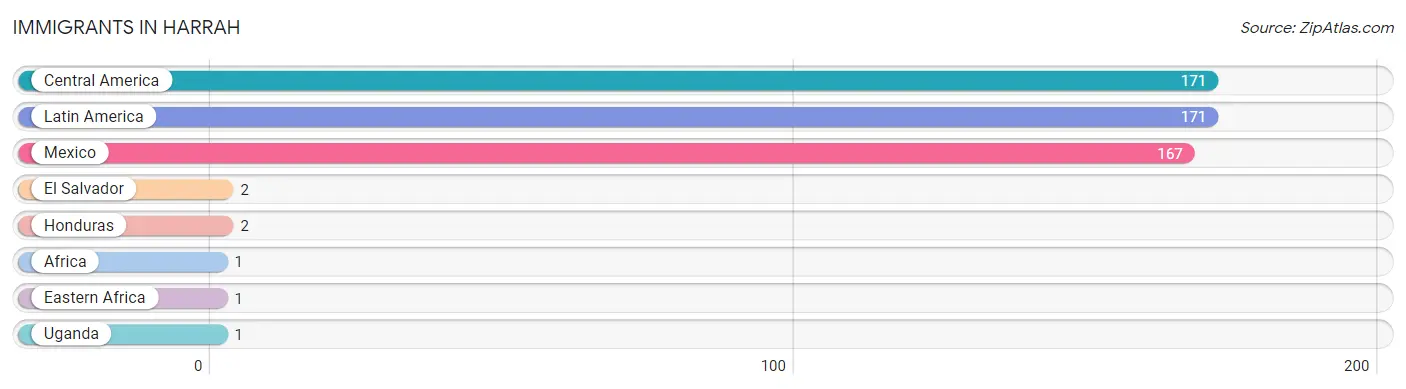
| Immigration Origin | # Population | % Population |
| Africa | 1 | 0.2% |
| Central America | 171 | 26.7% |
| Eastern Africa | 1 | 0.2% |
| El Salvador | 2 | 0.3% |
| Honduras | 2 | 0.3% |
| Latin America | 171 | 26.7% |
| Mexico | 167 | 26.1% |
| Uganda | 1 | 0.2% | View All 8 Rows |
Sex and Age in Harrah
Sex and Age in Harrah
The most populous age groups in Harrah are 20 to 24 Years (34 | 11.1%) for men and 10 to 14 Years (35 | 10.5%) for women.
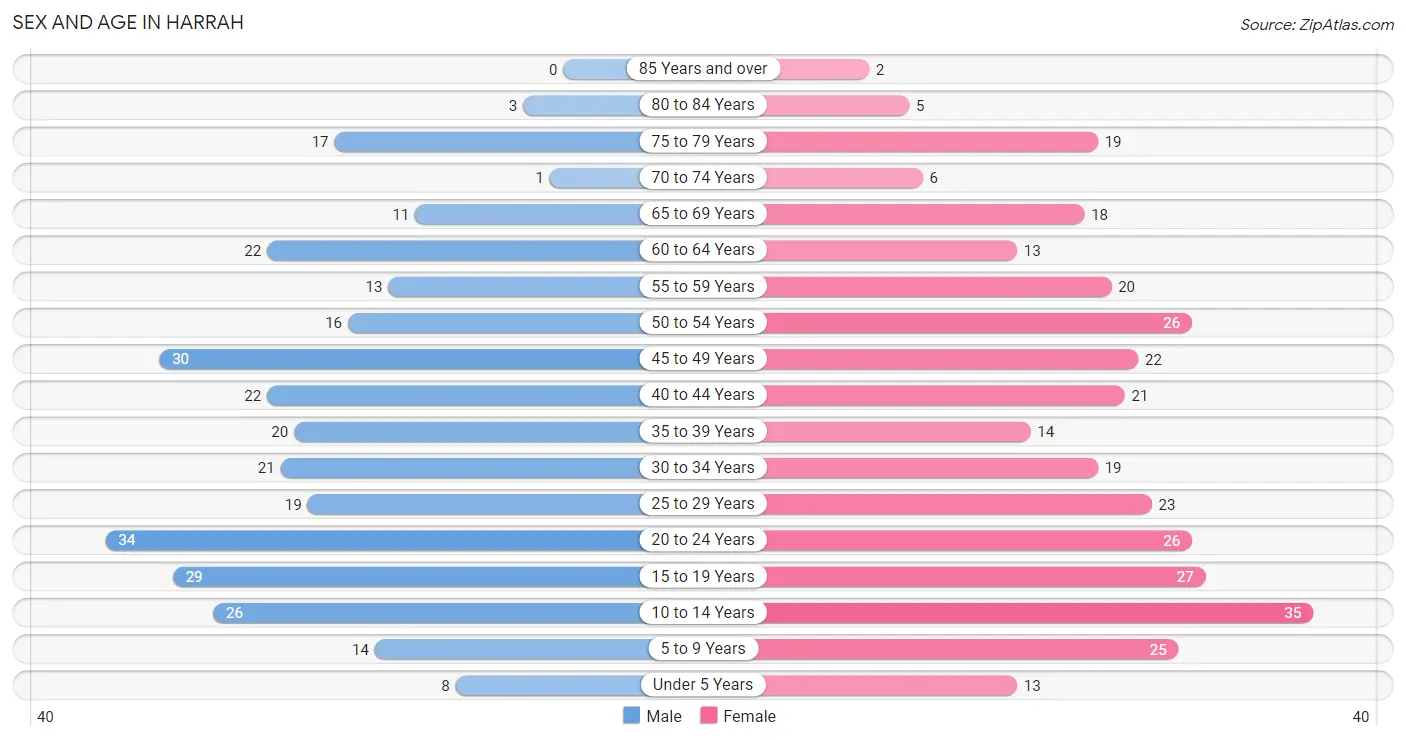
| Age Bracket | Male | Female |
| Under 5 Years | 8 (2.6%) | 13 (3.9%) |
| 5 to 9 Years | 14 (4.6%) | 25 (7.5%) |
| 10 to 14 Years | 26 (8.5%) | 35 (10.5%) |
| 15 to 19 Years | 29 (9.5%) | 27 (8.1%) |
| 20 to 24 Years | 34 (11.1%) | 26 (7.8%) |
| 25 to 29 Years | 19 (6.2%) | 23 (6.9%) |
| 30 to 34 Years | 21 (6.9%) | 19 (5.7%) |
| 35 to 39 Years | 20 (6.5%) | 14 (4.2%) |
| 40 to 44 Years | 22 (7.2%) | 21 (6.3%) |
| 45 to 49 Years | 30 (9.8%) | 22 (6.6%) |
| 50 to 54 Years | 16 (5.2%) | 26 (7.8%) |
| 55 to 59 Years | 13 (4.3%) | 20 (6.0%) |
| 60 to 64 Years | 22 (7.2%) | 13 (3.9%) |
| 65 to 69 Years | 11 (3.6%) | 18 (5.4%) |
| 70 to 74 Years | 1 (0.3%) | 6 (1.8%) |
| 75 to 79 Years | 17 (5.6%) | 19 (5.7%) |
| 80 to 84 Years | 3 (1.0%) | 5 (1.5%) |
| 85 Years and over | 0 (0.0%) | 2 (0.6%) |
| Total | 306 (100.0%) | 334 (100.0%) |
Families and Households in Harrah
Median Family Size in Harrah
The median family size in Harrah is 3.35 persons per family, with married-couple families (111 | 68.9%) accounting for the largest median family size of 3.52 persons per family. On the other hand, single male/father families (23 | 14.3%) represent the smallest median family size with 2.52 persons per family.
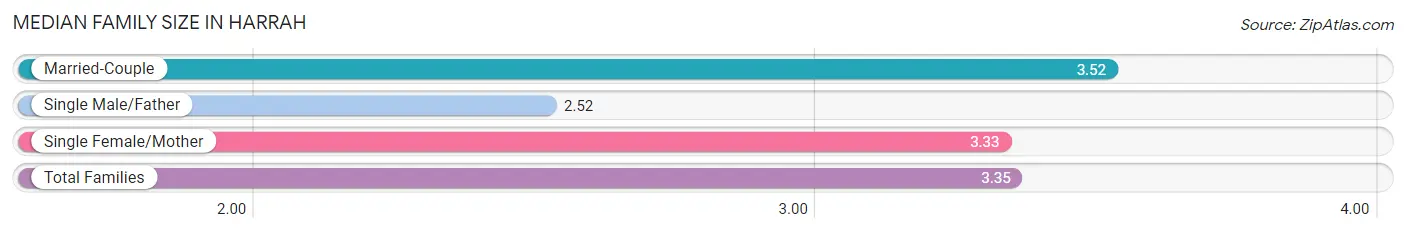
| Family Type | # Families | Family Size |
| Married-Couple | 111 (68.9%) | 3.52 |
| Single Male/Father | 23 (14.3%) | 2.52 |
| Single Female/Mother | 27 (16.8%) | 3.33 |
| Total Families | 161 (100.0%) | 3.35 |
Median Household Size in Harrah
The median household size in Harrah is 3.05 persons per household, with single female/mother households (27 | 12.9%) accounting for the largest median household size of 3.67 persons per household. non-family households (49 | 23.3%) represent the smallest median household size with 1.27 persons per household.
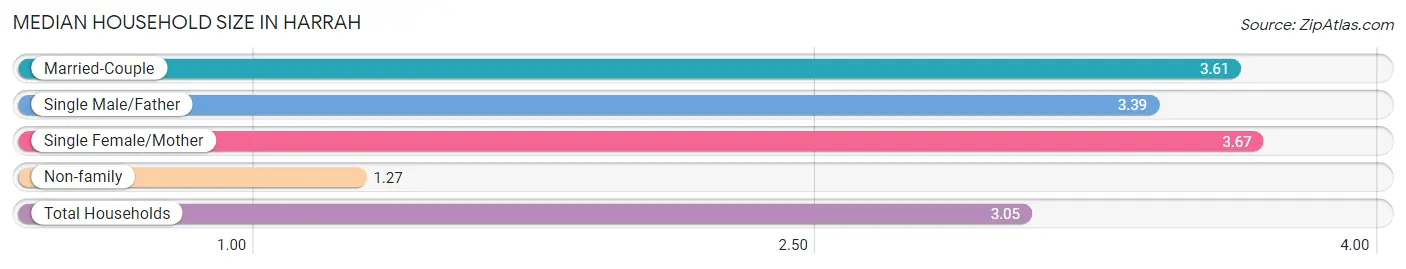
| Household Type | # Households | Household Size |
| Married-Couple | 111 (52.9%) | 3.61 |
| Single Male/Father | 23 (11.0%) | 3.39 |
| Single Female/Mother | 27 (12.9%) | 3.67 |
| Non-family | 49 (23.3%) | 1.27 |
| Total Households | 210 (100.0%) | 3.05 |
Household Size by Marriage Status in Harrah
Out of a total of 210 households in Harrah, 161 (76.7%) are family households, while 49 (23.3%) are nonfamily households. The most numerous type of family households are 2-person households, comprising 56, and the most common type of nonfamily households are 1-person households, comprising 37.
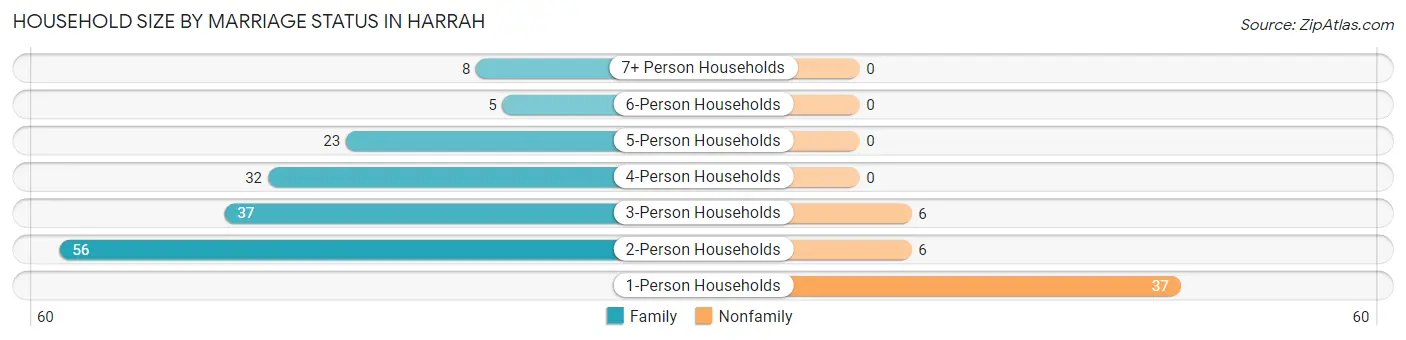
| Household Size | Family Households | Nonfamily Households |
| 1-Person Households | - | 37 (17.6%) |
| 2-Person Households | 56 (26.7%) | 6 (2.9%) |
| 3-Person Households | 37 (17.6%) | 6 (2.9%) |
| 4-Person Households | 32 (15.2%) | 0 (0.0%) |
| 5-Person Households | 23 (11.0%) | 0 (0.0%) |
| 6-Person Households | 5 (2.4%) | 0 (0.0%) |
| 7+ Person Households | 8 (3.8%) | 0 (0.0%) |
| Total | 161 (76.7%) | 49 (23.3%) |
Female Fertility in Harrah
Fertility by Age in Harrah
Average fertility rate in Harrah is 99.0 births per 1,000 women. Women in the age bracket of 20 to 34 years have the highest fertility rate with 162.0 births per 1,000 women. Women in the age bracket of 20 to 34 years acount for 73.3% of all women with births.
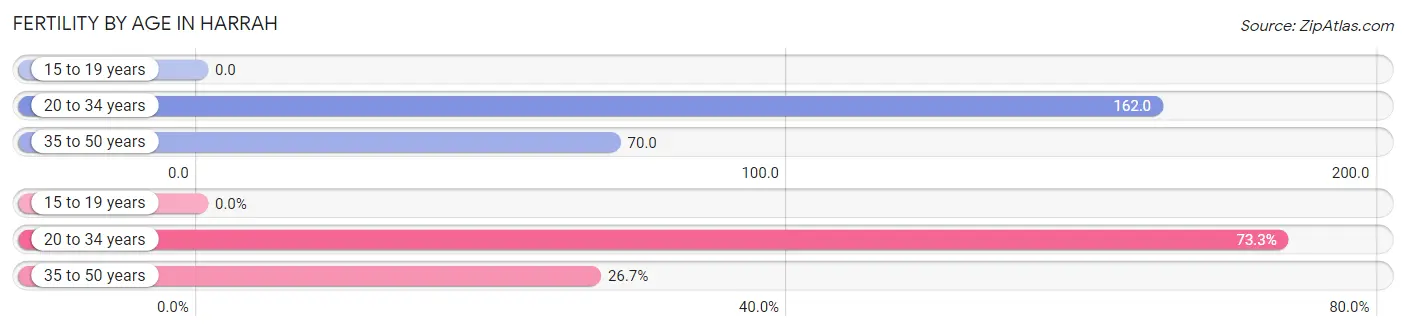
| Age Bracket | Women with Births | Births / 1,000 Women |
| 15 to 19 years | 0 (0.0%) | 0.0 |
| 20 to 34 years | 11 (73.3%) | 162.0 |
| 35 to 50 years | 4 (26.7%) | 70.0 |
| Total | 15 (100.0%) | 99.0 |
Fertility by Age by Marriage Status in Harrah
26.7% of women with births (15) in Harrah are married. The highest percentage of unmarried women with births falls into 20 to 34 years age bracket with 81.8% of them unmarried at the time of birth, while the lowest percentage of unmarried women with births belong to 35 to 50 years age bracket with 50.0% of them unmarried.
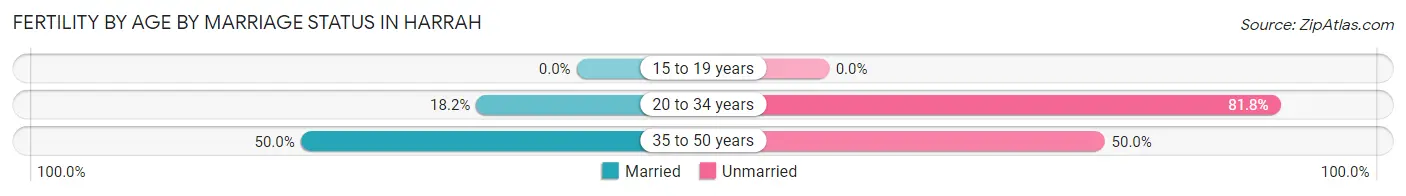
| Age Bracket | Married | Unmarried |
| 15 to 19 years | 0 (0.0%) | 0 (0.0%) |
| 20 to 34 years | 2 (18.2%) | 9 (81.8%) |
| 35 to 50 years | 2 (50.0%) | 2 (50.0%) |
| Total | 4 (26.7%) | 11 (73.3%) |
Fertility by Education in Harrah
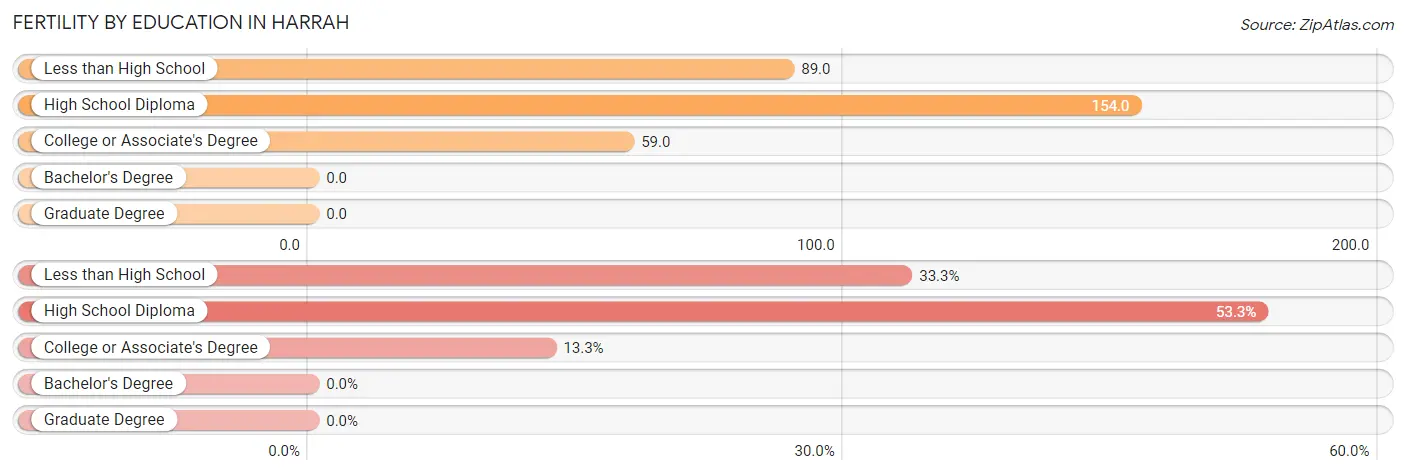
| Educational Attainment | Women with Births | Births / 1,000 Women |
| Less than High School | 5 (33.3%) | 89.0 |
| High School Diploma | 8 (53.3%) | 154.0 |
| College or Associate's Degree | 2 (13.3%) | 59.0 |
| Bachelor's Degree | 0 (0.0%) | 0.0 |
| Graduate Degree | 0 (0.0%) | 0.0 |
| Total | 15 (100.0%) | 99.0 |
Fertility by Education by Marriage Status in Harrah
73.3% of women with births in Harrah are unmarried. Women with the educational attainment of less than high school are most likely to be married with 40.0% of them married at childbirth, while women with the educational attainment of college or associate's degree are least likely to be married with 100.0% of them unmarried at childbirth.
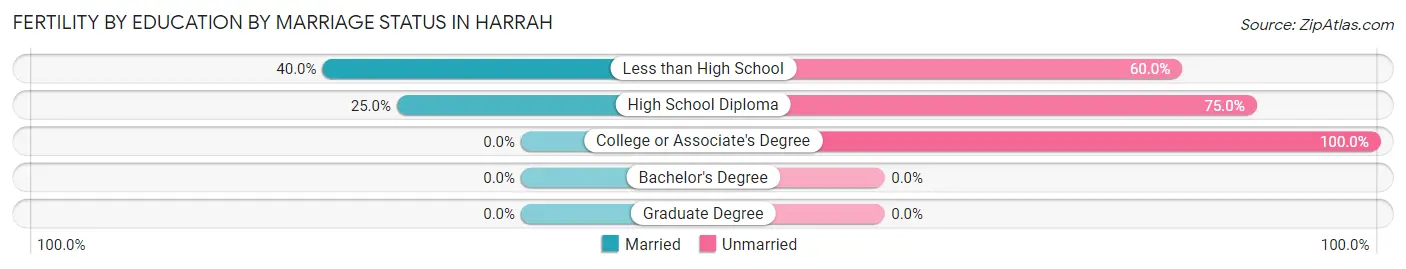
| Educational Attainment | Married | Unmarried |
| Less than High School | 2 (40.0%) | 3 (60.0%) |
| High School Diploma | 2 (25.0%) | 6 (75.0%) |
| College or Associate's Degree | 0 (0.0%) | 2 (100.0%) |
| Bachelor's Degree | 0 (0.0%) | 0 (0.0%) |
| Graduate Degree | 0 (0.0%) | 0 (0.0%) |
| Total | 4 (26.7%) | 11 (73.3%) |
Employment Characteristics in Harrah
Employment by Class of Employer in Harrah
Among the 299 employed individuals in Harrah, private company employees (183 | 61.2%), local government employees (29 | 9.7%), and state government employees (28 | 9.4%) make up the most common classes of employment.
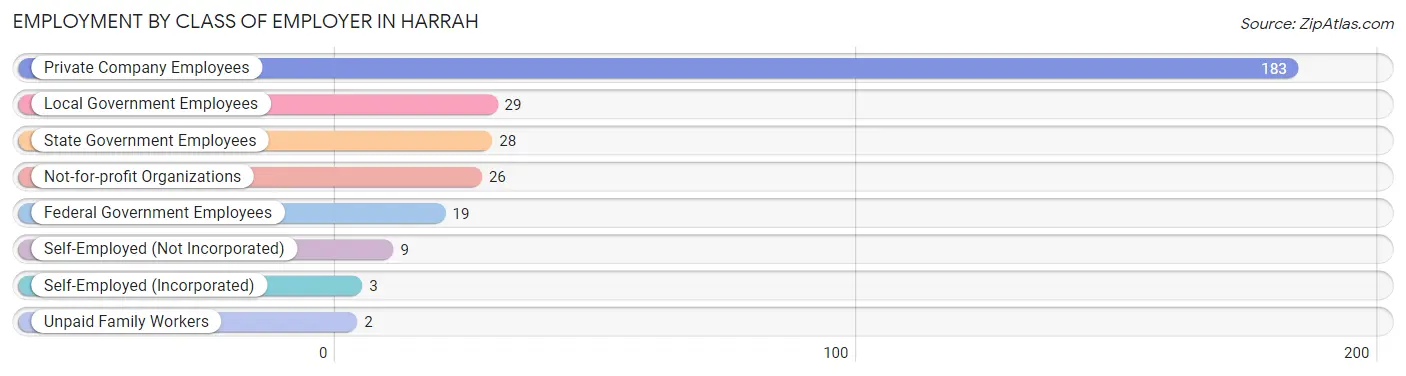
| Employer Class | # Employees | % Employees |
| Private Company Employees | 183 | 61.2% |
| Self-Employed (Incorporated) | 3 | 1.0% |
| Self-Employed (Not Incorporated) | 9 | 3.0% |
| Not-for-profit Organizations | 26 | 8.7% |
| Local Government Employees | 29 | 9.7% |
| State Government Employees | 28 | 9.4% |
| Federal Government Employees | 19 | 6.4% |
| Unpaid Family Workers | 2 | 0.7% |
| Total | 299 | 100.0% |
Employment Status by Age in Harrah
According to the labor force statistics for Harrah, out of the total population over 16 years of age (511), 67.7% or 346 individuals are in the labor force, with 11.6% or 40 of them unemployed. The age group with the highest labor force participation rate is 30 to 34 years, with 95.0% or 38 individuals in the labor force. Within the labor force, the 55 to 59 years age range has the highest percentage of unemployed individuals, with 38.5% or 10 of them being unemployed.
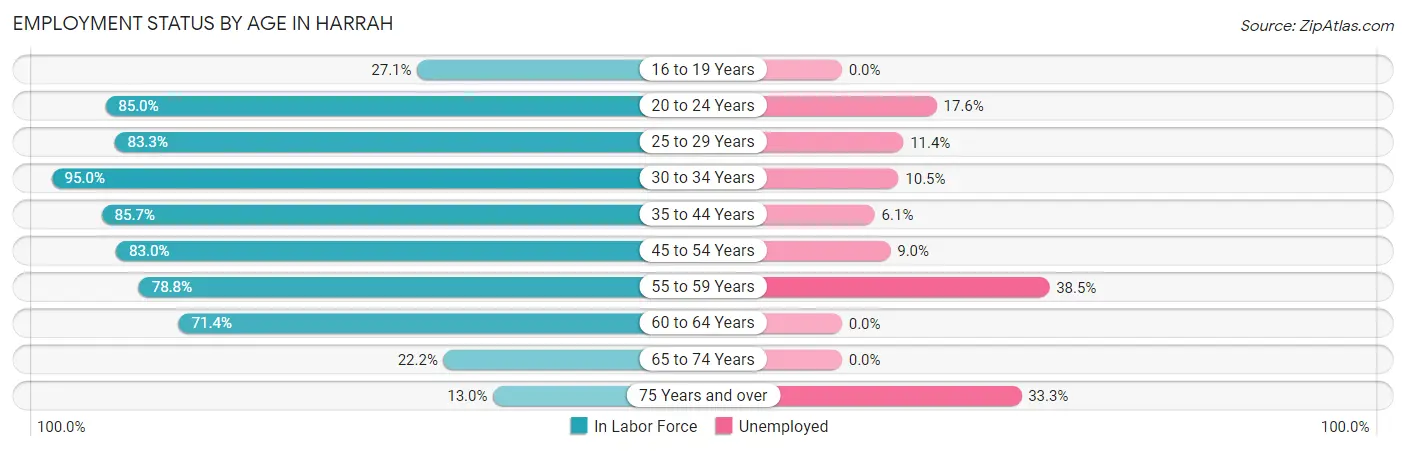
| Age Bracket | In Labor Force | Unemployed |
| 16 to 19 Years | 13 (27.1%) | 0 (0.0%) |
| 20 to 24 Years | 51 (85.0%) | 9 (17.6%) |
| 25 to 29 Years | 35 (83.3%) | 4 (11.4%) |
| 30 to 34 Years | 38 (95.0%) | 4 (10.5%) |
| 35 to 44 Years | 66 (85.7%) | 4 (6.1%) |
| 45 to 54 Years | 78 (83.0%) | 7 (9.0%) |
| 55 to 59 Years | 26 (78.8%) | 10 (38.5%) |
| 60 to 64 Years | 25 (71.4%) | 0 (0.0%) |
| 65 to 74 Years | 8 (22.2%) | 0 (0.0%) |
| 75 Years and over | 6 (13.0%) | 2 (33.3%) |
| Total | 346 (67.7%) | 40 (11.6%) |
Employment Status by Educational Attainment in Harrah
According to labor force statistics for Harrah, 83.5% of individuals (268) out of the total population between 25 and 64 years of age (321) are in the labor force, with 10.8% or 29 of them being unemployed. The group with the highest labor force participation rate are those with the educational attainment of bachelor's degree or higher, with 90.2% or 37 individuals in the labor force. Within the labor force, individuals with less than high school education have the highest percentage of unemployment, with 25.3% or 19 of them being unemployed.
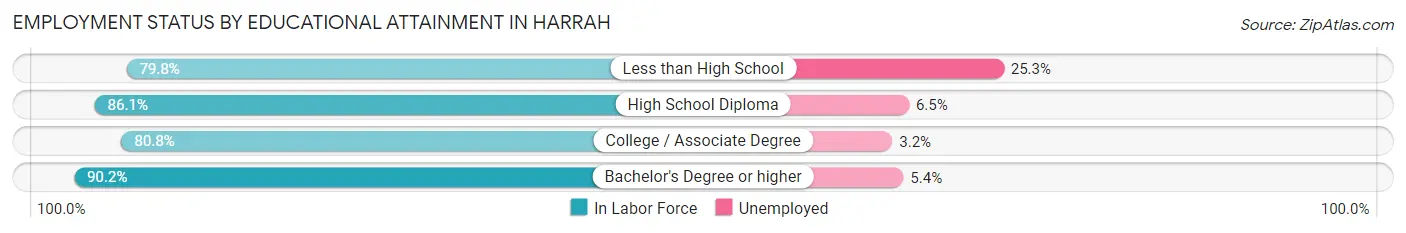
| Educational Attainment | In Labor Force | Unemployed |
| Less than High School | 75 (79.8%) | 24 (25.3%) |
| High School Diploma | 93 (86.1%) | 7 (6.5%) |
| College / Associate Degree | 63 (80.8%) | 2 (3.2%) |
| Bachelor's Degree or higher | 37 (90.2%) | 2 (5.4%) |
| Total | 268 (83.5%) | 35 (10.8%) |
Employment Occupations by Sex in Harrah
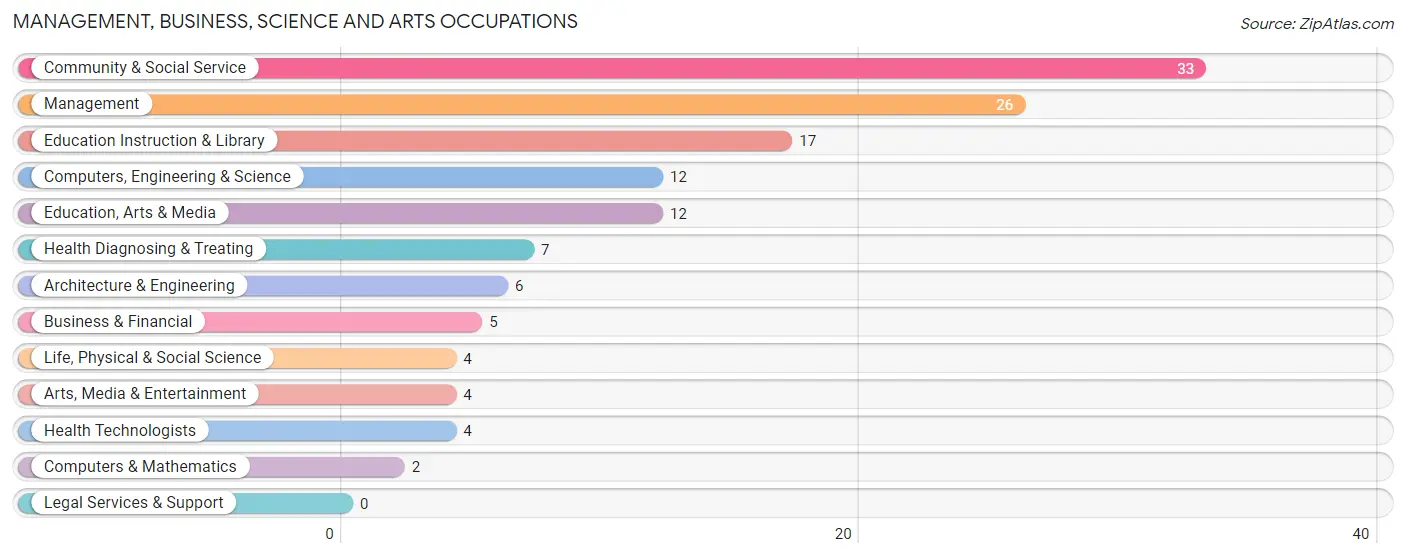
Management, Business, Science and Arts Occupations
The most common Management, Business, Science and Arts occupations in Harrah are Community & Social Service (33 | 10.8%), Management (26 | 8.5%), Education Instruction & Library (17 | 5.6%), Computers, Engineering & Science (12 | 3.9%), and Education, Arts & Media (12 | 3.9%).
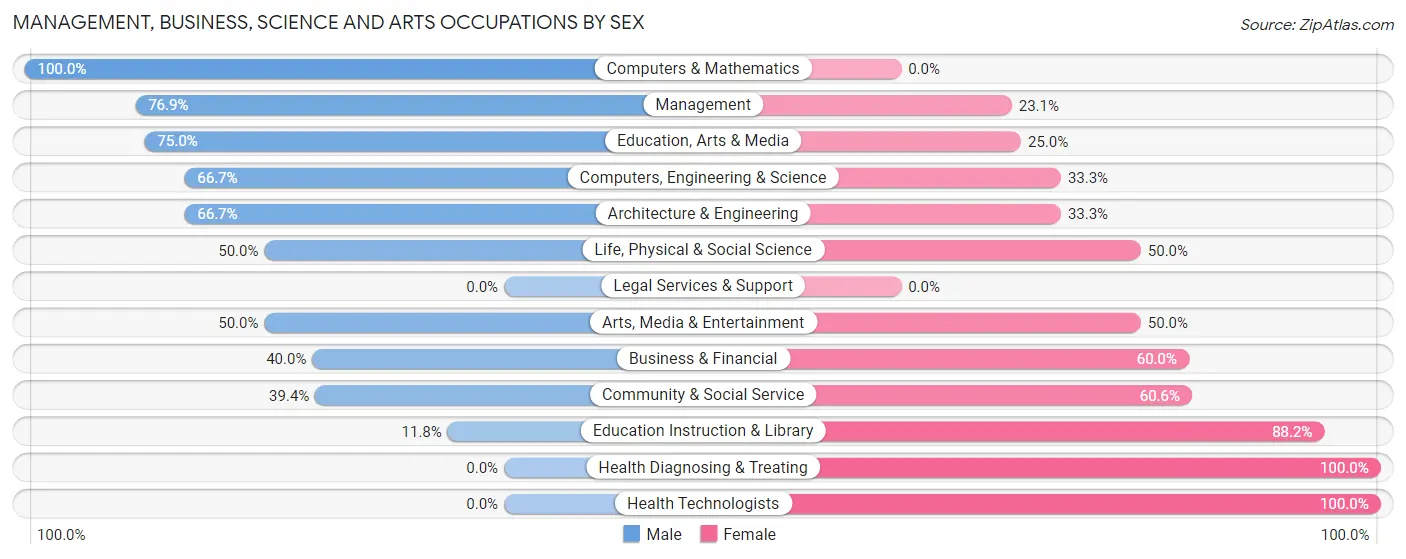
Management, Business, Science and Arts Occupations by Sex
Within the Management, Business, Science and Arts occupations in Harrah, the most male-oriented occupations are Computers & Mathematics (100.0%), Management (76.9%), and Education, Arts & Media (75.0%), while the most female-oriented occupations are Health Diagnosing & Treating (100.0%), Health Technologists (100.0%), and Education Instruction & Library (88.2%).
| Occupation | Male | Female |
| Management | 20 (76.9%) | 6 (23.1%) |
| Business & Financial | 2 (40.0%) | 3 (60.0%) |
| Computers, Engineering & Science | 8 (66.7%) | 4 (33.3%) |
| Computers & Mathematics | 2 (100.0%) | 0 (0.0%) |
| Architecture & Engineering | 4 (66.7%) | 2 (33.3%) |
| Life, Physical & Social Science | 2 (50.0%) | 2 (50.0%) |
| Community & Social Service | 13 (39.4%) | 20 (60.6%) |
| Education, Arts & Media | 9 (75.0%) | 3 (25.0%) |
| Legal Services & Support | 0 (0.0%) | 0 (0.0%) |
| Education Instruction & Library | 2 (11.8%) | 15 (88.2%) |
| Arts, Media & Entertainment | 2 (50.0%) | 2 (50.0%) |
| Health Diagnosing & Treating | 0 (0.0%) | 7 (100.0%) |
| Health Technologists | 0 (0.0%) | 4 (100.0%) |
| Total (Category) | 43 (51.8%) | 40 (48.2%) |
| Total (Overall) | 174 (56.9%) | 132 (43.1%) |
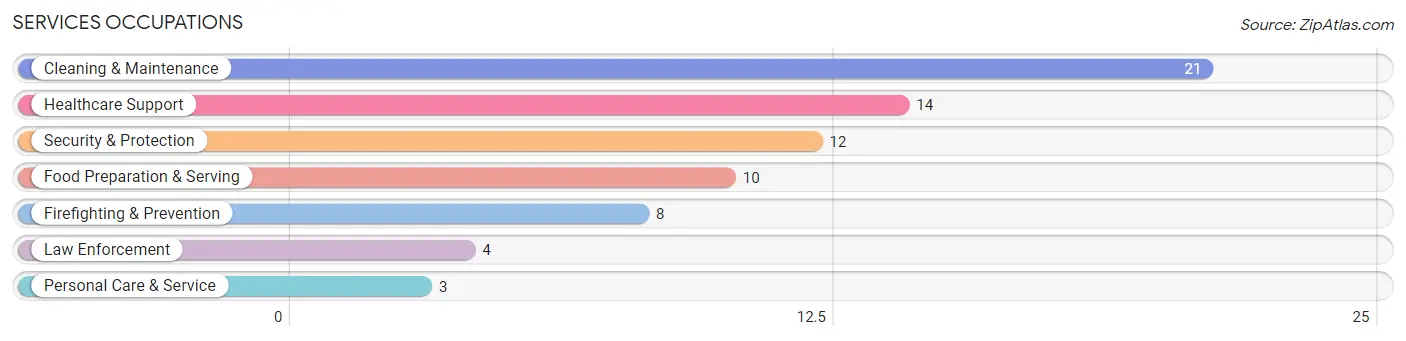
Services Occupations
The most common Services occupations in Harrah are Cleaning & Maintenance (21 | 6.9%), Healthcare Support (14 | 4.6%), Security & Protection (12 | 3.9%), Food Preparation & Serving (10 | 3.3%), and Firefighting & Prevention (8 | 2.6%).
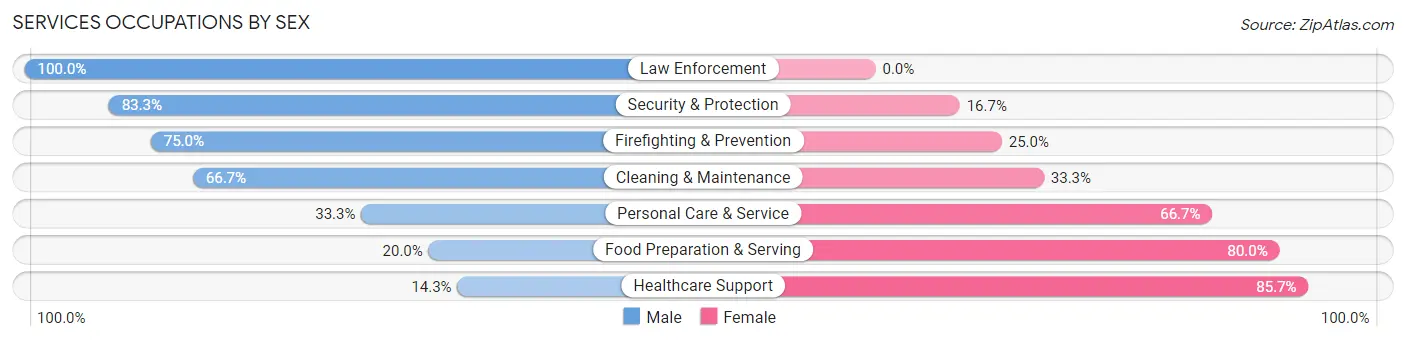
Services Occupations by Sex
Within the Services occupations in Harrah, the most male-oriented occupations are Law Enforcement (100.0%), Security & Protection (83.3%), and Firefighting & Prevention (75.0%), while the most female-oriented occupations are Healthcare Support (85.7%), Food Preparation & Serving (80.0%), and Personal Care & Service (66.7%).
| Occupation | Male | Female |
| Healthcare Support | 2 (14.3%) | 12 (85.7%) |
| Security & Protection | 10 (83.3%) | 2 (16.7%) |
| Firefighting & Prevention | 6 (75.0%) | 2 (25.0%) |
| Law Enforcement | 4 (100.0%) | 0 (0.0%) |
| Food Preparation & Serving | 2 (20.0%) | 8 (80.0%) |
| Cleaning & Maintenance | 14 (66.7%) | 7 (33.3%) |
| Personal Care & Service | 1 (33.3%) | 2 (66.7%) |
| Total (Category) | 29 (48.3%) | 31 (51.7%) |
| Total (Overall) | 174 (56.9%) | 132 (43.1%) |
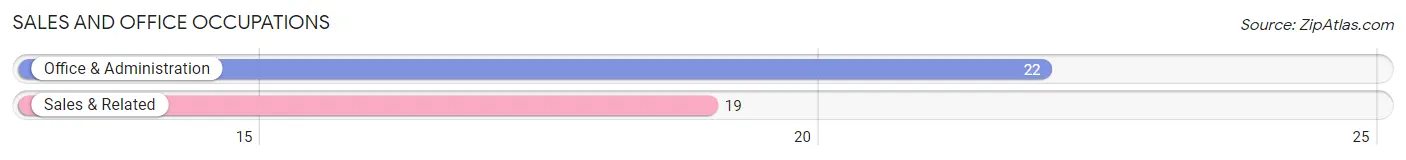
Sales and Office Occupations
The most common Sales and Office occupations in Harrah are Office & Administration (22 | 7.2%), and Sales & Related (19 | 6.2%).
Sales and Office Occupations by Sex
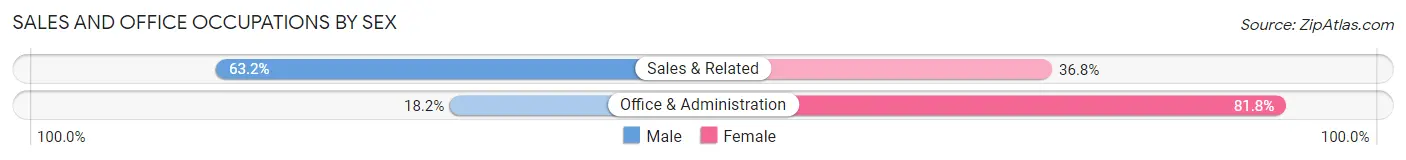
| Occupation | Male | Female |
| Sales & Related | 12 (63.2%) | 7 (36.8%) |
| Office & Administration | 4 (18.2%) | 18 (81.8%) |
| Total (Category) | 16 (39.0%) | 25 (61.0%) |
| Total (Overall) | 174 (56.9%) | 132 (43.1%) |
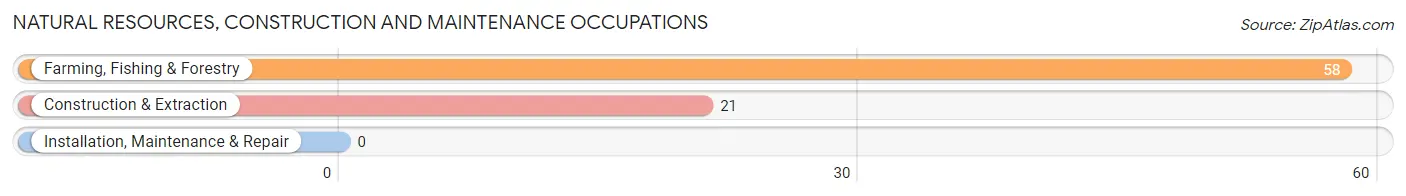
Natural Resources, Construction and Maintenance Occupations
The most common Natural Resources, Construction and Maintenance occupations in Harrah are Farming, Fishing & Forestry (58 | 19.0%), and Construction & Extraction (21 | 6.9%).
Natural Resources, Construction and Maintenance Occupations by Sex
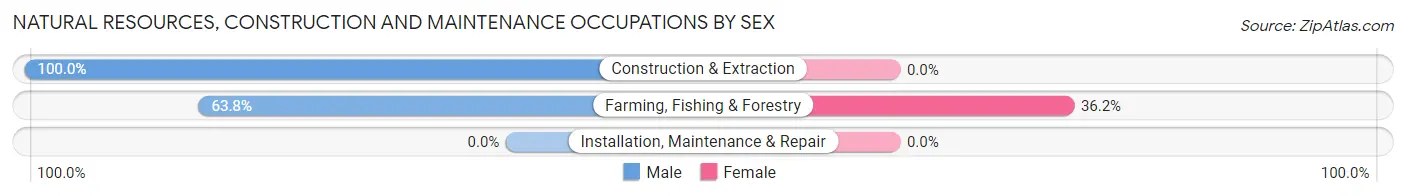
| Occupation | Male | Female |
| Farming, Fishing & Forestry | 37 (63.8%) | 21 (36.2%) |
| Construction & Extraction | 21 (100.0%) | 0 (0.0%) |
| Installation, Maintenance & Repair | 0 (0.0%) | 0 (0.0%) |
| Total (Category) | 58 (73.4%) | 21 (26.6%) |
| Total (Overall) | 174 (56.9%) | 132 (43.1%) |
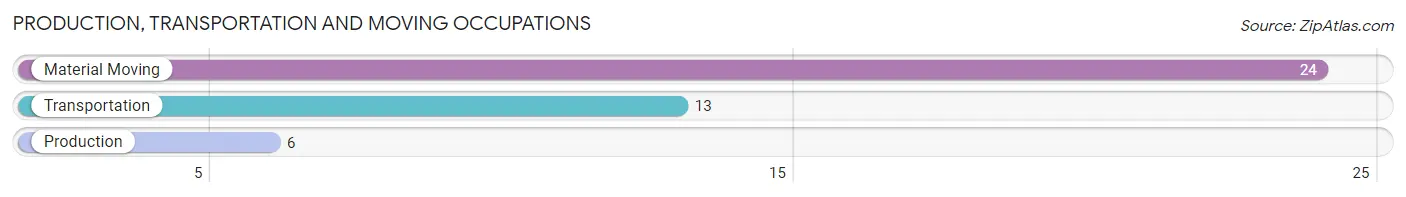
Production, Transportation and Moving Occupations
The most common Production, Transportation and Moving occupations in Harrah are Material Moving (24 | 7.8%), Transportation (13 | 4.3%), and Production (6 | 2.0%).
Production, Transportation and Moving Occupations by Sex
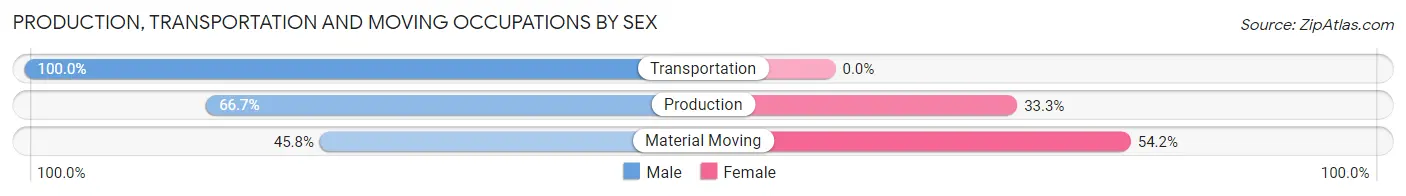
| Occupation | Male | Female |
| Production | 4 (66.7%) | 2 (33.3%) |
| Transportation | 13 (100.0%) | 0 (0.0%) |
| Material Moving | 11 (45.8%) | 13 (54.2%) |
| Total (Category) | 28 (65.1%) | 15 (34.9%) |
| Total (Overall) | 174 (56.9%) | 132 (43.1%) |
Employment Industries by Sex in Harrah
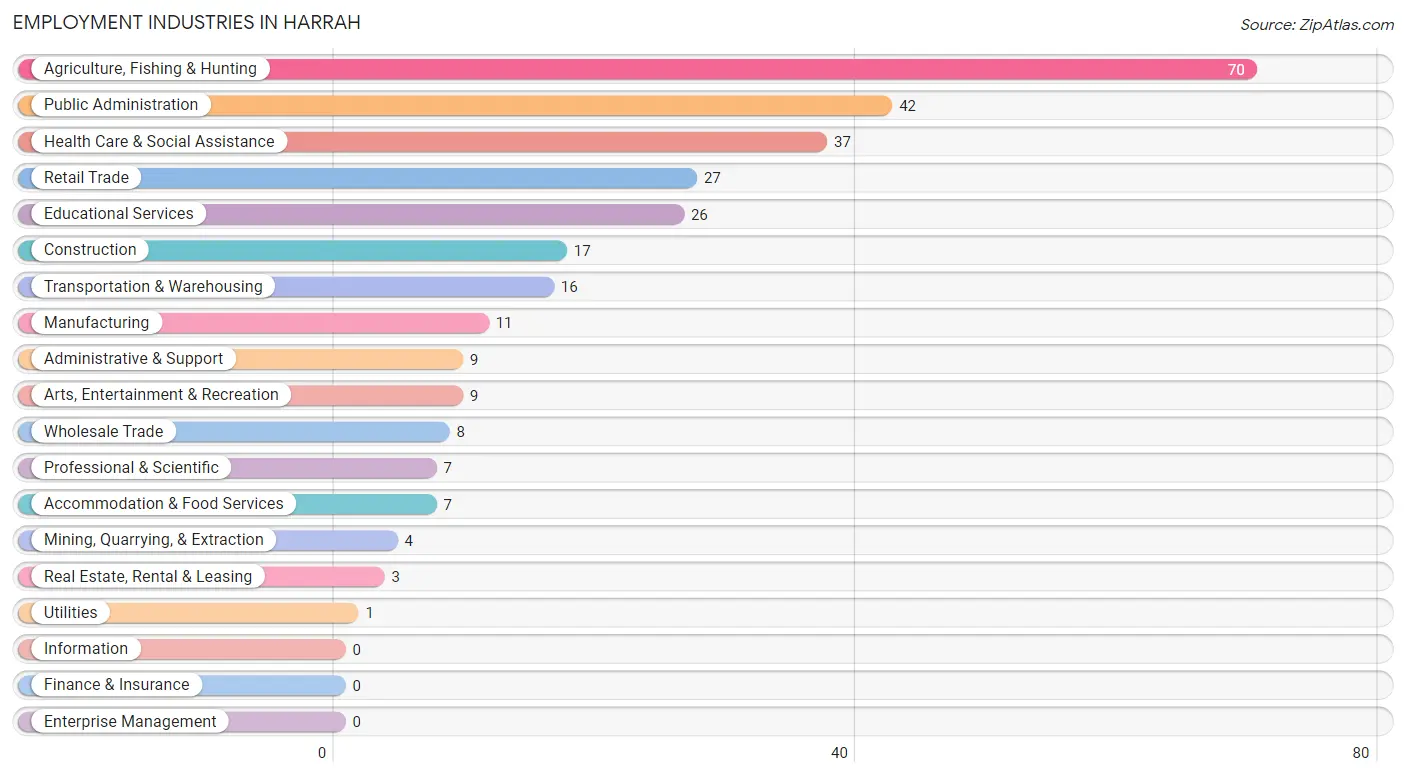
Employment Industries in Harrah
The major employment industries in Harrah include Agriculture, Fishing & Hunting (70 | 22.9%), Public Administration (42 | 13.7%), Health Care & Social Assistance (37 | 12.1%), Retail Trade (27 | 8.8%), and Educational Services (26 | 8.5%).
Employment Industries by Sex in Harrah
The Harrah industries that see more men than women are Mining, Quarrying, & Extraction (100.0%), Construction (100.0%), and Utilities (100.0%), whereas the industries that tend to have a higher number of women are Real Estate, Rental & Leasing (100.0%), Health Care & Social Assistance (78.4%), and Educational Services (76.9%).
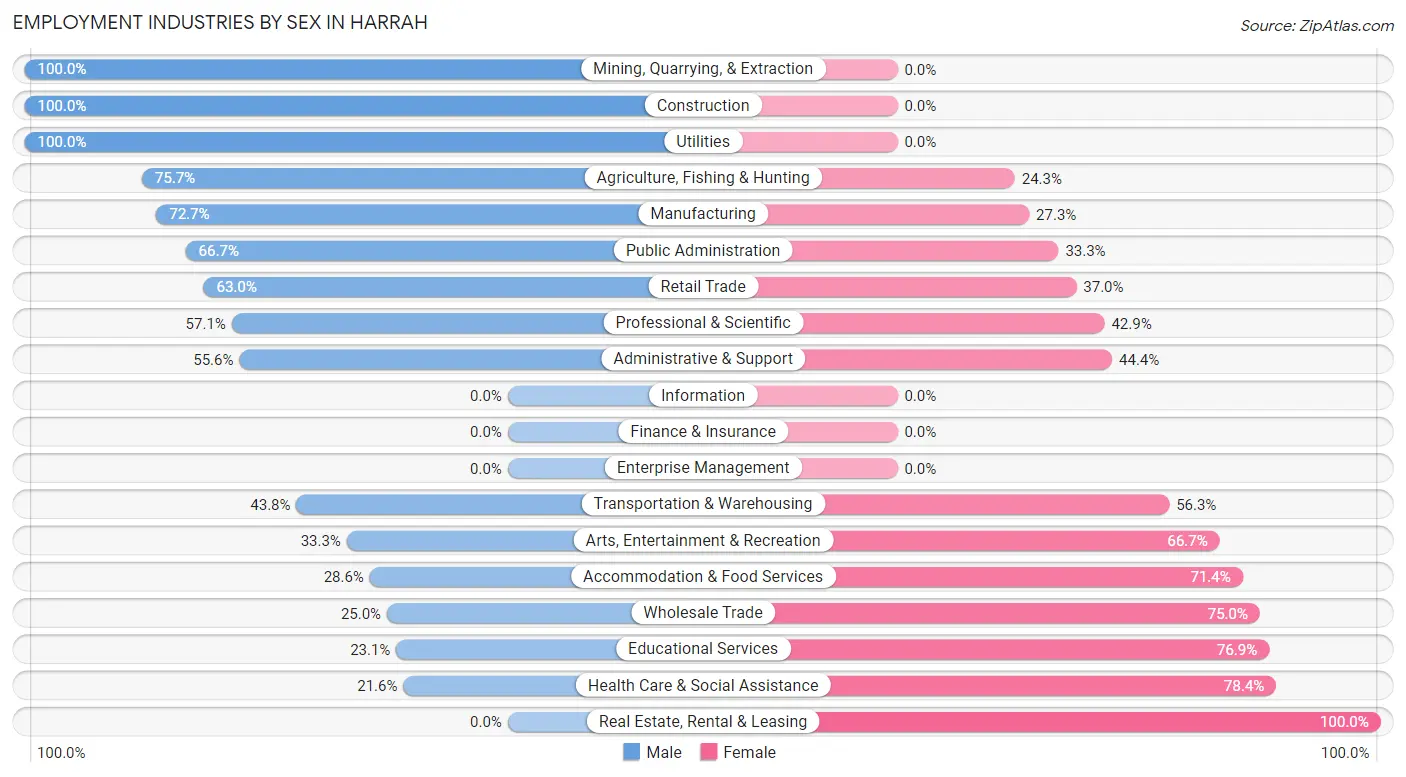
| Industry | Male | Female |
| Agriculture, Fishing & Hunting | 53 (75.7%) | 17 (24.3%) |
| Mining, Quarrying, & Extraction | 4 (100.0%) | 0 (0.0%) |
| Construction | 17 (100.0%) | 0 (0.0%) |
| Manufacturing | 8 (72.7%) | 3 (27.3%) |
| Wholesale Trade | 2 (25.0%) | 6 (75.0%) |
| Retail Trade | 17 (63.0%) | 10 (37.0%) |
| Transportation & Warehousing | 7 (43.8%) | 9 (56.2%) |
| Utilities | 1 (100.0%) | 0 (0.0%) |
| Information | 0 (0.0%) | 0 (0.0%) |
| Finance & Insurance | 0 (0.0%) | 0 (0.0%) |
| Real Estate, Rental & Leasing | 0 (0.0%) | 3 (100.0%) |
| Professional & Scientific | 4 (57.1%) | 3 (42.9%) |
| Enterprise Management | 0 (0.0%) | 0 (0.0%) |
| Administrative & Support | 5 (55.6%) | 4 (44.4%) |
| Educational Services | 6 (23.1%) | 20 (76.9%) |
| Health Care & Social Assistance | 8 (21.6%) | 29 (78.4%) |
| Arts, Entertainment & Recreation | 3 (33.3%) | 6 (66.7%) |
| Accommodation & Food Services | 2 (28.6%) | 5 (71.4%) |
| Public Administration | 28 (66.7%) | 14 (33.3%) |
| Total | 174 (56.9%) | 132 (43.1%) |
Education in Harrah
School Enrollment in Harrah
The most common levels of schooling among the 158 students in Harrah are high school (50 | 31.7%), middle school (49 | 31.0%), and elementary school (34 | 21.5%).
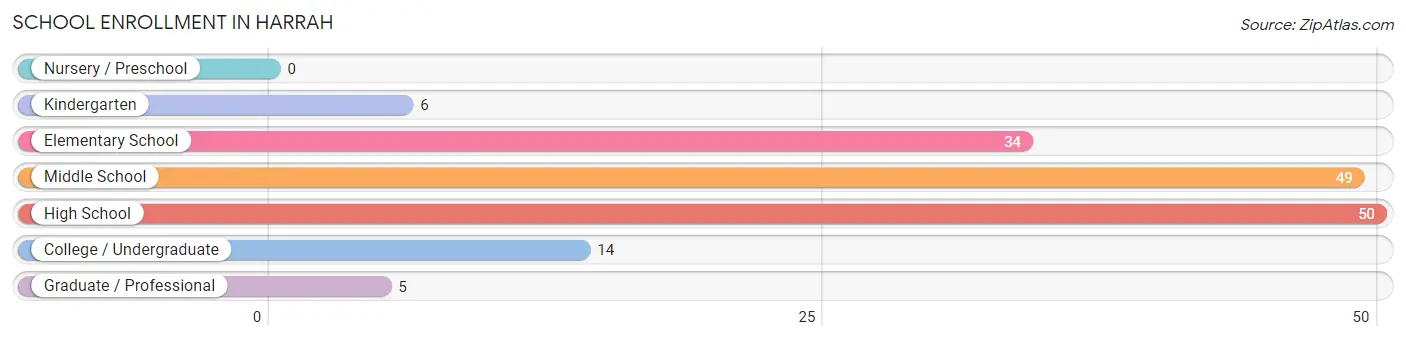
| School Level | # Students | % Students |
| Nursery / Preschool | 0 | 0.0% |
| Kindergarten | 6 | 3.8% |
| Elementary School | 34 | 21.5% |
| Middle School | 49 | 31.0% |
| High School | 50 | 31.7% |
| College / Undergraduate | 14 | 8.9% |
| Graduate / Professional | 5 | 3.2% |
| Total | 158 | 100.0% |
School Enrollment by Age by Funding Source in Harrah
Out of a total of 158 students who are enrolled in schools in Harrah, 10 (6.3%) attend a private institution, while the remaining 148 (93.7%) are enrolled in public schools. The age group of 35 years and over has the highest likelihood of being enrolled in private schools, with 4 (66.7% in the age bracket) enrolled. Conversely, the age group of 5 to 9 year old has the lowest likelihood of being enrolled in a private school, with 36 (100.0% in the age bracket) attending a public institution.
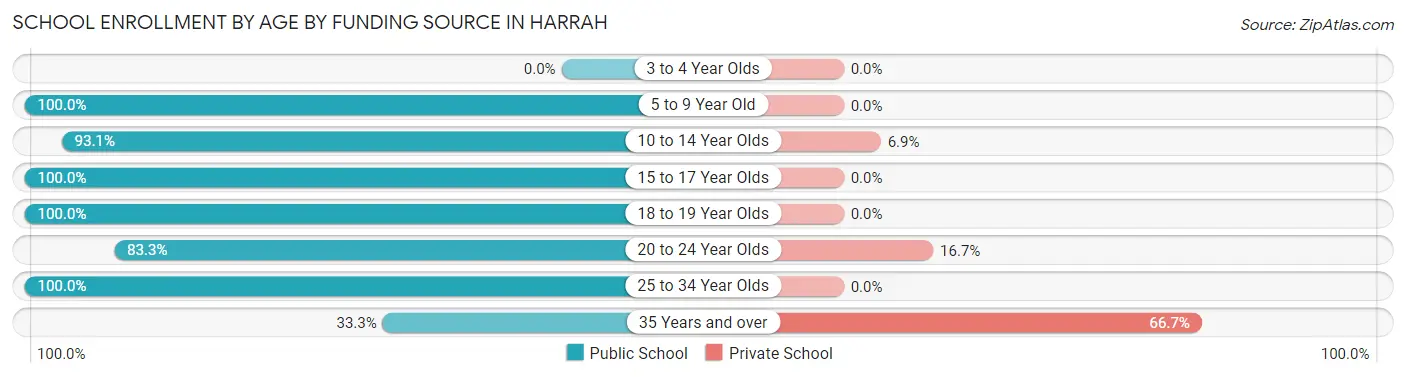
| Age Bracket | Public School | Private School |
| 3 to 4 Year Olds | 0 (0.0%) | 0 (0.0%) |
| 5 to 9 Year Old | 36 (100.0%) | 0 (0.0%) |
| 10 to 14 Year Olds | 54 (93.1%) | 4 (6.9%) |
| 15 to 17 Year Olds | 42 (100.0%) | 0 (0.0%) |
| 18 to 19 Year Olds | 3 (100.0%) | 0 (0.0%) |
| 20 to 24 Year Olds | 10 (83.3%) | 2 (16.7%) |
| 25 to 34 Year Olds | 1 (100.0%) | 0 (0.0%) |
| 35 Years and over | 2 (33.3%) | 4 (66.7%) |
| Total | 148 (93.7%) | 10 (6.3%) |
Educational Attainment by Field of Study in Harrah
Bio, nature & agricultural (17 | 26.6%), education (12 | 18.8%), social sciences (7 | 10.9%), psychology (5 | 7.8%), and arts & humanities (5 | 7.8%) are the most common fields of study among 64 individuals in Harrah who have obtained a bachelor's degree or higher.
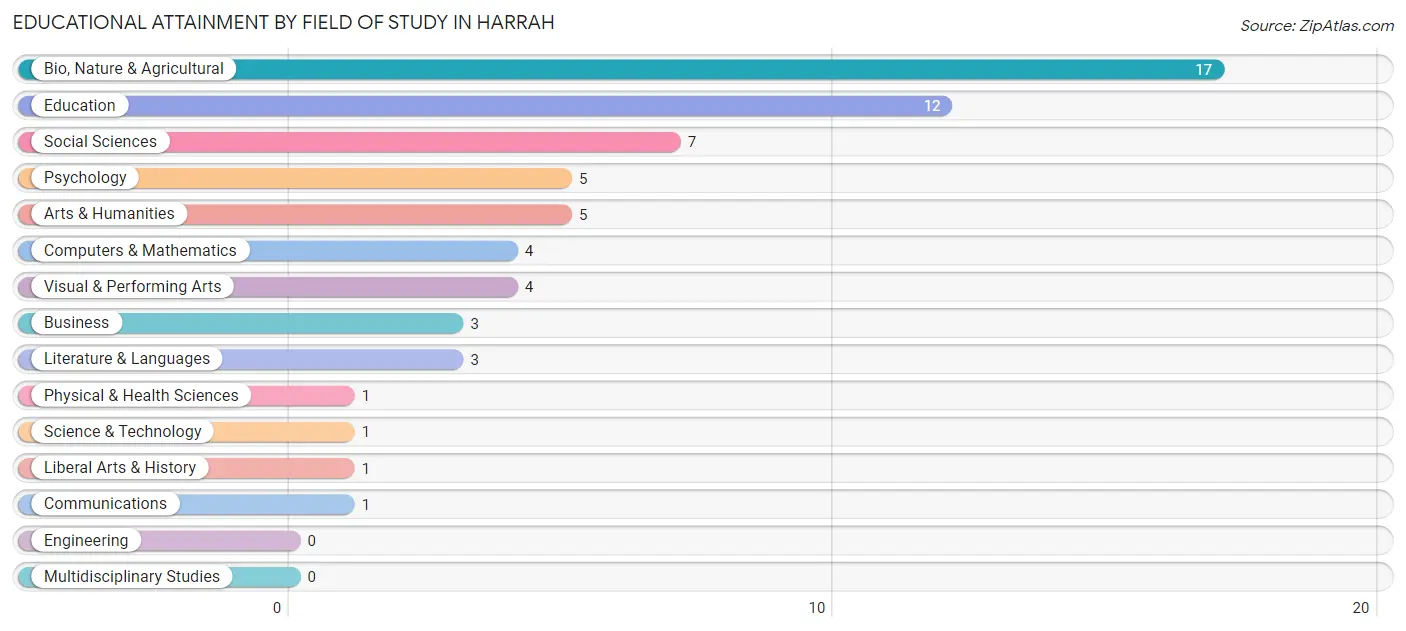
| Field of Study | # Graduates | % Graduates |
| Computers & Mathematics | 4 | 6.2% |
| Bio, Nature & Agricultural | 17 | 26.6% |
| Physical & Health Sciences | 1 | 1.6% |
| Psychology | 5 | 7.8% |
| Social Sciences | 7 | 10.9% |
| Engineering | 0 | 0.0% |
| Multidisciplinary Studies | 0 | 0.0% |
| Science & Technology | 1 | 1.6% |
| Business | 3 | 4.7% |
| Education | 12 | 18.8% |
| Literature & Languages | 3 | 4.7% |
| Liberal Arts & History | 1 | 1.6% |
| Visual & Performing Arts | 4 | 6.2% |
| Communications | 1 | 1.6% |
| Arts & Humanities | 5 | 7.8% |
| Total | 64 | 100.0% |
Transportation & Commute in Harrah
Vehicle Availability by Sex in Harrah
The most prevalent vehicle ownership categories in Harrah are males with 3 vehicles (61, accounting for 35.3%) and females with 3 vehicles (44, making up 48.4%).
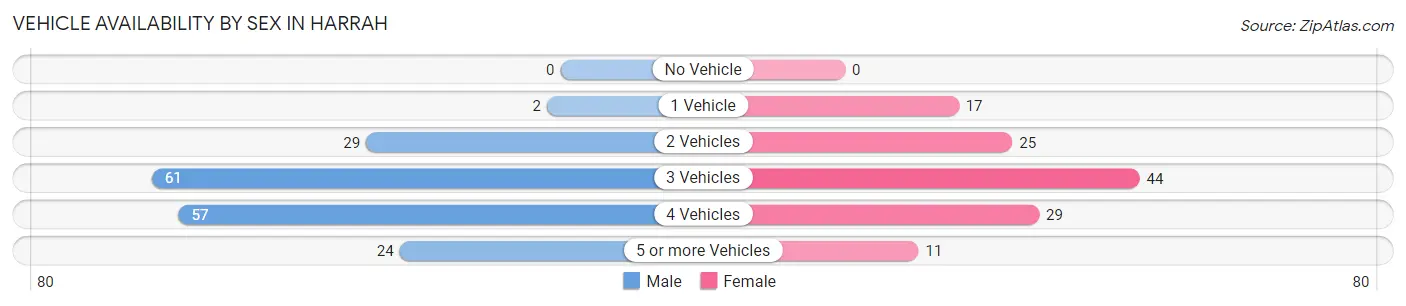
| Vehicles Available | Male | Female |
| No Vehicle | 0 (0.0%) | 0 (0.0%) |
| 1 Vehicle | 2 (1.2%) | 17 (13.5%) |
| 2 Vehicles | 29 (16.8%) | 25 (19.8%) |
| 3 Vehicles | 61 (35.3%) | 44 (34.9%) |
| 4 Vehicles | 57 (33.0%) | 29 (23.0%) |
| 5 or more Vehicles | 24 (13.9%) | 11 (8.7%) |
| Total | 173 (100.0%) | 126 (100.0%) |
Commute Time in Harrah
The most frequently occuring commute durations in Harrah are 30 to 34 minutes (61 commuters, 21.2%), 15 to 19 minutes (57 commuters, 19.8%), and 20 to 24 minutes (34 commuters, 11.8%).
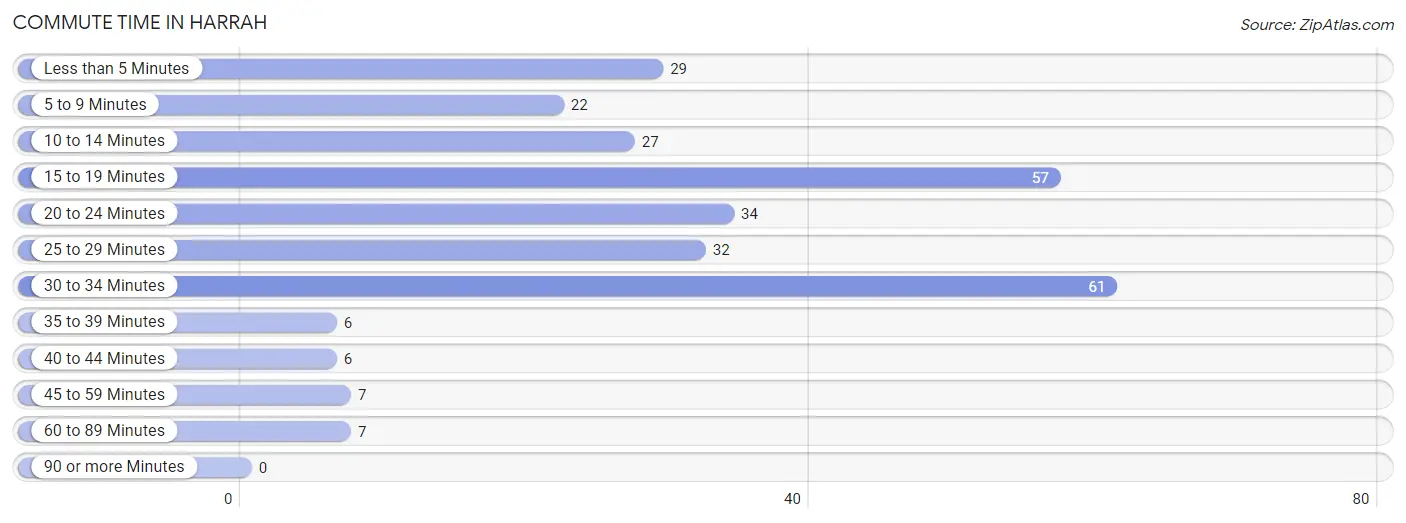
| Commute Time | # Commuters | % Commuters |
| Less than 5 Minutes | 29 | 10.1% |
| 5 to 9 Minutes | 22 | 7.6% |
| 10 to 14 Minutes | 27 | 9.4% |
| 15 to 19 Minutes | 57 | 19.8% |
| 20 to 24 Minutes | 34 | 11.8% |
| 25 to 29 Minutes | 32 | 11.1% |
| 30 to 34 Minutes | 61 | 21.2% |
| 35 to 39 Minutes | 6 | 2.1% |
| 40 to 44 Minutes | 6 | 2.1% |
| 45 to 59 Minutes | 7 | 2.4% |
| 60 to 89 Minutes | 7 | 2.4% |
| 90 or more Minutes | 0 | 0.0% |
Commute Time by Sex in Harrah
The most common commute times in Harrah are 15 to 19 minutes (37 commuters, 22.4%) for males and 30 to 34 minutes (35 commuters, 28.5%) for females.
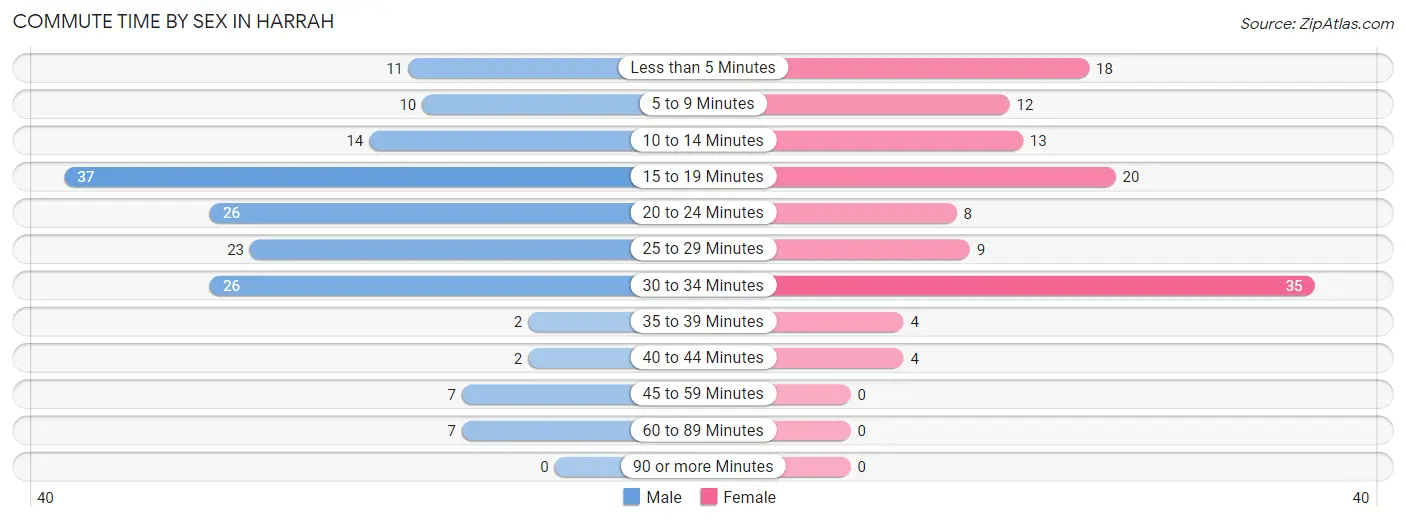
| Commute Time | Male | Female |
| Less than 5 Minutes | 11 (6.7%) | 18 (14.6%) |
| 5 to 9 Minutes | 10 (6.1%) | 12 (9.8%) |
| 10 to 14 Minutes | 14 (8.5%) | 13 (10.6%) |
| 15 to 19 Minutes | 37 (22.4%) | 20 (16.3%) |
| 20 to 24 Minutes | 26 (15.8%) | 8 (6.5%) |
| 25 to 29 Minutes | 23 (13.9%) | 9 (7.3%) |
| 30 to 34 Minutes | 26 (15.8%) | 35 (28.5%) |
| 35 to 39 Minutes | 2 (1.2%) | 4 (3.3%) |
| 40 to 44 Minutes | 2 (1.2%) | 4 (3.3%) |
| 45 to 59 Minutes | 7 (4.2%) | 0 (0.0%) |
| 60 to 89 Minutes | 7 (4.2%) | 0 (0.0%) |
| 90 or more Minutes | 0 (0.0%) | 0 (0.0%) |
Time of Departure to Work by Sex in Harrah
The most frequent times of departure to work in Harrah are 6:30 AM to 6:59 AM (25, 15.1%) for males and 7:30 AM to 7:59 AM (24, 19.5%) for females.
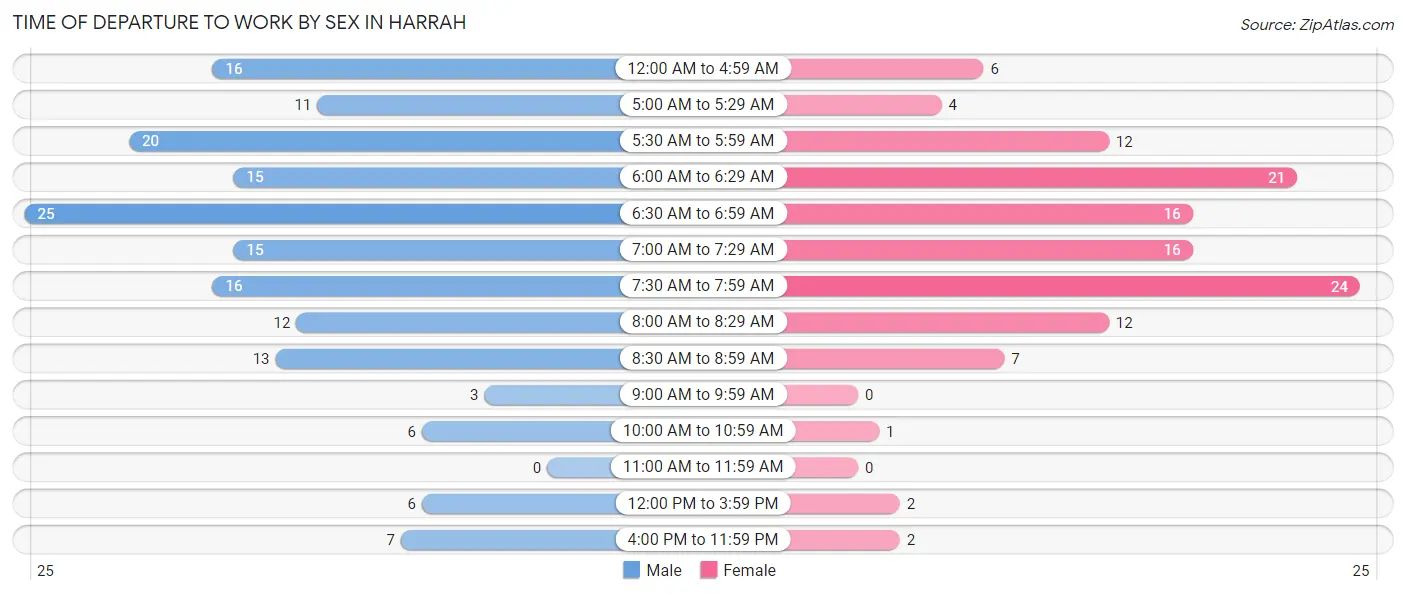
| Time of Departure | Male | Female |
| 12:00 AM to 4:59 AM | 16 (9.7%) | 6 (4.9%) |
| 5:00 AM to 5:29 AM | 11 (6.7%) | 4 (3.3%) |
| 5:30 AM to 5:59 AM | 20 (12.1%) | 12 (9.8%) |
| 6:00 AM to 6:29 AM | 15 (9.1%) | 21 (17.1%) |
| 6:30 AM to 6:59 AM | 25 (15.1%) | 16 (13.0%) |
| 7:00 AM to 7:29 AM | 15 (9.1%) | 16 (13.0%) |
| 7:30 AM to 7:59 AM | 16 (9.7%) | 24 (19.5%) |
| 8:00 AM to 8:29 AM | 12 (7.3%) | 12 (9.8%) |
| 8:30 AM to 8:59 AM | 13 (7.9%) | 7 (5.7%) |
| 9:00 AM to 9:59 AM | 3 (1.8%) | 0 (0.0%) |
| 10:00 AM to 10:59 AM | 6 (3.6%) | 1 (0.8%) |
| 11:00 AM to 11:59 AM | 0 (0.0%) | 0 (0.0%) |
| 12:00 PM to 3:59 PM | 6 (3.6%) | 2 (1.6%) |
| 4:00 PM to 11:59 PM | 7 (4.2%) | 2 (1.6%) |
| Total | 165 (100.0%) | 123 (100.0%) |
Housing Occupancy in Harrah
Occupancy by Ownership in Harrah
Of the total 210 dwellings in Harrah, owner-occupied units account for 137 (65.2%), while renter-occupied units make up 73 (34.8%).
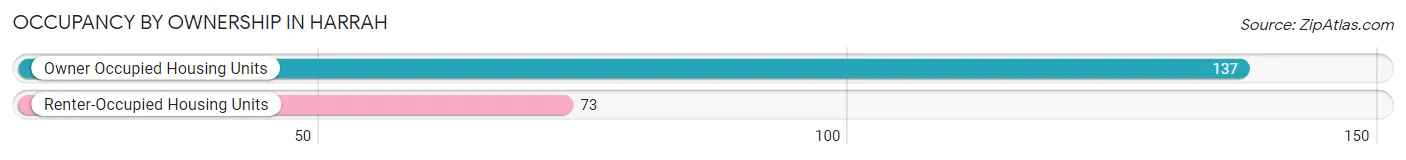
| Occupancy | # Housing Units | % Housing Units |
| Owner Occupied Housing Units | 137 | 65.2% |
| Renter-Occupied Housing Units | 73 | 34.8% |
| Total Occupied Housing Units | 210 | 100.0% |
Occupancy by Household Size in Harrah
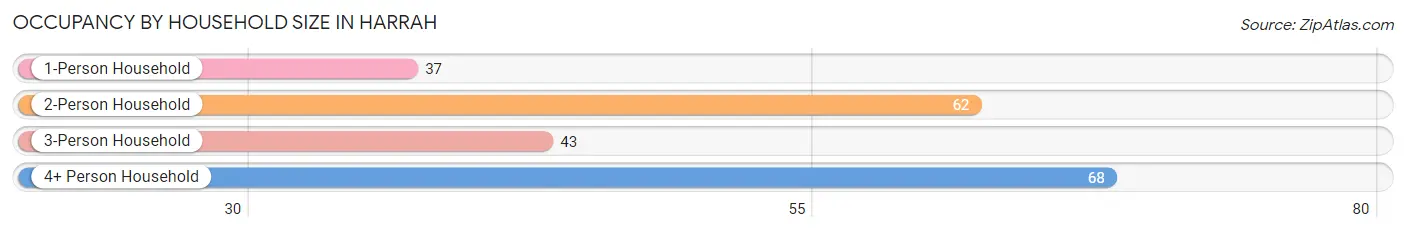
| Household Size | # Housing Units | % Housing Units |
| 1-Person Household | 37 | 17.6% |
| 2-Person Household | 62 | 29.5% |
| 3-Person Household | 43 | 20.5% |
| 4+ Person Household | 68 | 32.4% |
| Total Housing Units | 210 | 100.0% |
Occupancy by Ownership by Household Size in Harrah
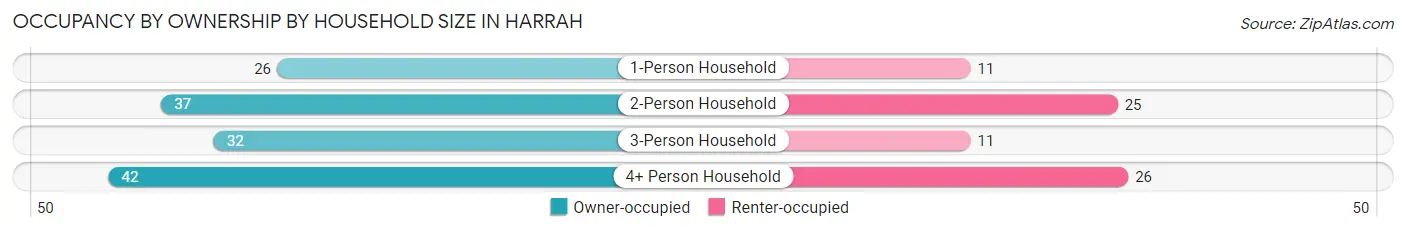
| Household Size | Owner-occupied | Renter-occupied |
| 1-Person Household | 26 (70.3%) | 11 (29.7%) |
| 2-Person Household | 37 (59.7%) | 25 (40.3%) |
| 3-Person Household | 32 (74.4%) | 11 (25.6%) |
| 4+ Person Household | 42 (61.8%) | 26 (38.2%) |
| Total Housing Units | 137 (65.2%) | 73 (34.8%) |
Occupancy by Educational Attainment in Harrah
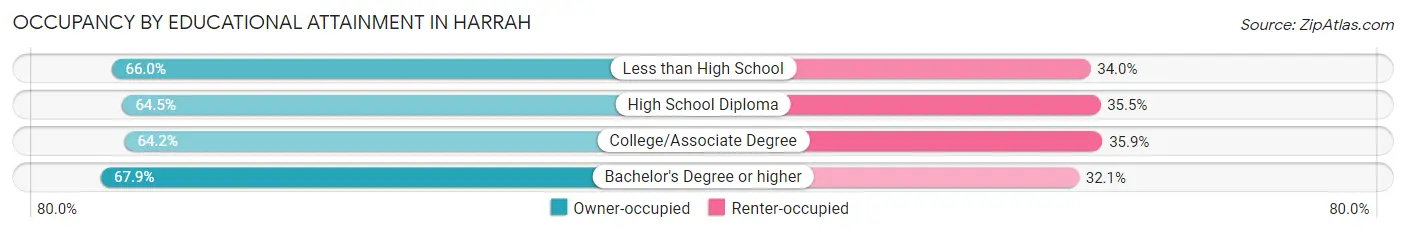
| Household Size | Owner-occupied | Renter-occupied |
| Less than High School | 35 (66.0%) | 18 (34.0%) |
| High School Diploma | 49 (64.5%) | 27 (35.5%) |
| College/Associate Degree | 34 (64.1%) | 19 (35.8%) |
| Bachelor's Degree or higher | 19 (67.9%) | 9 (32.1%) |
Occupancy by Age of Householder in Harrah
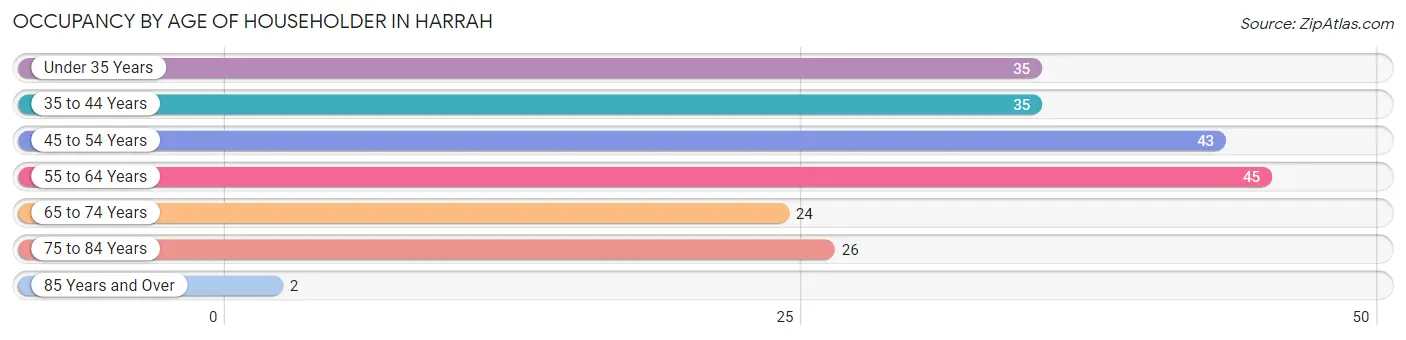
| Age Bracket | # Households | % Households |
| Under 35 Years | 35 | 16.7% |
| 35 to 44 Years | 35 | 16.7% |
| 45 to 54 Years | 43 | 20.5% |
| 55 to 64 Years | 45 | 21.4% |
| 65 to 74 Years | 24 | 11.4% |
| 75 to 84 Years | 26 | 12.4% |
| 85 Years and Over | 2 | 0.9% |
| Total | 210 | 100.0% |
Housing Finances in Harrah
Median Income by Occupancy in Harrah
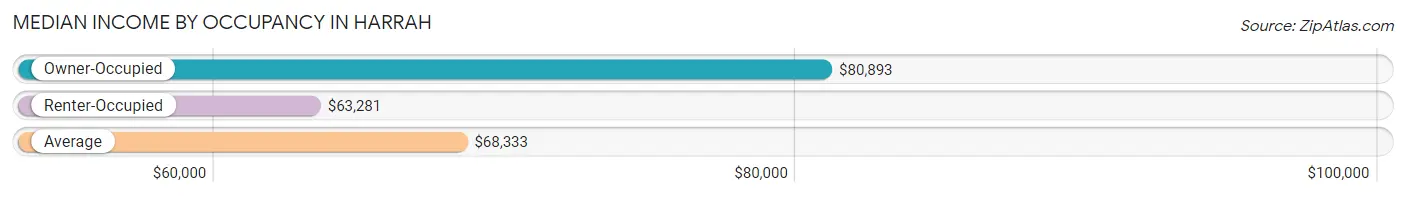
| Occupancy Type | # Households | Median Income |
| Owner-Occupied | 137 (65.2%) | $80,893 |
| Renter-Occupied | 73 (34.8%) | $63,281 |
| Average | 210 (100.0%) | $68,333 |
Occupancy by Householder Income Bracket in Harrah
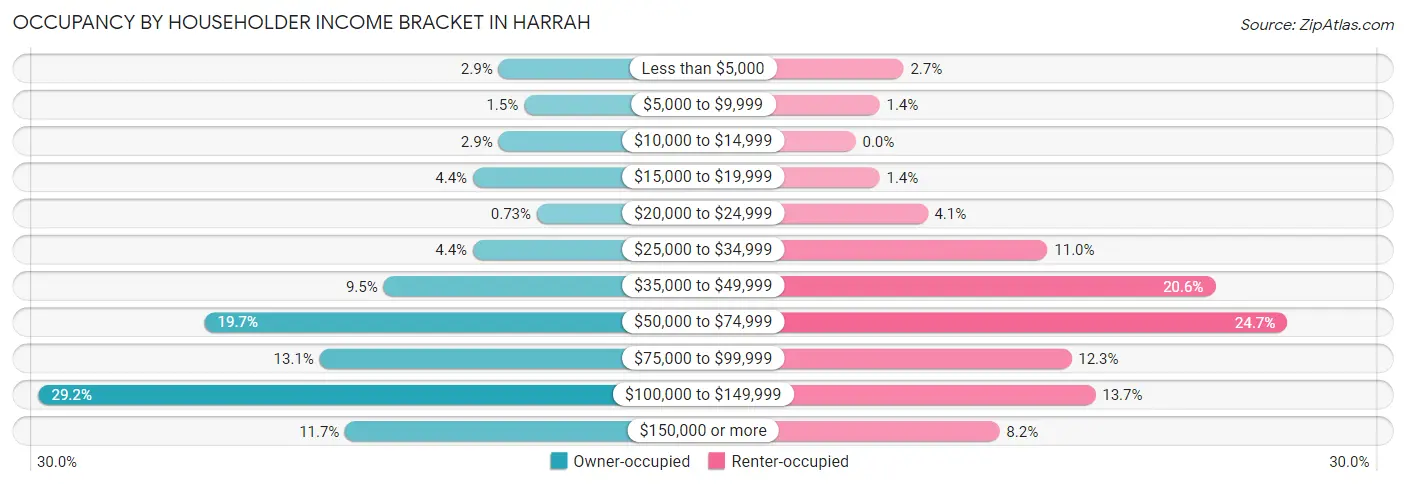
| Income Bracket | Owner-occupied | Renter-occupied |
| Less than $5,000 | 4 (2.9%) | 2 (2.7%) |
| $5,000 to $9,999 | 2 (1.5%) | 1 (1.4%) |
| $10,000 to $14,999 | 4 (2.9%) | 0 (0.0%) |
| $15,000 to $19,999 | 6 (4.4%) | 1 (1.4%) |
| $20,000 to $24,999 | 1 (0.7%) | 3 (4.1%) |
| $25,000 to $34,999 | 6 (4.4%) | 8 (11.0%) |
| $35,000 to $49,999 | 13 (9.5%) | 15 (20.5%) |
| $50,000 to $74,999 | 27 (19.7%) | 18 (24.7%) |
| $75,000 to $99,999 | 18 (13.1%) | 9 (12.3%) |
| $100,000 to $149,999 | 40 (29.2%) | 10 (13.7%) |
| $150,000 or more | 16 (11.7%) | 6 (8.2%) |
| Total | 137 (100.0%) | 73 (100.0%) |
Monthly Housing Cost Tiers in Harrah
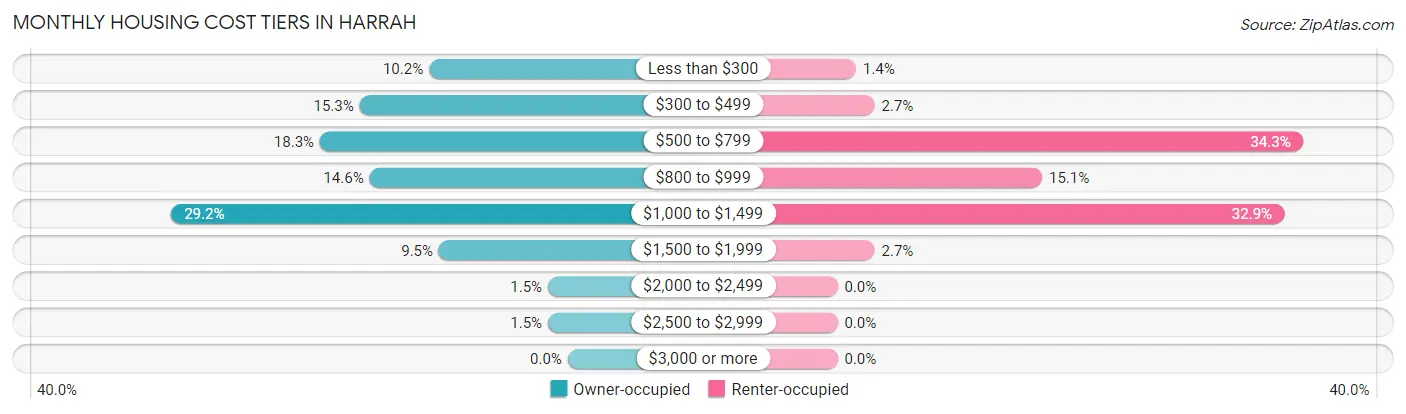
| Monthly Cost | Owner-occupied | Renter-occupied |
| Less than $300 | 14 (10.2%) | 1 (1.4%) |
| $300 to $499 | 21 (15.3%) | 2 (2.7%) |
| $500 to $799 | 25 (18.2%) | 25 (34.3%) |
| $800 to $999 | 20 (14.6%) | 11 (15.1%) |
| $1,000 to $1,499 | 40 (29.2%) | 24 (32.9%) |
| $1,500 to $1,999 | 13 (9.5%) | 2 (2.7%) |
| $2,000 to $2,499 | 2 (1.5%) | 0 (0.0%) |
| $2,500 to $2,999 | 2 (1.5%) | 0 (0.0%) |
| $3,000 or more | 0 (0.0%) | 0 (0.0%) |
| Total | 137 (100.0%) | 73 (100.0%) |
Physical Housing Characteristics in Harrah
Housing Structures in Harrah
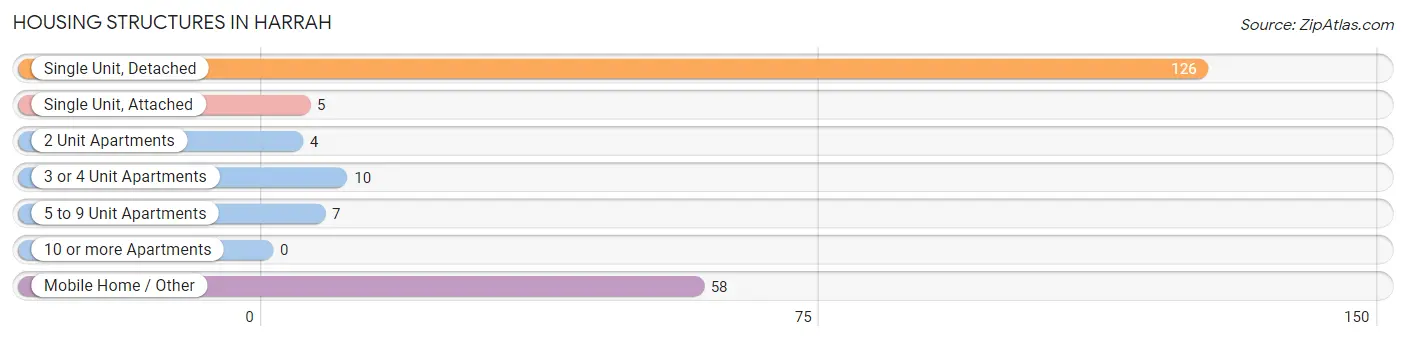
| Structure Type | # Housing Units | % Housing Units |
| Single Unit, Detached | 126 | 60.0% |
| Single Unit, Attached | 5 | 2.4% |
| 2 Unit Apartments | 4 | 1.9% |
| 3 or 4 Unit Apartments | 10 | 4.8% |
| 5 to 9 Unit Apartments | 7 | 3.3% |
| 10 or more Apartments | 0 | 0.0% |
| Mobile Home / Other | 58 | 27.6% |
| Total | 210 | 100.0% |
Housing Structures by Occupancy in Harrah
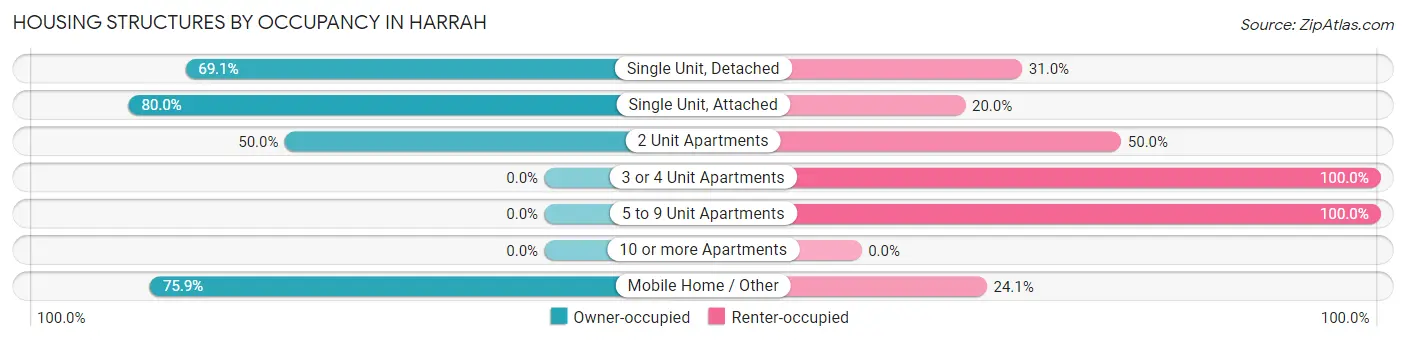
| Structure Type | Owner-occupied | Renter-occupied |
| Single Unit, Detached | 87 (69.1%) | 39 (30.9%) |
| Single Unit, Attached | 4 (80.0%) | 1 (20.0%) |
| 2 Unit Apartments | 2 (50.0%) | 2 (50.0%) |
| 3 or 4 Unit Apartments | 0 (0.0%) | 10 (100.0%) |
| 5 to 9 Unit Apartments | 0 (0.0%) | 7 (100.0%) |
| 10 or more Apartments | 0 (0.0%) | 0 (0.0%) |
| Mobile Home / Other | 44 (75.9%) | 14 (24.1%) |
| Total | 137 (65.2%) | 73 (34.8%) |
Housing Structures by Number of Rooms in Harrah
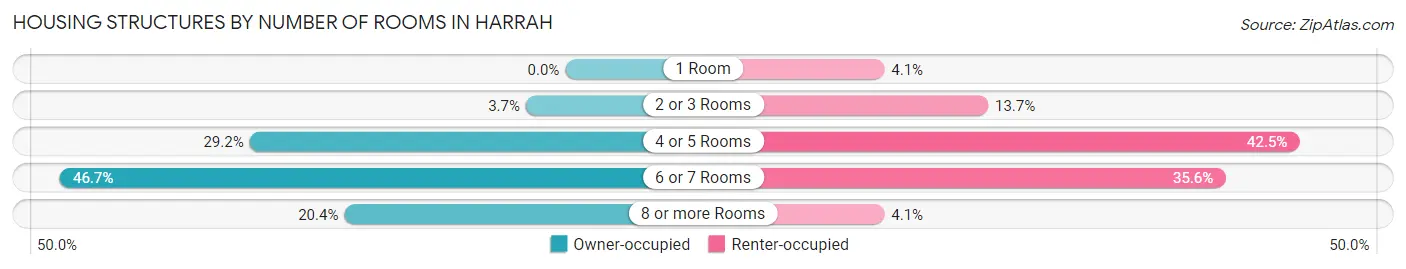
| Number of Rooms | Owner-occupied | Renter-occupied |
| 1 Room | 0 (0.0%) | 3 (4.1%) |
| 2 or 3 Rooms | 5 (3.6%) | 10 (13.7%) |
| 4 or 5 Rooms | 40 (29.2%) | 31 (42.5%) |
| 6 or 7 Rooms | 64 (46.7%) | 26 (35.6%) |
| 8 or more Rooms | 28 (20.4%) | 3 (4.1%) |
| Total | 137 (100.0%) | 73 (100.0%) |
Housing Structure by Heating Type in Harrah
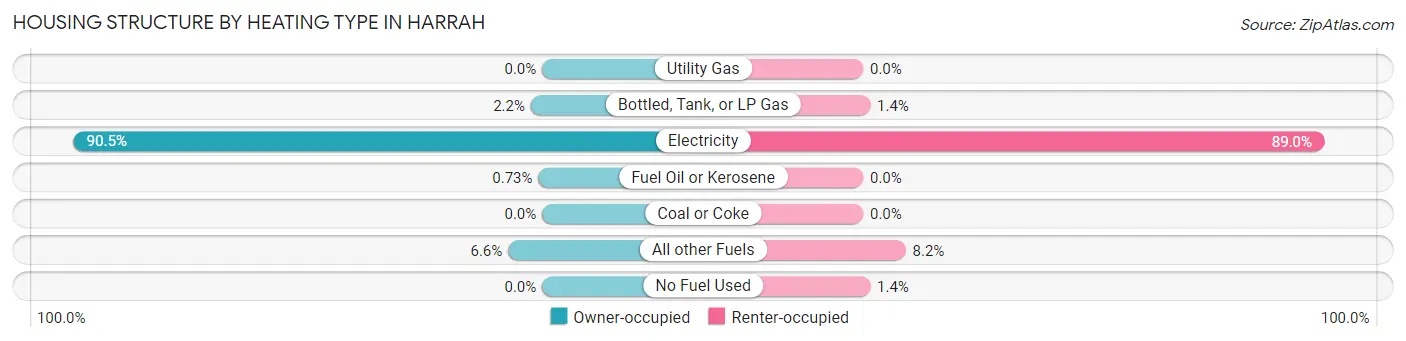
| Heating Type | Owner-occupied | Renter-occupied |
| Utility Gas | 0 (0.0%) | 0 (0.0%) |
| Bottled, Tank, or LP Gas | 3 (2.2%) | 1 (1.4%) |
| Electricity | 124 (90.5%) | 65 (89.0%) |
| Fuel Oil or Kerosene | 1 (0.7%) | 0 (0.0%) |
| Coal or Coke | 0 (0.0%) | 0 (0.0%) |
| All other Fuels | 9 (6.6%) | 6 (8.2%) |
| No Fuel Used | 0 (0.0%) | 1 (1.4%) |
| Total | 137 (100.0%) | 73 (100.0%) |
Household Vehicle Usage in Harrah
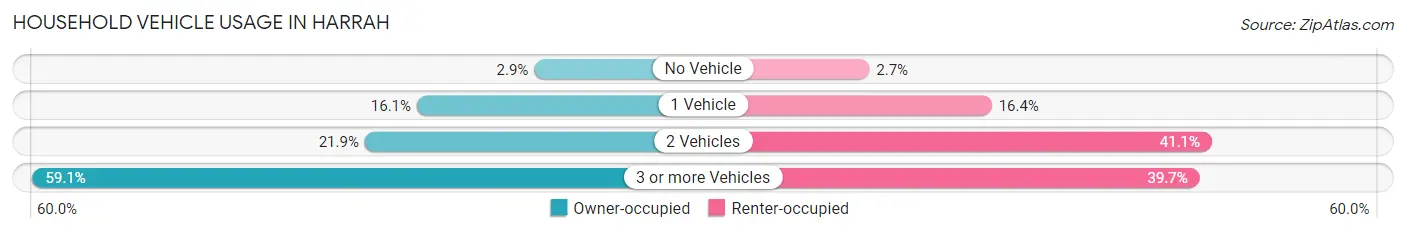
| Vehicles per Household | Owner-occupied | Renter-occupied |
| No Vehicle | 4 (2.9%) | 2 (2.7%) |
| 1 Vehicle | 22 (16.1%) | 12 (16.4%) |
| 2 Vehicles | 30 (21.9%) | 30 (41.1%) |
| 3 or more Vehicles | 81 (59.1%) | 29 (39.7%) |
| Total | 137 (100.0%) | 73 (100.0%) |
Real Estate & Mortgages in Harrah
Real Estate and Mortgage Overview in Harrah
| Characteristic | Without Mortgage | With Mortgage |
| Housing Units | 63 | 74 |
| Median Property Value | $146,300 | $170,500 |
| Median Household Income | $55,750 | $6 |
| Monthly Housing Costs | $477 | $0 |
| Real Estate Taxes | $1,472 | $0 |
Property Value by Mortgage Status in Harrah
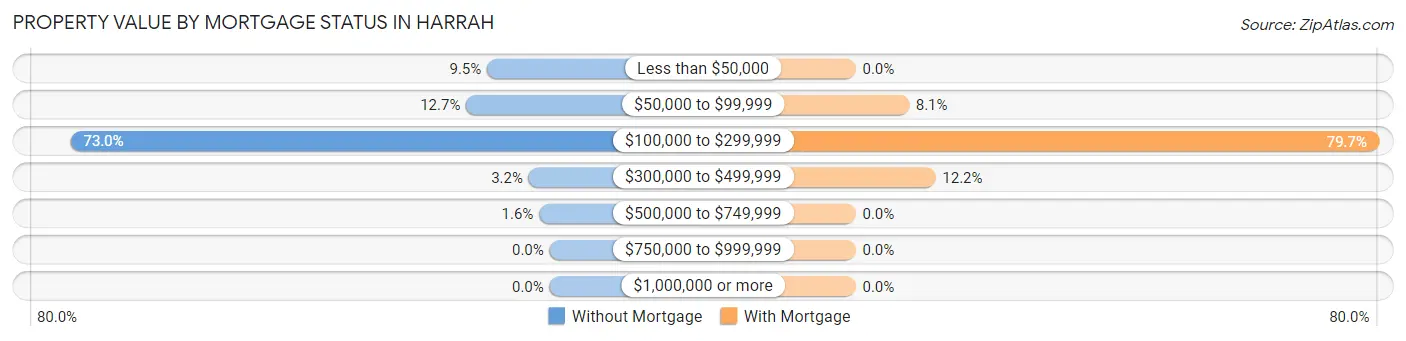
| Property Value | Without Mortgage | With Mortgage |
| Less than $50,000 | 6 (9.5%) | 0 (0.0%) |
| $50,000 to $99,999 | 8 (12.7%) | 6 (8.1%) |
| $100,000 to $299,999 | 46 (73.0%) | 59 (79.7%) |
| $300,000 to $499,999 | 2 (3.2%) | 9 (12.2%) |
| $500,000 to $749,999 | 1 (1.6%) | 0 (0.0%) |
| $750,000 to $999,999 | 0 (0.0%) | 0 (0.0%) |
| $1,000,000 or more | 0 (0.0%) | 0 (0.0%) |
| Total | 63 (100.0%) | 74 (100.0%) |
Household Income by Mortgage Status in Harrah
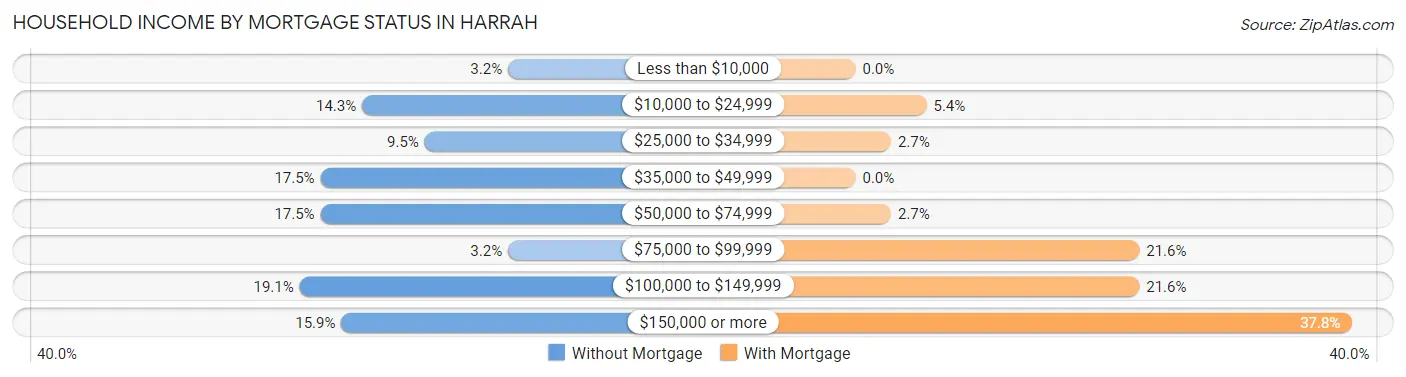
| Household Income | Without Mortgage | With Mortgage |
| Less than $10,000 | 2 (3.2%) | 0 (0.0%) |
| $10,000 to $24,999 | 9 (14.3%) | 4 (5.4%) |
| $25,000 to $34,999 | 6 (9.5%) | 2 (2.7%) |
| $35,000 to $49,999 | 11 (17.5%) | 0 (0.0%) |
| $50,000 to $74,999 | 11 (17.5%) | 2 (2.7%) |
| $75,000 to $99,999 | 2 (3.2%) | 16 (21.6%) |
| $100,000 to $149,999 | 12 (19.1%) | 16 (21.6%) |
| $150,000 or more | 10 (15.9%) | 28 (37.8%) |
| Total | 63 (100.0%) | 74 (100.0%) |
Property Value to Household Income Ratio in Harrah
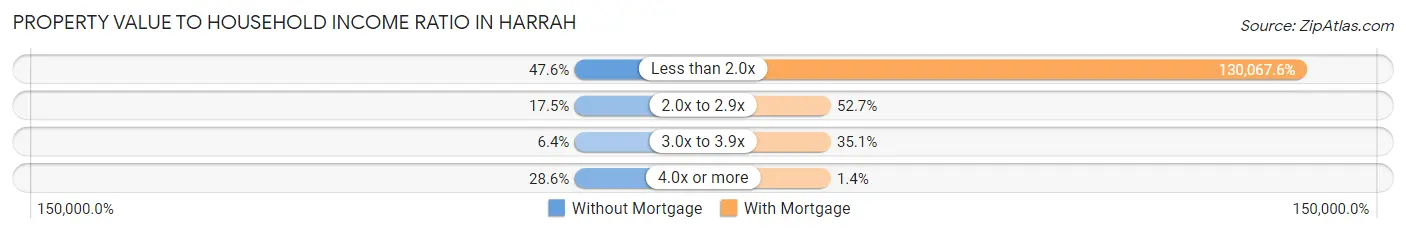
| Value-to-Income Ratio | Without Mortgage | With Mortgage |
| Less than 2.0x | 30 (47.6%) | 96,250 (130,067.6%) |
| 2.0x to 2.9x | 11 (17.5%) | 39 (52.7%) |
| 3.0x to 3.9x | 4 (6.4%) | 26 (35.1%) |
| 4.0x or more | 18 (28.6%) | 1 (1.3%) |
| Total | 63 (100.0%) | 74 (100.0%) |
Real Estate Taxes by Mortgage Status in Harrah
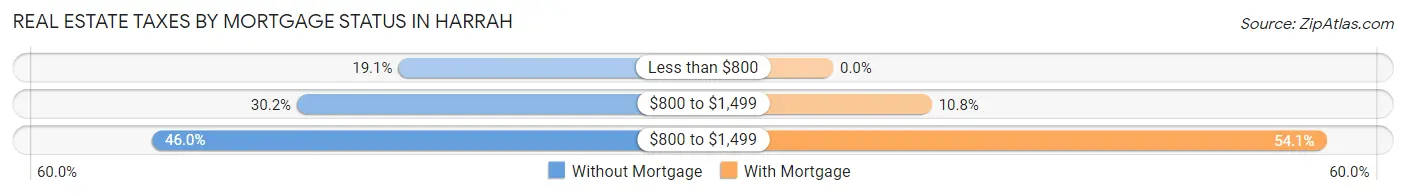
| Property Taxes | Without Mortgage | With Mortgage |
| Less than $800 | 12 (19.1%) | 0 (0.0%) |
| $800 to $1,499 | 19 (30.2%) | 8 (10.8%) |
| $800 to $1,499 | 29 (46.0%) | 40 (54.0%) |
| Total | 63 (100.0%) | 74 (100.0%) |
Health & Disability in Harrah
Health Insurance Coverage by Age in Harrah
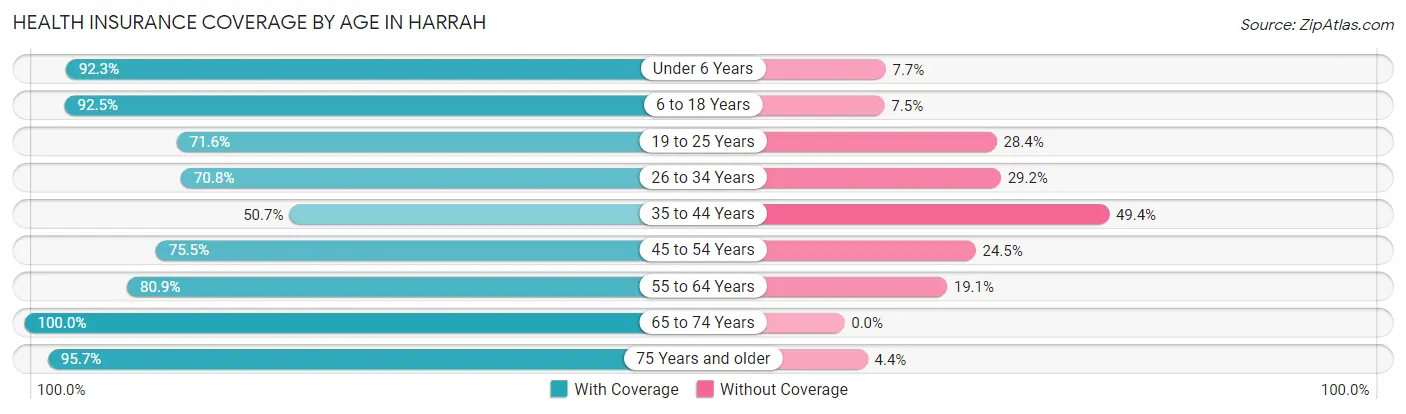
| Age Bracket | With Coverage | Without Coverage |
| Under 6 Years | 24 (92.3%) | 2 (7.7%) |
| 6 to 18 Years | 136 (92.5%) | 11 (7.5%) |
| 19 to 25 Years | 53 (71.6%) | 21 (28.4%) |
| 26 to 34 Years | 51 (70.8%) | 21 (29.2%) |
| 35 to 44 Years | 39 (50.6%) | 38 (49.3%) |
| 45 to 54 Years | 71 (75.5%) | 23 (24.5%) |
| 55 to 64 Years | 55 (80.9%) | 13 (19.1%) |
| 65 to 74 Years | 36 (100.0%) | 0 (0.0%) |
| 75 Years and older | 44 (95.7%) | 2 (4.3%) |
| Total | 509 (79.5%) | 131 (20.5%) |
Health Insurance Coverage by Citizenship Status in Harrah
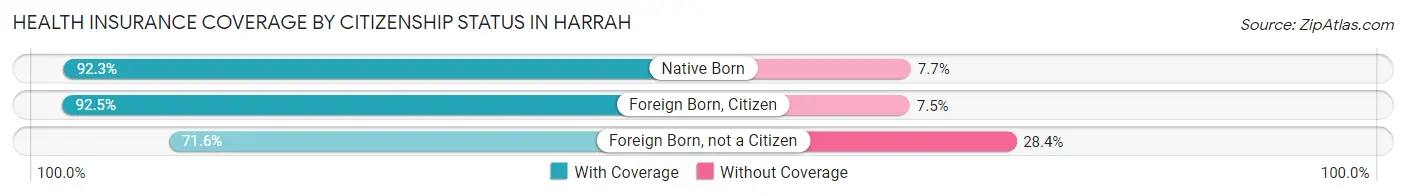
| Citizenship Status | With Coverage | Without Coverage |
| Native Born | 24 (92.3%) | 2 (7.7%) |
| Foreign Born, Citizen | 136 (92.5%) | 11 (7.5%) |
| Foreign Born, not a Citizen | 53 (71.6%) | 21 (28.4%) |
Health Insurance Coverage by Household Income in Harrah
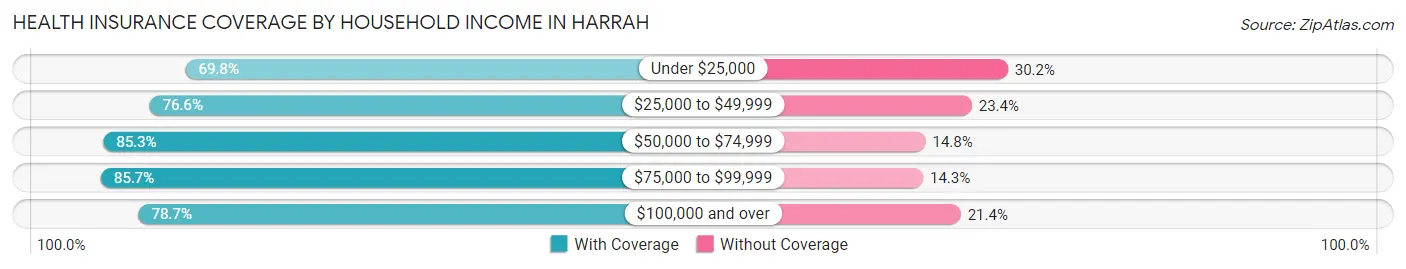
| Household Income | With Coverage | Without Coverage |
| Under $25,000 | 44 (69.8%) | 19 (30.2%) |
| $25,000 to $49,999 | 85 (76.6%) | 26 (23.4%) |
| $50,000 to $74,999 | 104 (85.3%) | 18 (14.7%) |
| $75,000 to $99,999 | 66 (85.7%) | 11 (14.3%) |
| $100,000 and over | 210 (78.6%) | 57 (21.3%) |
Public vs Private Health Insurance Coverage by Age in Harrah
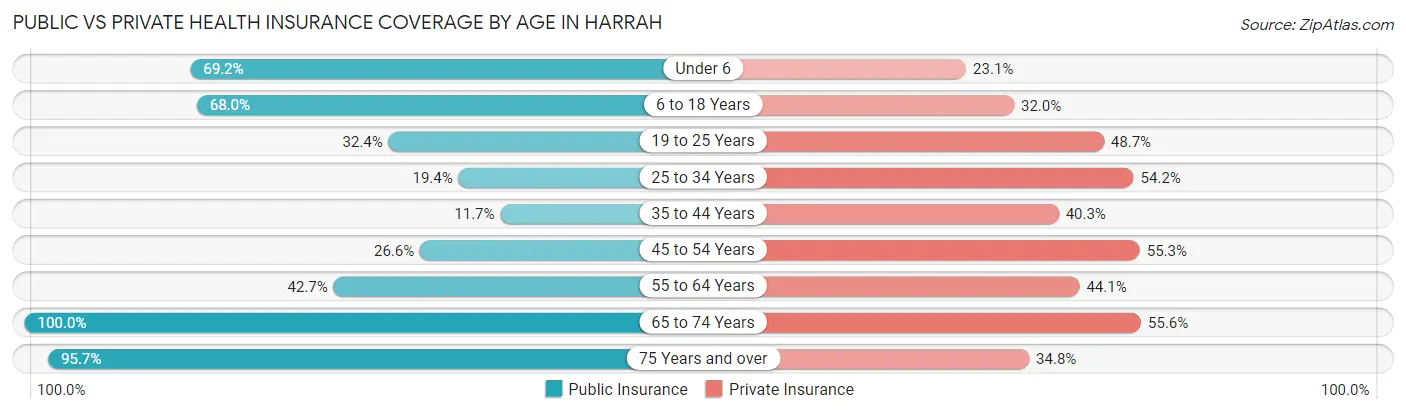
| Age Bracket | Public Insurance | Private Insurance |
| Under 6 | 18 (69.2%) | 6 (23.1%) |
| 6 to 18 Years | 100 (68.0%) | 47 (32.0%) |
| 19 to 25 Years | 24 (32.4%) | 36 (48.6%) |
| 25 to 34 Years | 14 (19.4%) | 39 (54.2%) |
| 35 to 44 Years | 9 (11.7%) | 31 (40.3%) |
| 45 to 54 Years | 25 (26.6%) | 52 (55.3%) |
| 55 to 64 Years | 29 (42.6%) | 30 (44.1%) |
| 65 to 74 Years | 36 (100.0%) | 20 (55.6%) |
| 75 Years and over | 44 (95.7%) | 16 (34.8%) |
| Total | 299 (46.7%) | 277 (43.3%) |
Disability Status by Sex by Age in Harrah
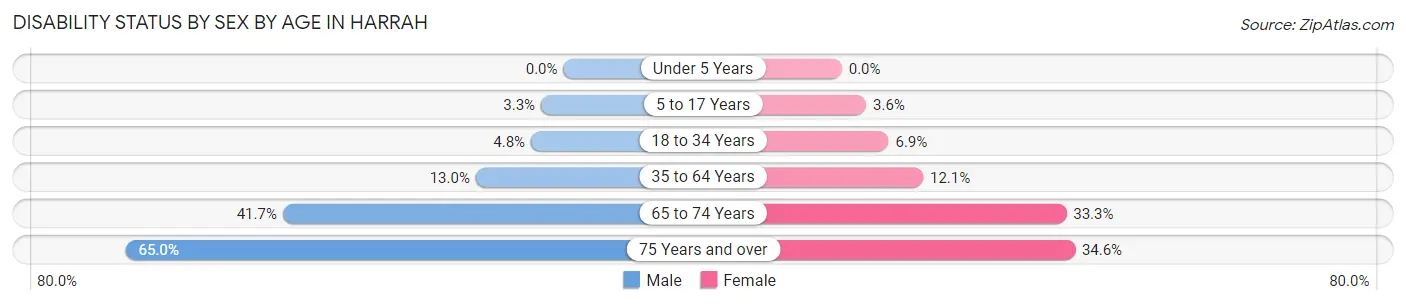
| Age Bracket | Male | Female |
| Under 5 Years | 0 (0.0%) | 0 (0.0%) |
| 5 to 17 Years | 2 (3.3%) | 3 (3.6%) |
| 18 to 34 Years | 4 (4.8%) | 5 (6.9%) |
| 35 to 64 Years | 16 (13.0%) | 14 (12.1%) |
| 65 to 74 Years | 5 (41.7%) | 8 (33.3%) |
| 75 Years and over | 13 (65.0%) | 9 (34.6%) |
Disability Class by Sex by Age in Harrah
Disability Class: Hearing Difficulty
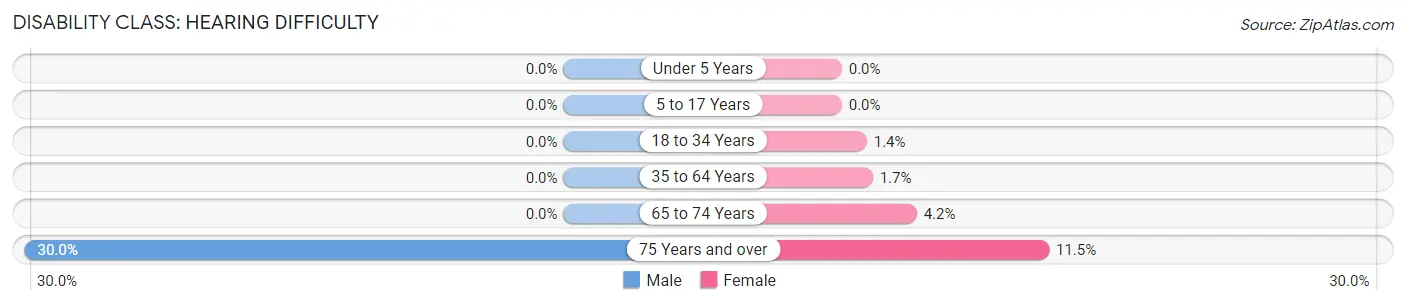
| Age Bracket | Male | Female |
| Under 5 Years | 0 (0.0%) | 0 (0.0%) |
| 5 to 17 Years | 0 (0.0%) | 0 (0.0%) |
| 18 to 34 Years | 0 (0.0%) | 1 (1.4%) |
| 35 to 64 Years | 0 (0.0%) | 2 (1.7%) |
| 65 to 74 Years | 0 (0.0%) | 1 (4.2%) |
| 75 Years and over | 6 (30.0%) | 3 (11.5%) |
Disability Class: Vision Difficulty
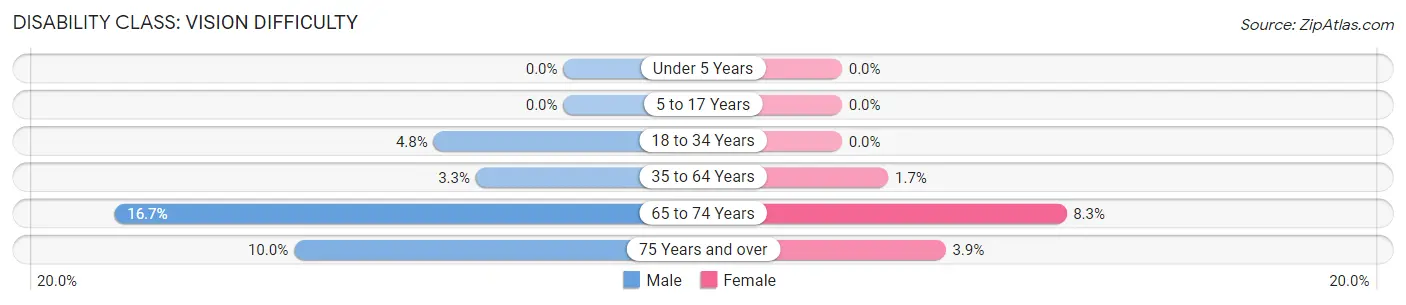
| Age Bracket | Male | Female |
| Under 5 Years | 0 (0.0%) | 0 (0.0%) |
| 5 to 17 Years | 0 (0.0%) | 0 (0.0%) |
| 18 to 34 Years | 4 (4.8%) | 0 (0.0%) |
| 35 to 64 Years | 4 (3.3%) | 2 (1.7%) |
| 65 to 74 Years | 2 (16.7%) | 2 (8.3%) |
| 75 Years and over | 2 (10.0%) | 1 (3.8%) |
Disability Class: Cognitive Difficulty
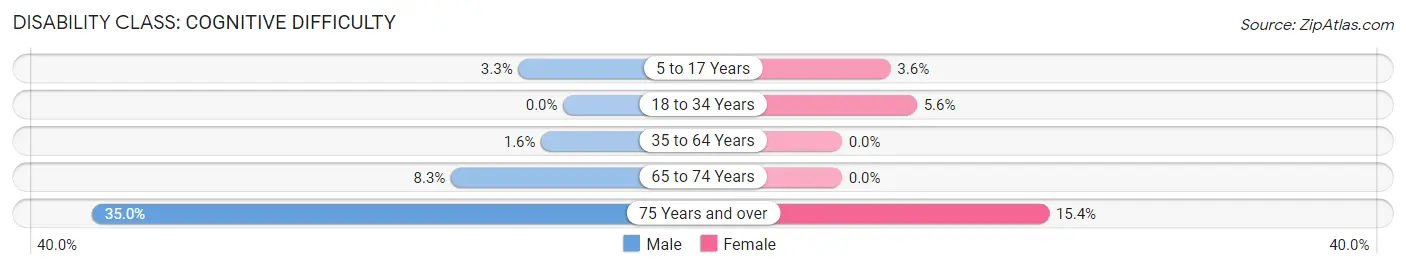
| Age Bracket | Male | Female |
| 5 to 17 Years | 2 (3.3%) | 3 (3.6%) |
| 18 to 34 Years | 0 (0.0%) | 4 (5.6%) |
| 35 to 64 Years | 2 (1.6%) | 0 (0.0%) |
| 65 to 74 Years | 1 (8.3%) | 0 (0.0%) |
| 75 Years and over | 7 (35.0%) | 4 (15.4%) |
Disability Class: Ambulatory Difficulty
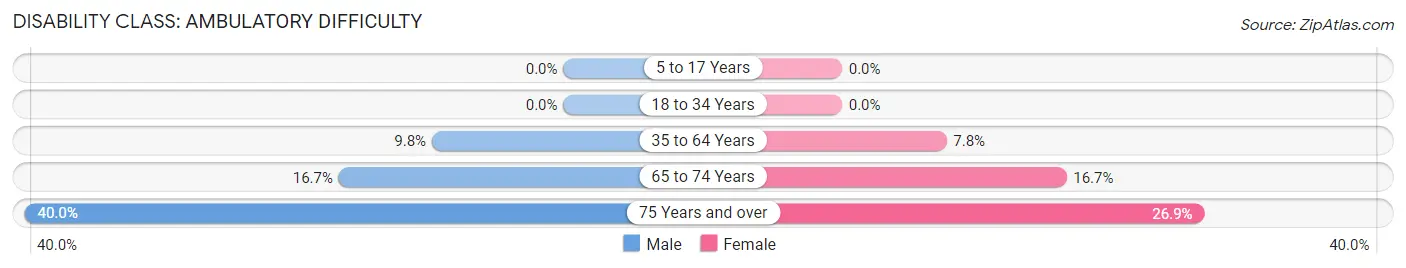
| Age Bracket | Male | Female |
| 5 to 17 Years | 0 (0.0%) | 0 (0.0%) |
| 18 to 34 Years | 0 (0.0%) | 0 (0.0%) |
| 35 to 64 Years | 12 (9.8%) | 9 (7.8%) |
| 65 to 74 Years | 2 (16.7%) | 4 (16.7%) |
| 75 Years and over | 8 (40.0%) | 7 (26.9%) |
Disability Class: Self-Care Difficulty
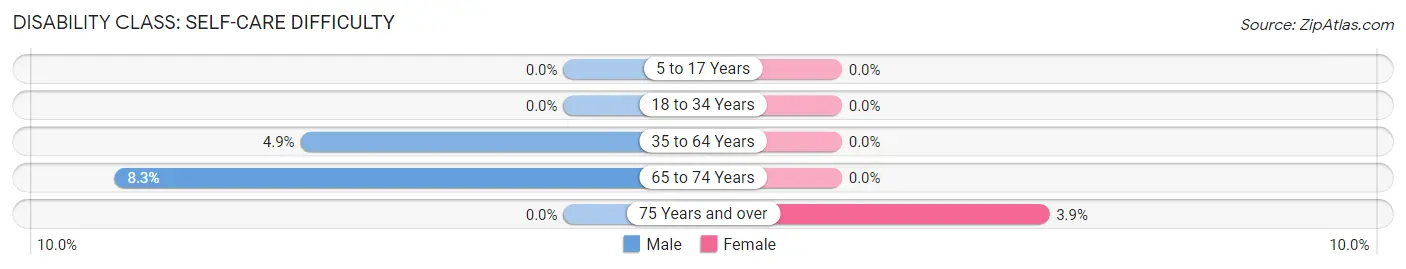
| Age Bracket | Male | Female |
| 5 to 17 Years | 0 (0.0%) | 0 (0.0%) |
| 18 to 34 Years | 0 (0.0%) | 0 (0.0%) |
| 35 to 64 Years | 6 (4.9%) | 0 (0.0%) |
| 65 to 74 Years | 1 (8.3%) | 0 (0.0%) |
| 75 Years and over | 0 (0.0%) | 1 (3.8%) |
Technology Access in Harrah
Computing Device Access in Harrah
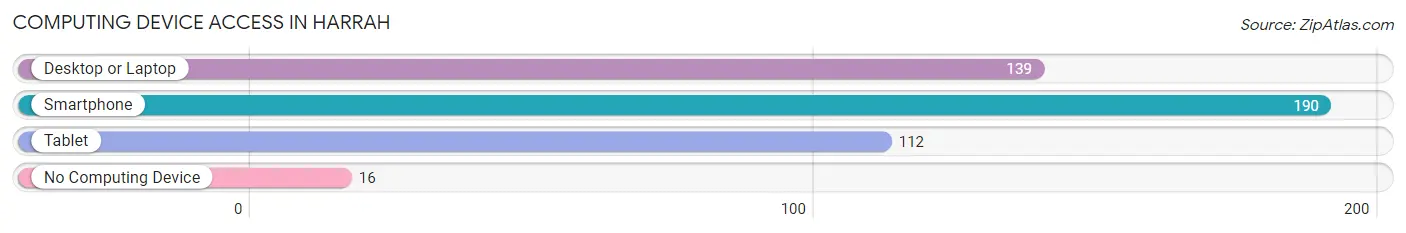
| Device Type | # Households | % Households |
| Desktop or Laptop | 139 | 66.2% |
| Smartphone | 190 | 90.5% |
| Tablet | 112 | 53.3% |
| No Computing Device | 16 | 7.6% |
| Total | 210 | 100.0% |
Internet Access in Harrah
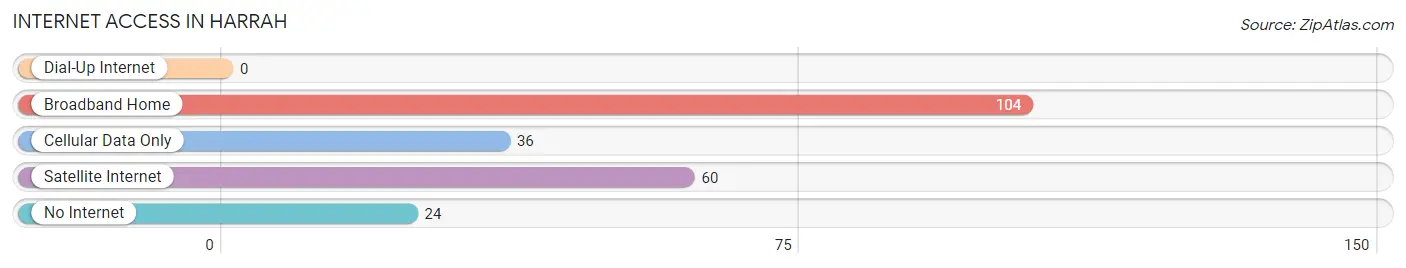
| Internet Type | # Households | % Households |
| Dial-Up Internet | 0 | 0.0% |
| Broadband Home | 104 | 49.5% |
| Cellular Data Only | 36 | 17.1% |
| Satellite Internet | 60 | 28.6% |
| No Internet | 24 | 11.4% |
| Total | 210 | 100.0% |
Harrah Summary
Harrah, Washington is a small town located in the Yakima Valley of Washington State. It is situated in the foothills of the Cascade Mountains, about 25 miles east of Yakima. The town was founded in 1891 and has a population of approximately 1,500 people.
Harrah is a rural community with a strong agricultural base. The town is surrounded by orchards, vineyards, and farms. The main crops grown in the area are apples, cherries, peaches, pears, and grapes. The town is also home to several wineries and breweries.
The economy of Harrah is largely based on agriculture and tourism. The town is home to several small businesses, including restaurants, shops, and a few small manufacturing companies. The town also has a few small hotels and bed and breakfasts.
The geography of Harrah is characterized by rolling hills and valleys. The town is located in the Yakima Valley, which is known for its fertile soil and mild climate. The town is surrounded by mountains, including the Cascade Range to the west and the Blue Mountains to the east.
The climate in Harrah is generally mild and dry. Summers are warm and dry, with temperatures reaching into the 90s during the day. Winters are cold and wet, with temperatures dropping into the 20s at night.
The population of Harrah is approximately 1,500 people. The town is predominantly white, with a small Hispanic population. The median age of the population is 44. The median household income is $45,000.
Harrah is served by the Yakima Valley School District. The town has one elementary school, one middle school, and one high school. The town also has a library and a community center.
Harrah is a small town with a strong sense of community. The town is home to several churches, including the First Baptist Church, the United Methodist Church, and the Church of Jesus Christ of Latter-day Saints. The town also has a volunteer fire department and a volunteer ambulance service.
Harrah is a great place to live and work. The town has a strong agricultural base, a mild climate, and a friendly, welcoming atmosphere. The town is a great place to raise a family and enjoy the outdoors.
Common Questions
What is Per Capita Income in Harrah?
Per Capita income in Harrah is $28,174.
What is the Median Family Income in Harrah?
Median Family Income in Harrah is $65,938.
What is the Median Household income in Harrah?
Median Household Income in Harrah is $68,333.
What is Income or Wage Gap in Harrah?
Income or Wage Gap in Harrah is 24.3%.
Women in Harrah earn 75.7 cents for every dollar earned by a man.
What is Inequality or Gini Index in Harrah?
Inequality or Gini Index in Harrah is 0.38.
What is the Total Population of Harrah?
Total Population of Harrah is 640.
What is the Total Male Population of Harrah?
Total Male Population of Harrah is 306.
What is the Total Female Population of Harrah?
Total Female Population of Harrah is 334.
What is the Ratio of Males per 100 Females in Harrah?
There are 91.62 Males per 100 Females in Harrah.
What is the Ratio of Females per 100 Males in Harrah?
There are 109.15 Females per 100 Males in Harrah.
What is the Median Population Age in Harrah?
Median Population Age in Harrah is 35.2 Years.
What is the Average Family Size in Harrah
Average Family Size in Harrah is 3.4 People.
What is the Average Household Size in Harrah
Average Household Size in Harrah is 3.0 People.
How Large is the Labor Force in Harrah?
There are 346 People in the Labor Forcein in Harrah.
What is the Percentage of People in the Labor Force in Harrah?
67.7% of People are in the Labor Force in Harrah.
What is the Unemployment Rate in Harrah?
Unemployment Rate in Harrah is 11.6%.