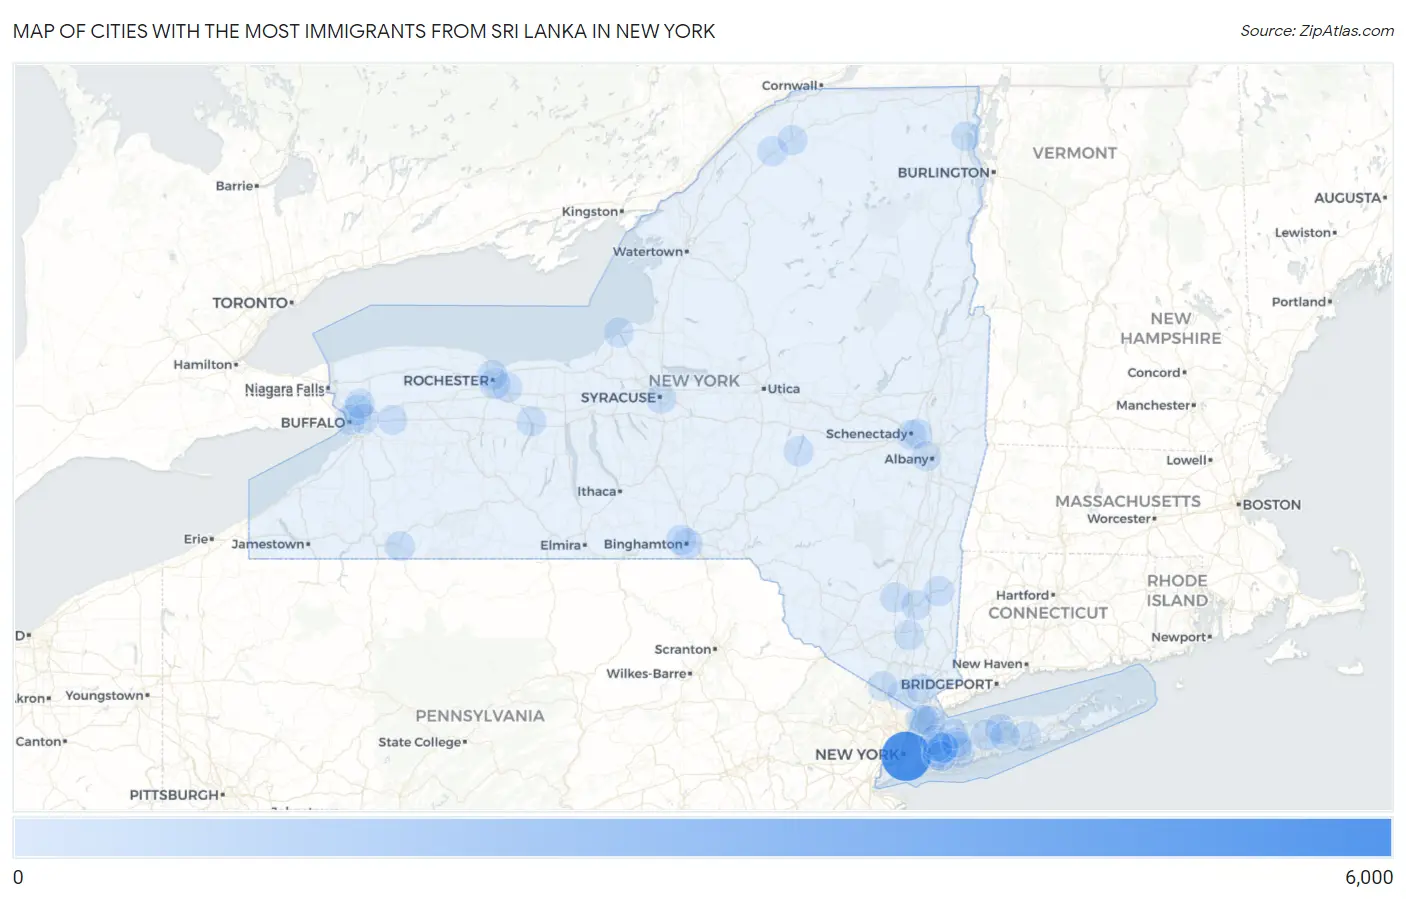
Cities with the Most Immigrants from Sri Lanka in New York
RELATED REPORTS & OPTIONS
Sri Lanka
New York
Compare Cities
Map of Cities with the Most Immigrants from Sri Lanka in New York
0
6,000

Cities with the Most Immigrants from Sri Lanka in New York
| City | Sri Lanka | vs State | vs National | |
| 1. | New York | 5,344 | 7,915(67.52%)#1 | 56,619(9.44%)#1 |
| 2. | Commack | 251 | 7,915(3.17%)#2 | 56,619(0.44%)#24 |
| 3. | Brighton | 181 | 7,915(2.29%)#3 | 56,619(0.32%)#35 |
| 4. | New Rochelle | 155 | 7,915(1.96%)#4 | 56,619(0.27%)#44 |
| 5. | Binghamton | 120 | 7,915(1.52%)#5 | 56,619(0.21%)#69 |
| 6. | Johnson City | 80 | 7,915(1.01%)#6 | 56,619(0.14%)#134 |
| 7. | Eggertsville | 67 | 7,915(0.85%)#7 | 56,619(0.12%)#165 |
| 8. | Garden City Park | 62 | 7,915(0.78%)#8 | 56,619(0.11%)#190 |
| 9. | Levittown | 57 | 7,915(0.72%)#9 | 56,619(0.10%)#208 |
| 10. | Herricks | 55 | 7,915(0.69%)#10 | 56,619(0.10%)#218 |
| 11. | Rochester | 48 | 7,915(0.61%)#11 | 56,619(0.08%)#245 |
| 12. | Elmont | 43 | 7,915(0.54%)#12 | 56,619(0.08%)#288 |
| 13. | Buffalo | 38 | 7,915(0.48%)#13 | 56,619(0.07%)#316 |
| 14. | Canton | 38 | 7,915(0.48%)#14 | 56,619(0.07%)#322 |
| 15. | Greenville Cdp Westchester County | 37 | 7,915(0.47%)#15 | 56,619(0.07%)#325 |
| 16. | Syracuse | 36 | 7,915(0.45%)#16 | 56,619(0.06%)#328 |
| 17. | Cheektowaga | 34 | 7,915(0.43%)#17 | 56,619(0.06%)#344 |
| 18. | Floral Park | 34 | 7,915(0.43%)#18 | 56,619(0.06%)#356 |
| 19. | Yonkers | 32 | 7,915(0.40%)#19 | 56,619(0.06%)#367 |
| 20. | Hicksville | 29 | 7,915(0.37%)#20 | 56,619(0.05%)#400 |
| 21. | Schenectady | 28 | 7,915(0.35%)#21 | 56,619(0.05%)#415 |
| 22. | Great Neck | 28 | 7,915(0.35%)#22 | 56,619(0.05%)#423 |
| 23. | Williston Park | 25 | 7,915(0.32%)#23 | 56,619(0.04%)#456 |
| 24. | Niskayuna | 23 | 7,915(0.29%)#24 | 56,619(0.04%)#469 |
| 25. | Franklin Square | 18 | 7,915(0.23%)#25 | 56,619(0.03%)#536 |
| 26. | Plattsburgh | 17 | 7,915(0.21%)#26 | 56,619(0.03%)#560 |
| 27. | Oswego | 16 | 7,915(0.20%)#27 | 56,619(0.03%)#579 |
| 28. | St James | 15 | 7,915(0.19%)#28 | 56,619(0.03%)#600 |
| 29. | Nanuet | 14 | 7,915(0.18%)#29 | 56,619(0.02%)#621 |
| 30. | Upper Brookville | 14 | 7,915(0.18%)#30 | 56,619(0.02%)#633 |
| 31. | Potsdam | 12 | 7,915(0.15%)#31 | 56,619(0.02%)#667 |
| 32. | Briarcliff Manor | 12 | 7,915(0.15%)#32 | 56,619(0.02%)#669 |
| 33. | Jericho | 11 | 7,915(0.14%)#33 | 56,619(0.02%)#689 |
| 34. | Albany | 10 | 7,915(0.13%)#34 | 56,619(0.02%)#705 |
| 35. | Chelsea Cove | 9 | 7,915(0.11%)#35 | 56,619(0.02%)#748 |
| 36. | University At Buffalo | 8 | 7,915(0.10%)#36 | 56,619(0.01%)#770 |
| 37. | New Paltz | 6 | 7,915(0.08%)#37 | 56,619(0.01%)#796 |
| 38. | Bronxville | 6 | 7,915(0.08%)#38 | 56,619(0.01%)#797 |
| 39. | Yaphank | 6 | 7,915(0.08%)#39 | 56,619(0.01%)#799 |
| 40. | Vassar College | 6 | 7,915(0.08%)#40 | 56,619(0.01%)#801 |
| 41. | Alden | 6 | 7,915(0.08%)#41 | 56,619(0.01%)#802 |
| 42. | Cooperstown | 3 | 7,915(0.04%)#42 | 56,619(0.01%)#832 |
| 43. | Olean | 2 | 7,915(0.03%)#43 | 56,619(0.00%)#842 |
| 44. | Beacon | 2 | 7,915(0.03%)#44 | 56,619(0.00%)#843 |
| 45. | Canandaigua | 2 | 7,915(0.03%)#45 | 56,619(0.00%)#844 |
| 46. | Arlington | 2 | 7,915(0.03%)#46 | 56,619(0.00%)#847 |
| 47. | Lake Ronkonkoma | 1 | 7,915(0.01%)#47 | 56,619(0.00%)#867 |
| 48. | East Rochester | 1 | 7,915(0.01%)#48 | 56,619(0.00%)#872 |
| 49. | Sloatsburg | 1 | 7,915(0.01%)#49 | 56,619(0.00%)#875 |
| 50. | Lake Success | 1 | 7,915(0.01%)#50 | 56,619(0.00%)#876 |
| 51. | Millbrook | 1 | 7,915(0.01%)#51 | 56,619(0.00%)#877 |
Common Questions
What are the Top 10 Cities with the Most Immigrants from Sri Lanka in New York?
Top 10 Cities with the Most Immigrants from Sri Lanka in New York are:
#1
5,344
#2
251
#3
181
#4
155
#5
120
#6
80
#7
67
#8
62
#9
57
#10
55
What city has the Most Immigrants from Sri Lanka in New York?
New York has the Most Immigrants from Sri Lanka in New York with 5,344.
What is the Total Immigrants from Sri Lanka in the State of New York?
Total Immigrants from Sri Lanka in New York is 7,915.
What is the Total Immigrants from Sri Lanka in the United States?
Total Immigrants from Sri Lanka in the United States is 56,619.