Cities with the Most Immigrants from Northern Africa in Massachusetts
RELATED REPORTS & OPTIONS
Northern Africa
Massachusetts
Compare Cities
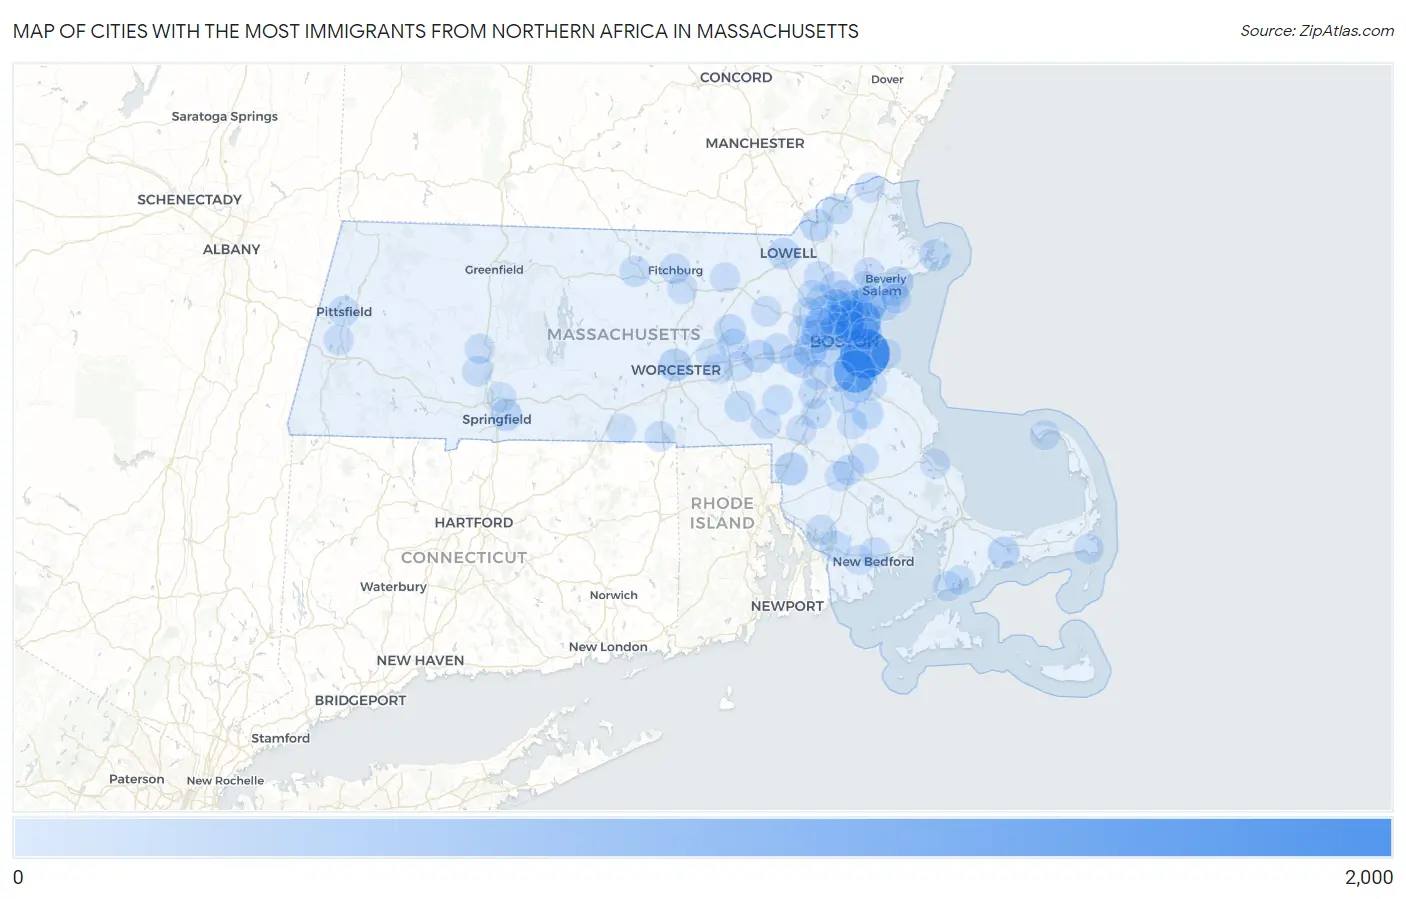
Map of Cities with the Most Immigrants from Northern Africa in Massachusetts
0
2,000
Cities with the Most Immigrants from Northern Africa in Massachusetts
| City | Northern Africa | vs State | vs National | |
| 1. | Boston | 1,961 | 17,406(11.27%)#1 | 421,832(0.46%)#14 |
| 2. | Quincy | 1,237 | 17,406(7.11%)#2 | 421,832(0.29%)#31 |
| 3. | Revere | 1,180 | 17,406(6.78%)#3 | 421,832(0.28%)#32 |
| 4. | Malden | 673 | 17,406(3.87%)#4 | 421,832(0.16%)#77 |
| 5. | Lynn | 596 | 17,406(3.42%)#5 | 421,832(0.14%)#93 |
| 6. | Everett | 587 | 17,406(3.37%)#6 | 421,832(0.14%)#95 |
| 7. | Melrose | 541 | 17,406(3.11%)#7 | 421,832(0.13%)#107 |
| 8. | Cambridge | 341 | 17,406(1.96%)#8 | 421,832(0.08%)#195 |
| 9. | Watertown Town | 294 | 17,406(1.69%)#9 | 421,832(0.07%)#236 |
| 10. | Newton | 287 | 17,406(1.65%)#10 | 421,832(0.07%)#243 |
| 11. | Attleboro | 286 | 17,406(1.64%)#11 | 421,832(0.07%)#246 |
| 12. | Worcester | 283 | 17,406(1.63%)#12 | 421,832(0.07%)#251 |
| 13. | Saugus | 279 | 17,406(1.60%)#13 | 421,832(0.07%)#254 |
| 14. | Chelsea | 247 | 17,406(1.42%)#14 | 421,832(0.06%)#284 |
| 15. | Methuen Town | 235 | 17,406(1.35%)#15 | 421,832(0.06%)#298 |
| 16. | Brookline | 233 | 17,406(1.34%)#16 | 421,832(0.06%)#302 |
| 17. | Framingham | 229 | 17,406(1.32%)#17 | 421,832(0.05%)#305 |
| 18. | North Attleborough | 211 | 17,406(1.21%)#18 | 421,832(0.05%)#346 |
| 19. | Wakefield | 208 | 17,406(1.19%)#19 | 421,832(0.05%)#354 |
| 20. | Winthrop Town | 201 | 17,406(1.15%)#20 | 421,832(0.05%)#365 |
| 21. | Barnstable Town | 197 | 17,406(1.13%)#21 | 421,832(0.05%)#372 |
| 22. | Beverly | 196 | 17,406(1.13%)#22 | 421,832(0.05%)#374 |
| 23. | Springfield | 190 | 17,406(1.09%)#23 | 421,832(0.05%)#390 |
| 24. | Gloucester | 173 | 17,406(0.99%)#24 | 421,832(0.04%)#431 |
| 25. | Stoneham | 165 | 17,406(0.95%)#25 | 421,832(0.04%)#446 |
| 26. | Hudson | 163 | 17,406(0.94%)#26 | 421,832(0.04%)#450 |
| 27. | Lowell | 162 | 17,406(0.93%)#27 | 421,832(0.04%)#452 |
| 28. | Woburn | 134 | 17,406(0.77%)#28 | 421,832(0.03%)#544 |
| 29. | Somerville | 121 | 17,406(0.70%)#29 | 421,832(0.03%)#594 |
| 30. | Abington | 118 | 17,406(0.68%)#30 | 421,832(0.03%)#608 |
| 31. | Randolph Town | 113 | 17,406(0.65%)#31 | 421,832(0.03%)#630 |
| 32. | Medford | 109 | 17,406(0.63%)#32 | 421,832(0.03%)#649 |
| 33. | Weymouth Town | 109 | 17,406(0.63%)#33 | 421,832(0.03%)#650 |
| 34. | Fall River | 105 | 17,406(0.60%)#34 | 421,832(0.02%)#667 |
| 35. | Swampscott | 102 | 17,406(0.59%)#35 | 421,832(0.02%)#687 |
| 36. | Haverhill | 97 | 17,406(0.56%)#36 | 421,832(0.02%)#709 |
| 37. | Gardner | 96 | 17,406(0.55%)#37 | 421,832(0.02%)#718 |
| 38. | Braintree Town | 91 | 17,406(0.52%)#38 | 421,832(0.02%)#748 |
| 39. | Milford | 89 | 17,406(0.51%)#39 | 421,832(0.02%)#760 |
| 40. | Belmont | 77 | 17,406(0.44%)#40 | 421,832(0.02%)#831 |
| 41. | Winchester | 77 | 17,406(0.44%)#41 | 421,832(0.02%)#833 |
| 42. | Needham | 76 | 17,406(0.44%)#42 | 421,832(0.02%)#843 |
| 43. | Lexington | 73 | 17,406(0.42%)#43 | 421,832(0.02%)#870 |
| 44. | Marlborough | 69 | 17,406(0.40%)#44 | 421,832(0.02%)#904 |
| 45. | Waltham | 67 | 17,406(0.38%)#45 | 421,832(0.02%)#929 |
| 46. | Millis Clicquot | 63 | 17,406(0.36%)#46 | 421,832(0.01%)#977 |
| 47. | Easthampton Town | 62 | 17,406(0.36%)#47 | 421,832(0.01%)#984 |
| 48. | Sharon | 62 | 17,406(0.36%)#48 | 421,832(0.01%)#989 |
| 49. | Wellesley | 61 | 17,406(0.35%)#49 | 421,832(0.01%)#995 |
| 50. | Raynham Center | 59 | 17,406(0.34%)#50 | 421,832(0.01%)#1,020 |
| 51. | New Bedford | 58 | 17,406(0.33%)#51 | 421,832(0.01%)#1,023 |
| 52. | Fitchburg | 54 | 17,406(0.31%)#52 | 421,832(0.01%)#1,072 |
| 53. | Somerset | 53 | 17,406(0.30%)#53 | 421,832(0.01%)#1,091 |
| 54. | Webster | 53 | 17,406(0.30%)#54 | 421,832(0.01%)#1,092 |
| 55. | Peabody | 50 | 17,406(0.29%)#55 | 421,832(0.01%)#1,120 |
| 56. | Pittsfield | 49 | 17,406(0.28%)#56 | 421,832(0.01%)#1,142 |
| 57. | Norwood | 49 | 17,406(0.28%)#57 | 421,832(0.01%)#1,144 |
| 58. | West Concord | 45 | 17,406(0.26%)#58 | 421,832(0.01%)#1,211 |
| 59. | Franklin Town | 42 | 17,406(0.24%)#59 | 421,832(0.01%)#1,261 |
| 60. | Foxborough | 41 | 17,406(0.24%)#60 | 421,832(0.01%)#1,290 |
| 61. | Lenox | 41 | 17,406(0.24%)#61 | 421,832(0.01%)#1,291 |
| 62. | Leominster | 40 | 17,406(0.23%)#62 | 421,832(0.01%)#1,294 |
| 63. | Falmouth | 36 | 17,406(0.21%)#63 | 421,832(0.01%)#1,388 |
| 64. | Amesbury Town | 35 | 17,406(0.20%)#64 | 421,832(0.01%)#1,404 |
| 65. | Cochituate | 34 | 17,406(0.20%)#65 | 421,832(0.01%)#1,439 |
| 66. | Brockton | 32 | 17,406(0.18%)#66 | 421,832(0.01%)#1,468 |
| 67. | Wilmington | 32 | 17,406(0.18%)#67 | 421,832(0.01%)#1,474 |
| 68. | Burlington | 31 | 17,406(0.18%)#68 | 421,832(0.01%)#1,494 |
| 69. | Salem | 30 | 17,406(0.17%)#69 | 421,832(0.01%)#1,513 |
| 70. | Arlington | 29 | 17,406(0.17%)#70 | 421,832(0.01%)#1,539 |
| 71. | Milton | 29 | 17,406(0.17%)#71 | 421,832(0.01%)#1,543 |
| 72. | Northampton | 28 | 17,406(0.16%)#72 | 421,832(0.01%)#1,573 |
| 73. | Ayer | 28 | 17,406(0.16%)#73 | 421,832(0.01%)#1,590 |
| 74. | Taunton | 25 | 17,406(0.14%)#74 | 421,832(0.01%)#1,651 |
| 75. | Danvers | 23 | 17,406(0.13%)#75 | 421,832(0.01%)#1,716 |
| 76. | Dedham | 22 | 17,406(0.13%)#76 | 421,832(0.01%)#1,755 |
| 77. | Provincetown | 22 | 17,406(0.13%)#77 | 421,832(0.01%)#1,767 |
| 78. | Smith Mills | 21 | 17,406(0.12%)#78 | 421,832(0.00%)#1,797 |
| 79. | West Chatham | 20 | 17,406(0.11%)#79 | 421,832(0.00%)#1,837 |
| 80. | Chicopee | 15 | 17,406(0.09%)#80 | 421,832(0.00%)#2,048 |
| 81. | Southbridge Town | 14 | 17,406(0.08%)#81 | 421,832(0.00%)#2,119 |
| 82. | Bridgewater Town | 13 | 17,406(0.07%)#82 | 421,832(0.00%)#2,157 |
| 83. | Marblehead | 13 | 17,406(0.07%)#83 | 421,832(0.00%)#2,162 |
| 84. | Plymouth | 13 | 17,406(0.07%)#84 | 421,832(0.00%)#2,183 |
| 85. | Cordaville | 13 | 17,406(0.07%)#85 | 421,832(0.00%)#2,197 |
| 86. | Reading | 12 | 17,406(0.07%)#86 | 421,832(0.00%)#2,223 |
| 87. | East Falmouth | 12 | 17,406(0.07%)#87 | 421,832(0.00%)#2,246 |
| 88. | Westborough | 11 | 17,406(0.06%)#88 | 421,832(0.00%)#2,300 |
| 89. | Amherst | 10 | 17,406(0.06%)#89 | 421,832(0.00%)#2,326 |
| 90. | Hull | 10 | 17,406(0.06%)#90 | 421,832(0.00%)#2,345 |
| 91. | Northborough | 8 | 17,406(0.05%)#91 | 421,832(0.00%)#2,489 |
Common Questions
What are the Top 10 Cities with the Most Immigrants from Northern Africa in Massachusetts?
Top 10 Cities with the Most Immigrants from Northern Africa in Massachusetts are:
What city has the Most Immigrants from Northern Africa in Massachusetts?
Boston has the Most Immigrants from Northern Africa in Massachusetts with 1,961.
What is the Total Immigrants from Northern Africa in the State of Massachusetts?
Total Immigrants from Northern Africa in Massachusetts is 17,406.
What is the Total Immigrants from Northern Africa in the United States?
Total Immigrants from Northern Africa in the United States is 421,832.