Cities with the Most Immigrants from Northern Africa in Colorado
RELATED REPORTS & OPTIONS
Northern Africa
Colorado
Compare Cities
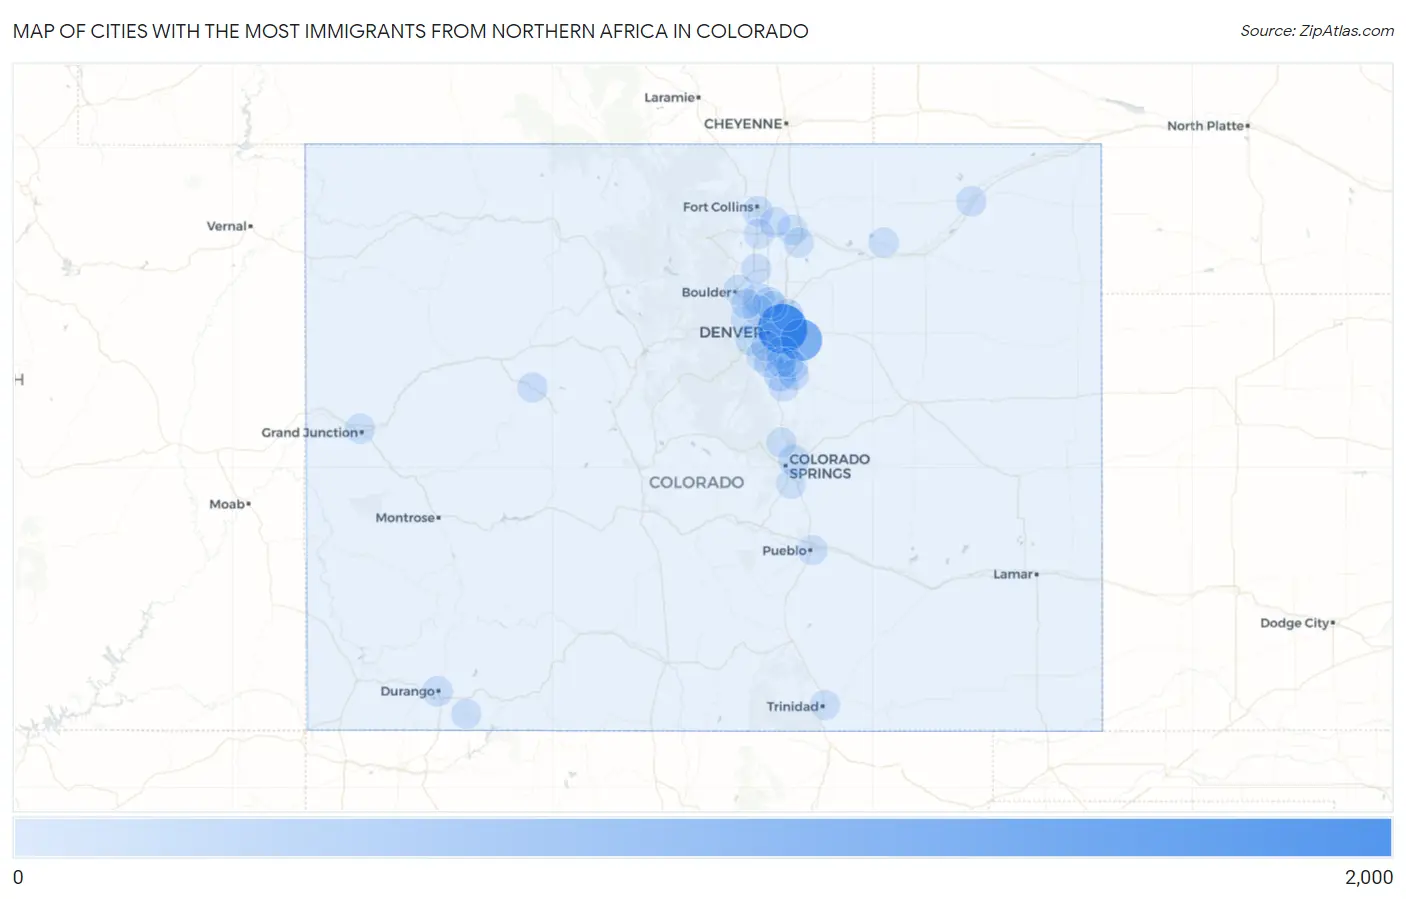
Map of Cities with the Most Immigrants from Northern Africa in Colorado
0
2,000
Cities with the Most Immigrants from Northern Africa in Colorado
| City | Northern Africa | vs State | vs National | |
| 1. | Denver | 1,801 | 5,883(30.61%)#1 | 421,832(0.43%)#17 |
| 2. | Aurora | 1,075 | 5,883(18.27%)#2 | 421,832(0.25%)#37 |
| 3. | Four Square Mile | 973 | 5,883(16.54%)#3 | 421,832(0.23%)#42 |
| 4. | Castle Pines | 209 | 5,883(3.55%)#4 | 421,832(0.05%)#351 |
| 5. | Centennial | 177 | 5,883(3.01%)#5 | 421,832(0.04%)#420 |
| 6. | Commerce City | 149 | 5,883(2.53%)#6 | 421,832(0.04%)#493 |
| 7. | Lakewood | 132 | 5,883(2.24%)#7 | 421,832(0.03%)#548 |
| 8. | Broomfield | 118 | 5,883(2.01%)#8 | 421,832(0.03%)#603 |
| 9. | Colorado Springs | 105 | 5,883(1.78%)#9 | 421,832(0.02%)#665 |
| 10. | Parker | 79 | 5,883(1.34%)#10 | 421,832(0.02%)#813 |
| 11. | Northglenn | 70 | 5,883(1.19%)#11 | 421,832(0.02%)#895 |
| 12. | Arvada | 59 | 5,883(1.00%)#12 | 421,832(0.01%)#1,009 |
| 13. | Thornton | 46 | 5,883(0.78%)#13 | 421,832(0.01%)#1,183 |
| 14. | Westminster | 42 | 5,883(0.71%)#14 | 421,832(0.01%)#1,257 |
| 15. | Boulder | 42 | 5,883(0.71%)#15 | 421,832(0.01%)#1,258 |
| 16. | Castle Rock | 38 | 5,883(0.65%)#16 | 421,832(0.01%)#1,328 |
| 17. | Littleton | 36 | 5,883(0.61%)#17 | 421,832(0.01%)#1,368 |
| 18. | Longmont | 33 | 5,883(0.56%)#18 | 421,832(0.01%)#1,445 |
| 19. | Fort Collins | 30 | 5,883(0.51%)#19 | 421,832(0.01%)#1,509 |
| 20. | The Pinery | 30 | 5,883(0.51%)#20 | 421,832(0.01%)#1,526 |
| 21. | Durango | 29 | 5,883(0.49%)#21 | 421,832(0.01%)#1,550 |
| 22. | Sterling | 29 | 5,883(0.49%)#22 | 421,832(0.01%)#1,551 |
| 23. | Greeley | 27 | 5,883(0.46%)#23 | 421,832(0.01%)#1,595 |
| 24. | Windsor | 25 | 5,883(0.42%)#24 | 421,832(0.01%)#1,655 |
| 25. | Highlands Ranch | 20 | 5,883(0.34%)#25 | 421,832(0.00%)#1,803 |
| 26. | Englewood | 19 | 5,883(0.32%)#26 | 421,832(0.00%)#1,849 |
| 27. | Superior | 16 | 5,883(0.27%)#27 | 421,832(0.00%)#2,006 |
| 28. | Basalt | 16 | 5,883(0.27%)#28 | 421,832(0.00%)#2,031 |
| 29. | Loveland | 15 | 5,883(0.25%)#29 | 421,832(0.00%)#2,045 |
| 30. | Grand Junction | 13 | 5,883(0.22%)#30 | 421,832(0.00%)#2,148 |
| 31. | Stonegate | 13 | 5,883(0.22%)#31 | 421,832(0.00%)#2,176 |
| 32. | Pueblo | 10 | 5,883(0.17%)#32 | 421,832(0.00%)#2,314 |
| 33. | Fort Carson | 9 | 5,883(0.15%)#33 | 421,832(0.00%)#2,414 |
| 34. | Lone Tree | 9 | 5,883(0.15%)#34 | 421,832(0.00%)#2,419 |
| 35. | Air Force Academy | 9 | 5,883(0.15%)#35 | 421,832(0.00%)#2,427 |
| 36. | La Salle | 4 | 5,883(0.07%)#36 | 421,832(0.00%)#2,755 |
| 37. | Ignacio | 4 | 5,883(0.07%)#37 | 421,832(0.00%)#2,779 |
| 38. | Trinidad | 2 | 5,883(0.03%)#38 | 421,832(0.00%)#2,846 |
| 39. | Weldona | 2 | 5,883(0.03%)#39 | 421,832(0.00%)#2,884 |
Common Questions
What are the Top 10 Cities with the Most Immigrants from Northern Africa in Colorado?
Top 10 Cities with the Most Immigrants from Northern Africa in Colorado are:
#1
1,801
#2
1,075
#3
209
#4
177
#5
149
#6
132
#7
118
#8
105
#9
79
#10
70
What city has the Most Immigrants from Northern Africa in Colorado?
Denver has the Most Immigrants from Northern Africa in Colorado with 1,801.
What is the Total Immigrants from Northern Africa in the State of Colorado?
Total Immigrants from Northern Africa in Colorado is 5,883.
What is the Total Immigrants from Northern Africa in the United States?
Total Immigrants from Northern Africa in the United States is 421,832.