Cities with the Most Immigrants from Northern Africa in Pennsylvania
RELATED REPORTS & OPTIONS
Northern Africa
Pennsylvania
Compare Cities
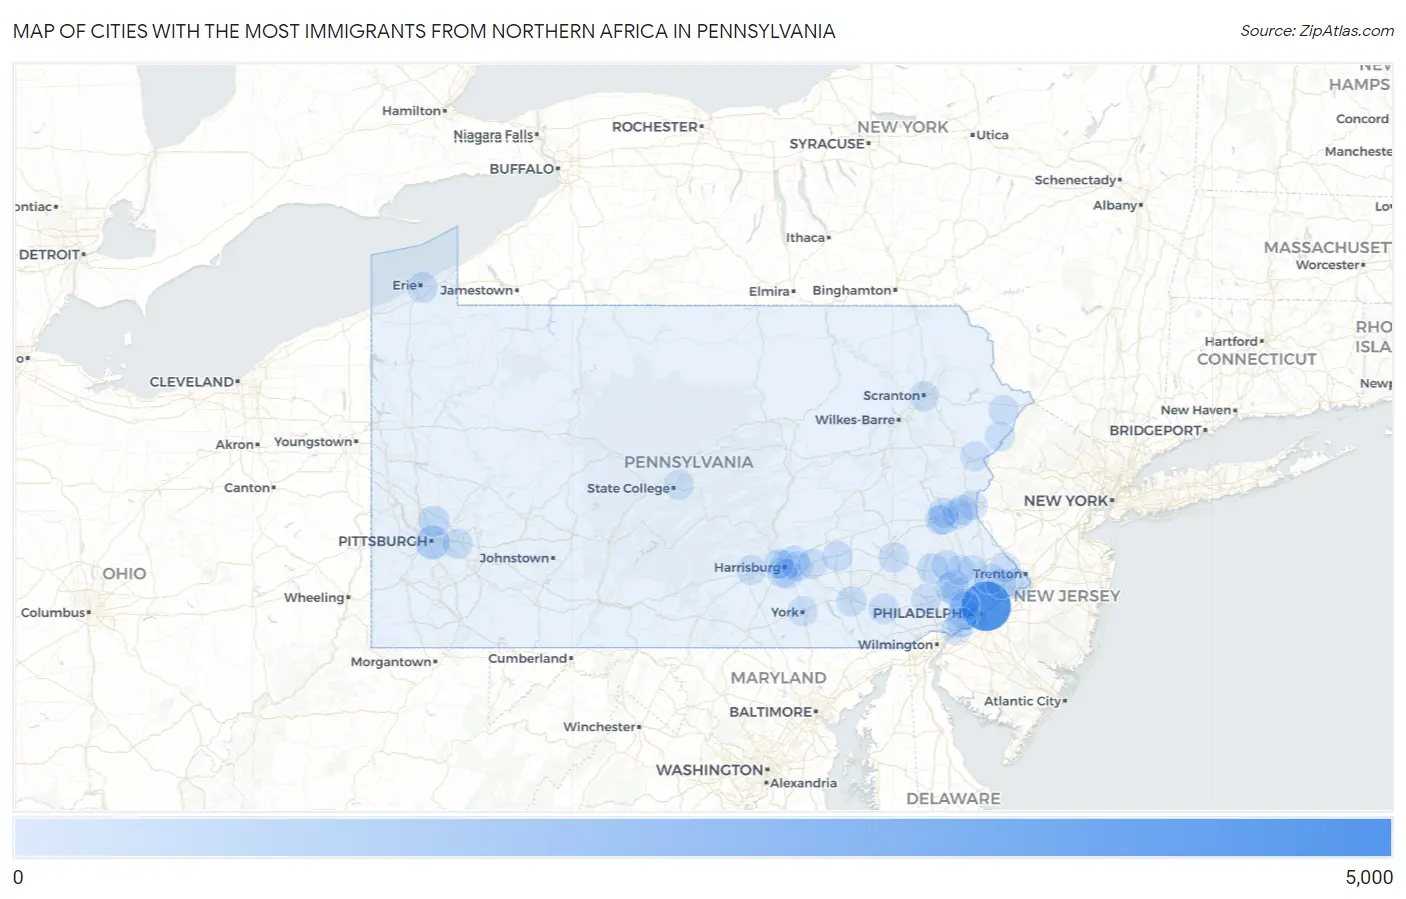
Map of Cities with the Most Immigrants from Northern Africa in Pennsylvania
0
5,000
Cities with the Most Immigrants from Northern Africa in Pennsylvania
| City | Northern Africa | vs State | vs National | |
| 1. | Philadelphia | 4,130 | 16,849(24.51%)#1 | 421,832(0.98%)#8 |
| 2. | Pittsburgh | 746 | 16,849(4.43%)#2 | 421,832(0.18%)#63 |
| 3. | Bridgeport Borough | 329 | 16,849(1.95%)#3 | 421,832(0.08%)#201 |
| 4. | Colonial Park | 250 | 16,849(1.48%)#4 | 421,832(0.06%)#281 |
| 5. | Lansdale Borough | 249 | 16,849(1.48%)#5 | 421,832(0.06%)#283 |
| 6. | Drexel Hill | 219 | 16,849(1.30%)#6 | 421,832(0.05%)#328 |
| 7. | Allison Park | 217 | 16,849(1.29%)#7 | 421,832(0.05%)#335 |
| 8. | Allentown | 200 | 16,849(1.19%)#8 | 421,832(0.05%)#366 |
| 9. | Sanatoga | 189 | 16,849(1.12%)#9 | 421,832(0.04%)#393 |
| 10. | Brentwood Borough | 152 | 16,849(0.90%)#10 | 421,832(0.04%)#484 |
| 11. | Bethlehem | 142 | 16,849(0.84%)#11 | 421,832(0.03%)#521 |
| 12. | Norristown Borough | 138 | 16,849(0.82%)#12 | 421,832(0.03%)#532 |
| 13. | Erie | 115 | 16,849(0.68%)#13 | 421,832(0.03%)#615 |
| 14. | Columbia Borough | 115 | 16,849(0.68%)#14 | 421,832(0.03%)#618 |
| 15. | Reading | 101 | 16,849(0.60%)#15 | 421,832(0.02%)#690 |
| 16. | Fullerton | 99 | 16,849(0.59%)#16 | 421,832(0.02%)#701 |
| 17. | Lebanon | 81 | 16,849(0.48%)#17 | 421,832(0.02%)#801 |
| 18. | Warminster Heights | 78 | 16,849(0.46%)#18 | 421,832(0.02%)#826 |
| 19. | Brookhaven Borough | 73 | 16,849(0.43%)#19 | 421,832(0.02%)#874 |
| 20. | Carlisle Borough | 71 | 16,849(0.42%)#20 | 421,832(0.02%)#891 |
| 21. | Trooper | 70 | 16,849(0.42%)#21 | 421,832(0.02%)#900 |
| 22. | Harrisburg | 68 | 16,849(0.40%)#22 | 421,832(0.02%)#914 |
| 23. | Chester | 67 | 16,849(0.40%)#23 | 421,832(0.02%)#931 |
| 24. | Gap | 64 | 16,849(0.38%)#24 | 421,832(0.02%)#969 |
| 25. | Wormleysburg Borough | 63 | 16,849(0.37%)#25 | 421,832(0.01%)#978 |
| 26. | Levittown | 61 | 16,849(0.36%)#26 | 421,832(0.01%)#992 |
| 27. | Trevose | 54 | 16,849(0.32%)#27 | 421,832(0.01%)#1,082 |
| 28. | Lower Allen | 49 | 16,849(0.29%)#28 | 421,832(0.01%)#1,153 |
| 29. | Shiremanstown Borough | 48 | 16,849(0.28%)#29 | 421,832(0.01%)#1,166 |
| 30. | Hatboro Borough | 47 | 16,849(0.28%)#30 | 421,832(0.01%)#1,179 |
| 31. | Ambridge Borough | 44 | 16,849(0.26%)#31 | 421,832(0.01%)#1,233 |
| 32. | Monroeville | 43 | 16,849(0.26%)#32 | 421,832(0.01%)#1,244 |
| 33. | King Of Prussia | 42 | 16,849(0.25%)#33 | 421,832(0.01%)#1,262 |
| 34. | Montgomeryville | 42 | 16,849(0.25%)#34 | 421,832(0.01%)#1,266 |
| 35. | Norwood Borough | 42 | 16,849(0.25%)#35 | 421,832(0.01%)#1,273 |
| 36. | Easton | 40 | 16,849(0.24%)#36 | 421,832(0.01%)#1,300 |
| 37. | Bryn Mawr | 38 | 16,849(0.23%)#37 | 421,832(0.01%)#1,346 |
| 38. | Swissvale Borough | 37 | 16,849(0.22%)#38 | 421,832(0.01%)#1,360 |
| 39. | Lancaster | 35 | 16,849(0.21%)#39 | 421,832(0.01%)#1,392 |
| 40. | State College Borough | 35 | 16,849(0.21%)#40 | 421,832(0.01%)#1,393 |
| 41. | Dover Borough | 35 | 16,849(0.21%)#41 | 421,832(0.01%)#1,410 |
| 42. | York | 34 | 16,849(0.20%)#42 | 421,832(0.01%)#1,418 |
| 43. | Kulpsville | 34 | 16,849(0.20%)#43 | 421,832(0.01%)#1,435 |
| 44. | Greencastle Borough | 34 | 16,849(0.20%)#44 | 421,832(0.01%)#1,443 |
| 45. | Folcroft Borough | 33 | 16,849(0.20%)#45 | 421,832(0.01%)#1,463 |
| 46. | Audubon | 32 | 16,849(0.19%)#46 | 421,832(0.01%)#1,479 |
| 47. | Hummelstown Borough | 32 | 16,849(0.19%)#47 | 421,832(0.01%)#1,482 |
| 48. | Sunrise Lake | 32 | 16,849(0.19%)#48 | 421,832(0.01%)#1,485 |
| 49. | Kingston Borough | 30 | 16,849(0.18%)#49 | 421,832(0.01%)#1,523 |
| 50. | Rutherford | 30 | 16,849(0.18%)#50 | 421,832(0.01%)#1,528 |
| 51. | Avalon Borough | 28 | 16,849(0.17%)#51 | 421,832(0.01%)#1,589 |
| 52. | Lemont | 28 | 16,849(0.17%)#52 | 421,832(0.01%)#1,592 |
| 53. | Crafton Borough | 27 | 16,849(0.16%)#53 | 421,832(0.01%)#1,616 |
| 54. | Spring Mount | 27 | 16,849(0.16%)#54 | 421,832(0.01%)#1,618 |
| 55. | Arlington Heights | 25 | 16,849(0.15%)#55 | 421,832(0.01%)#1,669 |
| 56. | Schlusser | 25 | 16,849(0.15%)#56 | 421,832(0.01%)#1,670 |
| 57. | Turtle Creek Borough | 25 | 16,849(0.15%)#57 | 421,832(0.01%)#1,673 |
| 58. | Phoenixville Borough | 23 | 16,849(0.14%)#58 | 421,832(0.01%)#1,722 |
| 59. | Catasauqua Borough | 23 | 16,849(0.14%)#59 | 421,832(0.01%)#1,734 |
| 60. | Morton Borough | 23 | 16,849(0.14%)#60 | 421,832(0.01%)#1,740 |
| 61. | Albion Borough | 23 | 16,849(0.14%)#61 | 421,832(0.01%)#1,743 |
| 62. | Villanova | 22 | 16,849(0.13%)#62 | 421,832(0.01%)#1,762 |
| 63. | Pitcairn Borough | 22 | 16,849(0.13%)#63 | 421,832(0.01%)#1,768 |
| 64. | New Market | 22 | 16,849(0.13%)#64 | 421,832(0.01%)#1,772 |
| 65. | Ardmore | 21 | 16,849(0.12%)#65 | 421,832(0.00%)#1,789 |
| 66. | Folsom | 21 | 16,849(0.12%)#66 | 421,832(0.00%)#1,794 |
| 67. | Shenandoah Borough | 21 | 16,849(0.12%)#67 | 421,832(0.00%)#1,800 |
| 68. | Eddystone Borough | 20 | 16,849(0.12%)#68 | 421,832(0.00%)#1,836 |
| 69. | Lionville | 19 | 16,849(0.11%)#69 | 421,832(0.00%)#1,871 |
| 70. | Blawnox Borough | 19 | 16,849(0.11%)#70 | 421,832(0.00%)#1,876 |
| 71. | Munhall Borough | 18 | 16,849(0.11%)#71 | 421,832(0.00%)#1,907 |
| 72. | Middletown | 18 | 16,849(0.11%)#72 | 421,832(0.00%)#1,912 |
| 73. | Roslyn | 17 | 16,849(0.10%)#73 | 421,832(0.00%)#1,955 |
| 74. | Mount Joy Borough | 17 | 16,849(0.10%)#74 | 421,832(0.00%)#1,961 |
| 75. | Nazareth Borough | 17 | 16,849(0.10%)#75 | 421,832(0.00%)#1,967 |
| 76. | Kenhorst Borough | 17 | 16,849(0.10%)#76 | 421,832(0.00%)#1,973 |
| 77. | East Lansdowne Borough | 17 | 16,849(0.10%)#77 | 421,832(0.00%)#1,974 |
| 78. | Oakmont Borough | 16 | 16,849(0.09%)#78 | 421,832(0.00%)#2,021 |
| 79. | Pine Ridge | 16 | 16,849(0.09%)#79 | 421,832(0.00%)#2,035 |
| 80. | Paxtang Borough | 16 | 16,849(0.09%)#80 | 421,832(0.00%)#2,038 |
| 81. | Chambersburg Borough | 15 | 16,849(0.09%)#81 | 421,832(0.00%)#2,058 |
| 82. | West Mifflin Borough | 15 | 16,849(0.09%)#82 | 421,832(0.00%)#2,060 |
| 83. | Merion Station | 15 | 16,849(0.09%)#83 | 421,832(0.00%)#2,081 |
| 84. | Dorneyville | 15 | 16,849(0.09%)#84 | 421,832(0.00%)#2,083 |
| 85. | Wyomissing Borough | 14 | 16,849(0.08%)#85 | 421,832(0.00%)#2,128 |
| 86. | Enola | 14 | 16,849(0.08%)#86 | 421,832(0.00%)#2,135 |
| 87. | Media Borough | 14 | 16,849(0.08%)#87 | 421,832(0.00%)#2,136 |
| 88. | Newtown Grant | 14 | 16,849(0.08%)#88 | 421,832(0.00%)#2,137 |
| 89. | Camp Hill Borough | 13 | 16,849(0.08%)#89 | 421,832(0.00%)#2,180 |
| 90. | Eagleville Cdp Montgomery County | 13 | 16,849(0.08%)#90 | 421,832(0.00%)#2,189 |
| 91. | Danville Borough | 13 | 16,849(0.08%)#91 | 421,832(0.00%)#2,192 |
| 92. | Springdale Borough | 13 | 16,849(0.08%)#92 | 421,832(0.00%)#2,195 |
| 93. | Kennett Square Borough | 12 | 16,849(0.07%)#93 | 421,832(0.00%)#2,248 |
| 94. | St. Davids | 12 | 16,849(0.07%)#94 | 421,832(0.00%)#2,256 |
| 95. | Hatfield Borough | 12 | 16,849(0.07%)#95 | 421,832(0.00%)#2,258 |
| 96. | New Stanton Borough | 12 | 16,849(0.07%)#96 | 421,832(0.00%)#2,260 |
| 97. | North Belle Vernon Borough | 12 | 16,849(0.07%)#97 | 421,832(0.00%)#2,262 |
| 98. | Scranton | 11 | 16,849(0.07%)#98 | 421,832(0.00%)#2,268 |
| 99. | Emsworth Borough | 11 | 16,849(0.07%)#99 | 421,832(0.00%)#2,305 |
| 100. | Hershey | 10 | 16,849(0.06%)#100 | 421,832(0.00%)#2,337 |
Common Questions
What are the Top 10 Cities with the Most Immigrants from Northern Africa in Pennsylvania?
Top 10 Cities with the Most Immigrants from Northern Africa in Pennsylvania are:
#1
4,130
#2
746
#3
250
#4
219
#5
217
#6
200
#7
189
#8
142
#9
115
#10
101
What city has the Most Immigrants from Northern Africa in Pennsylvania?
Philadelphia has the Most Immigrants from Northern Africa in Pennsylvania with 4,130.
What is the Total Immigrants from Northern Africa in the State of Pennsylvania?
Total Immigrants from Northern Africa in Pennsylvania is 16,849.
What is the Total Immigrants from Northern Africa in the United States?
Total Immigrants from Northern Africa in the United States is 421,832.