Cities with the Highest Percentage of Immigrants from Ethiopia in Ohio
RELATED REPORTS & OPTIONS
Ethiopia
Ohio
Compare Cities
Map of Cities with the Highest Percentage of Immigrants from Ethiopia in Ohio
0.00%
8.00%
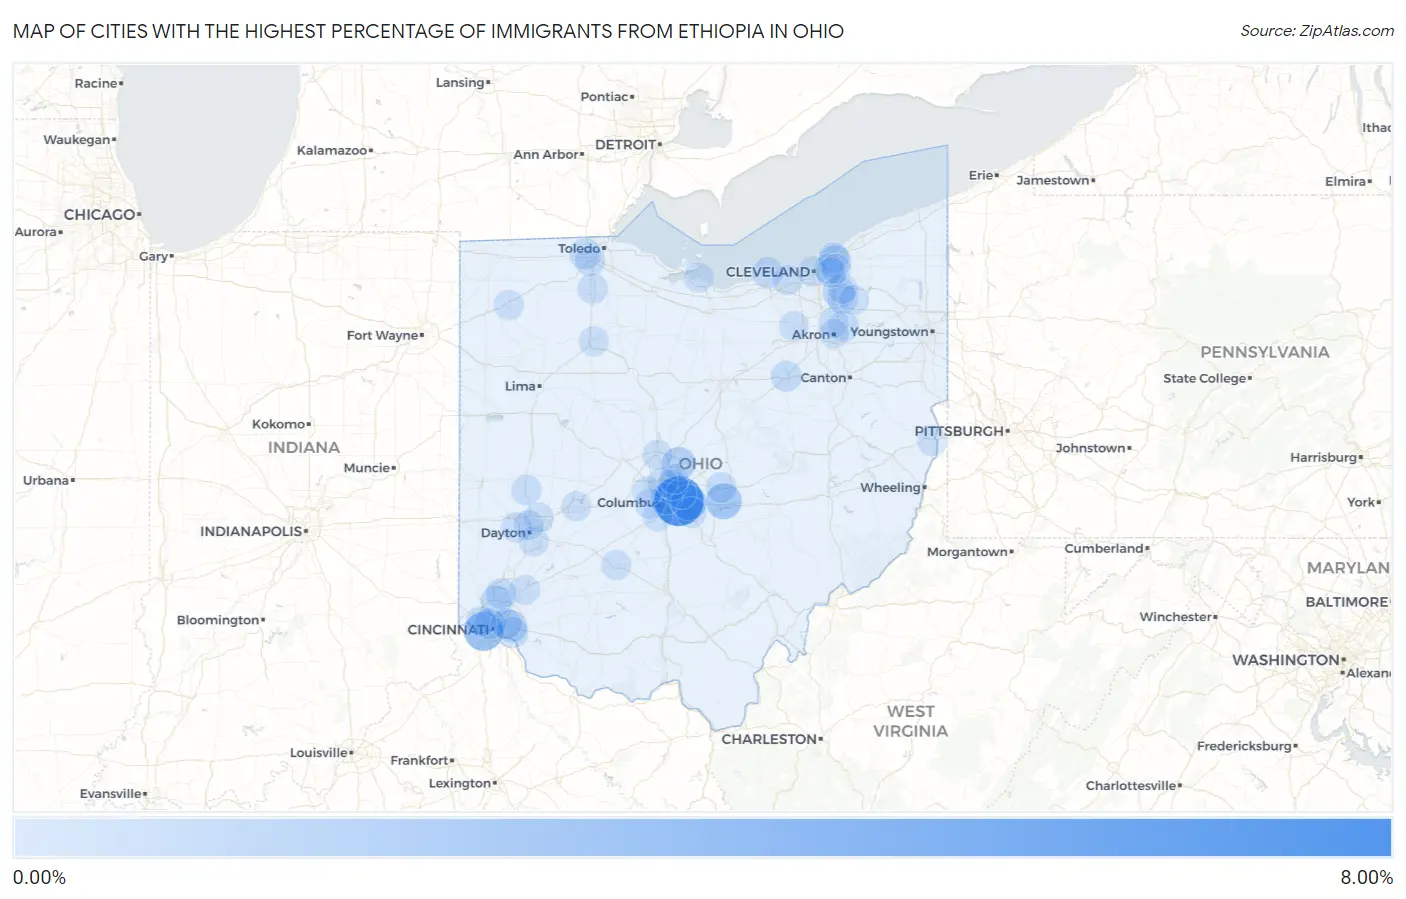
Cities with the Highest Percentage of Immigrants from Ethiopia in Ohio
| City | Ethiopia | vs State | vs National | |
| 1. | Whitehall | 6.75% | 0.071%(+6.68)#-1 | 0.083%(+6.66)#0 |
| 2. | Delshire | 3.05% | 0.071%(+2.98)#0 | 0.083%(+2.97)#1 |
| 3. | Hebron | 1.93% | 0.071%(+1.86)#1 | 0.083%(+1.85)#2 |
| 4. | Reynoldsburg | 1.73% | 0.071%(+1.65)#31 | 0.083%(+1.64)#749 |
| 5. | Galena | 1.16% | 0.071%(+1.09)#32 | 0.083%(+1.08)#750 |
| 6. | Richmond Heights | 0.77% | 0.071%(+0.704)#33 | 0.083%(+0.691)#751 |
| 7. | Glenwillow | 0.71% | 0.071%(+0.636)#34 | 0.083%(+0.624)#752 |
| 8. | Newtown | 0.71% | 0.071%(+0.635)#35 | 0.083%(+0.623)#753 |
| 9. | Springdale | 0.52% | 0.071%(+0.447)#36 | 0.083%(+0.435)#754 |
| 10. | Columbus | 0.41% | 0.071%(+0.338)#37 | 0.083%(+0.326)#774 |
| 11. | Holland | 0.38% | 0.071%(+0.313)#38 | 0.083%(+0.301)#775 |
| 12. | Forestville | 0.36% | 0.071%(+0.293)#39 | 0.083%(+0.280)#776 |
| 13. | Cincinnati | 0.36% | 0.071%(+0.285)#40 | 0.083%(+0.273)#871 |
| 14. | Sheffield Lake | 0.32% | 0.071%(+0.253)#41 | 0.083%(+0.241)#872 |
| 15. | Beckett Ridge | 0.28% | 0.071%(+0.212)#42 | 0.083%(+0.200)#873 |
| 16. | Wooster | 0.28% | 0.071%(+0.210)#43 | 0.083%(+0.198)#874 |
| 17. | Fairfax | 0.24% | 0.071%(+0.170)#44 | 0.083%(+0.158)#875 |
| 18. | Munroe Falls | 0.24% | 0.071%(+0.167)#45 | 0.083%(+0.155)#876 |
| 19. | Granville | 0.22% | 0.071%(+0.154)#46 | 0.083%(+0.142)#877 |
| 20. | Troy | 0.14% | 0.071%(+0.065)#47 | 0.083%(+0.053)#878 |
| 21. | Pickerington | 0.13% | 0.071%(+0.058)#48 | 0.083%(+0.046)#879 |
| 22. | Twinsburg | 0.12% | 0.071%(+0.053)#49 | 0.083%(+0.041)#880 |
| 23. | Bowling Green | 0.11% | 0.071%(+0.042)#50 | 0.083%(+0.030)#881 |
| 24. | Cheviot | 0.10% | 0.071%(+0.032)#51 | 0.083%(+0.020)#882 |
| 25. | Maumee | 0.10% | 0.071%(+0.030)#52 | 0.083%(+0.018)#883 |
| 26. | Trotwood | 0.086% | 0.071%(+0.015)#53 | 0.083%(+0.003)#884 |
| 27. | Westlake | 0.079% | 0.071%(+0.008)#54 | 0.083%(-0.004)#885 |
| 28. | Worthington | 0.073% | 0.071%(+0.002)#55 | 0.083%(-0.010)#886 |
| 29. | Lincoln Village | 0.063% | 0.071%(-0.008)#56 | 0.083%(-0.020)#887 |
| 30. | Hilliard | 0.055% | 0.071%(-0.016)#57 | 0.083%(-0.028)#888 |
| 31. | Grove City | 0.053% | 0.071%(-0.018)#58 | 0.083%(-0.030)#889 |
| 32. | Minerva Park | 0.053% | 0.071%(-0.018)#59 | 0.083%(-0.030)#890 |
| 33. | Solon | 0.050% | 0.071%(-0.021)#60 | 0.083%(-0.033)#891 |
| 34. | Washington Court House | 0.049% | 0.071%(-0.023)#61 | 0.083%(-0.035)#892 |
| 35. | Defiance | 0.047% | 0.071%(-0.024)#62 | 0.083%(-0.036)#893 |
| 36. | South Lebanon | 0.047% | 0.071%(-0.024)#63 | 0.083%(-0.036)#894 |
| 37. | Euclid | 0.037% | 0.071%(-0.035)#64 | 0.083%(-0.047)#895 |
| 38. | Aurora | 0.035% | 0.071%(-0.036)#65 | 0.083%(-0.048)#896 |
| 39. | Gahanna | 0.034% | 0.071%(-0.037)#66 | 0.083%(-0.049)#897 |
| 40. | Steubenville | 0.033% | 0.071%(-0.038)#67 | 0.083%(-0.050)#898 |
| 41. | Kettering | 0.033% | 0.071%(-0.038)#68 | 0.083%(-0.050)#899 |
| 42. | Springfield | 0.029% | 0.071%(-0.042)#69 | 0.083%(-0.054)#900 |
| 43. | Huber Heights | 0.026% | 0.071%(-0.046)#70 | 0.083%(-0.058)#901 |
| 44. | Dayton | 0.023% | 0.071%(-0.048)#71 | 0.083%(-0.060)#902 |
| 45. | Cuyahoga Falls | 0.022% | 0.071%(-0.050)#72 | 0.083%(-0.062)#903 |
| 46. | Cleveland | 0.022% | 0.071%(-0.050)#73 | 0.083%(-0.062)#904 |
| 47. | Sandusky | 0.020% | 0.071%(-0.051)#74 | 0.083%(-0.063)#905 |
| 48. | Westerville | 0.015% | 0.071%(-0.056)#75 | 0.083%(-0.068)#906 |
| 49. | Medina | 0.015% | 0.071%(-0.056)#76 | 0.083%(-0.068)#907 |
| 50. | Cleveland Heights | 0.011% | 0.071%(-0.060)#77 | 0.083%(-0.072)#908 |
| 51. | Delaware | 0.0095% | 0.071%(-0.062)#78 | 0.083%(-0.074)#909 |
| 52. | Findlay | 0.0074% | 0.071%(-0.064)#79 | 0.083%(-0.076)#910 |
| 53. | University Heights | 0.0073% | 0.071%(-0.064)#80 | 0.083%(-0.076)#911 |
| 54. | Lyndhurst | 0.0072% | 0.071%(-0.064)#81 | 0.083%(-0.076)#912 |
| 55. | Akron | 0.0026% | 0.071%(-0.069)#82 | 0.083%(-0.081)#913 |
Common Questions
What are the Top 10 Cities with the Highest Percentage of Immigrants from Ethiopia in Ohio?
Top 10 Cities with the Highest Percentage of Immigrants from Ethiopia in Ohio are:
#1
6.75%
#2
3.05%
#3
1.93%
#4
1.73%
#5
1.16%
#6
0.77%
#7
0.71%
#8
0.71%
#9
0.52%
#10
0.41%
What city has the Highest Percentage of Immigrants from Ethiopia in Ohio?
Whitehall has the Highest Percentage of Immigrants from Ethiopia in Ohio with 6.75%.
What is the Percentage of Immigrants from Ethiopia in the State of Ohio?
Percentage of Immigrants from Ethiopia in Ohio is 0.071%.
What is the Percentage of Immigrants from Ethiopia in the United States?
Percentage of Immigrants from Ethiopia in the United States is 0.083%.