Cities with the Highest Percentage of Immigrants from Ethiopia in Missouri
RELATED REPORTS & OPTIONS
Ethiopia
Missouri
Compare Cities
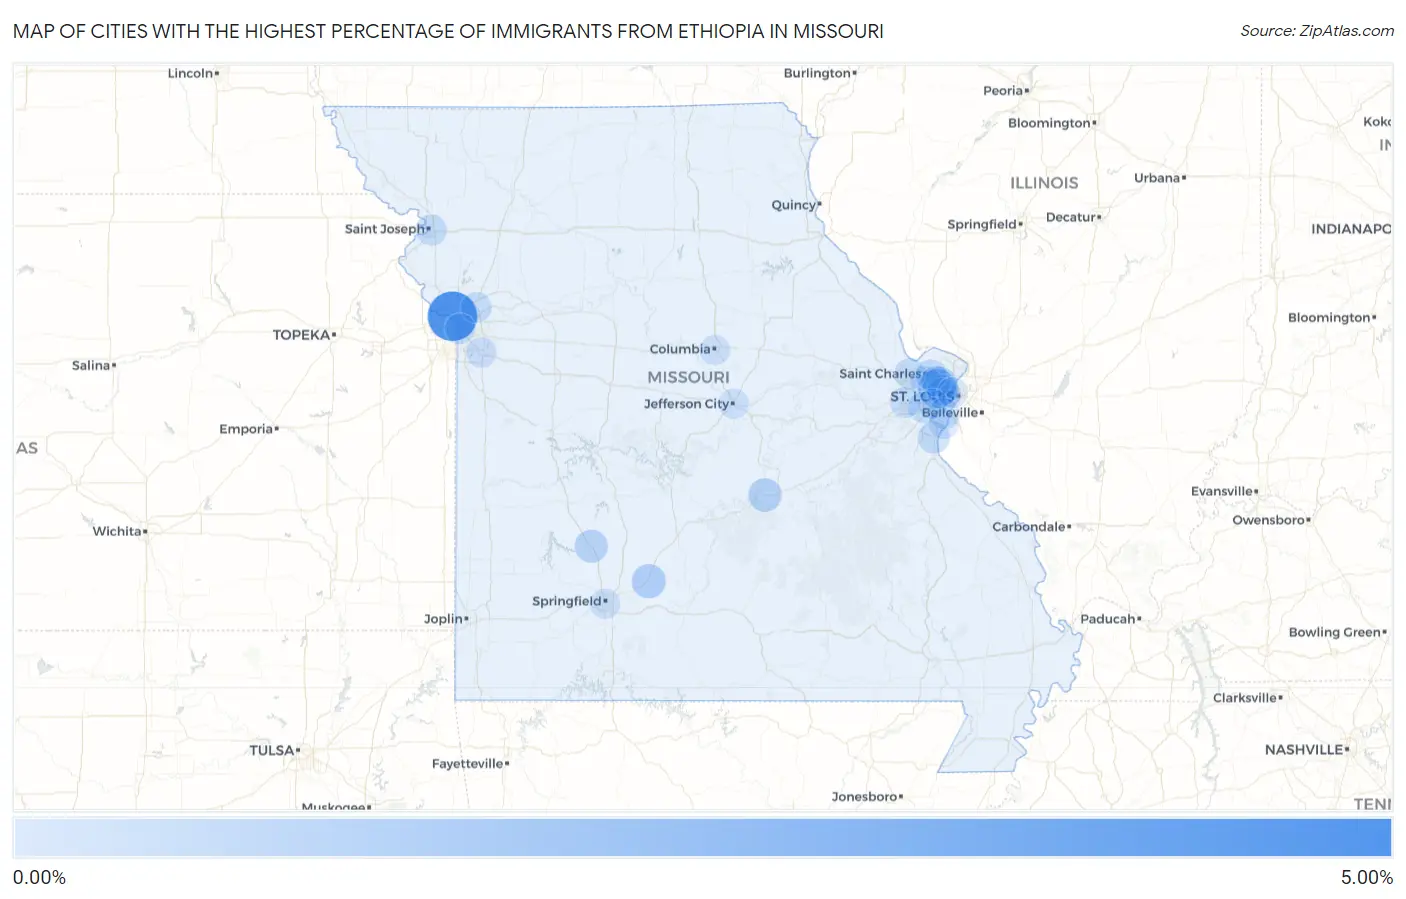
Map of Cities with the Highest Percentage of Immigrants from Ethiopia in Missouri
0.00%
5.00%
Cities with the Highest Percentage of Immigrants from Ethiopia in Missouri
| City | Ethiopia | vs State | vs National | |
| 1. | Riverside | 4.53% | 0.045%(+4.49)#-1 | 0.083%(+4.45)#0 |
| 2. | Olivette | 1.93% | 0.045%(+1.89)#0 | 0.083%(+1.85)#1 |
| 3. | Marshfield | 0.88% | 0.045%(+0.835)#1 | 0.083%(+0.797)#2 |
| 4. | St John | 0.85% | 0.045%(+0.806)#2 | 0.083%(+0.767)#3 |
| 5. | Doolittle | 0.75% | 0.045%(+0.703)#3 | 0.083%(+0.664)#4 |
| 6. | Bolivar | 0.66% | 0.045%(+0.614)#4 | 0.083%(+0.575)#5 |
| 7. | Barnhart | 0.36% | 0.045%(+0.320)#5 | 0.083%(+0.281)#6 |
| 8. | Maryland Heights | 0.27% | 0.045%(+0.222)#6 | 0.083%(+0.184)#284 |
| 9. | Valley Park | 0.26% | 0.045%(+0.218)#7 | 0.083%(+0.180)#285 |
| 10. | Clayton | 0.23% | 0.045%(+0.182)#8 | 0.083%(+0.143)#286 |
| 11. | St Joseph | 0.22% | 0.045%(+0.178)#9 | 0.083%(+0.140)#287 |
| 12. | University City | 0.20% | 0.045%(+0.159)#10 | 0.083%(+0.121)#288 |
| 13. | Bridgeton | 0.20% | 0.045%(+0.157)#11 | 0.083%(+0.118)#289 |
| 14. | St Peters | 0.20% | 0.045%(+0.151)#12 | 0.083%(+0.113)#290 |
| 15. | Liberty | 0.19% | 0.045%(+0.150)#13 | 0.083%(+0.112)#291 |
| 16. | Mehlville | 0.18% | 0.045%(+0.131)#14 | 0.083%(+0.092)#596 |
| 17. | Kansas City | 0.14% | 0.045%(+0.094)#15 | 0.083%(+0.055)#780 |
| 18. | Wildwood | 0.13% | 0.045%(+0.083)#16 | 0.083%(+0.044)#781 |
| 19. | St Ann | 0.10% | 0.045%(+0.056)#17 | 0.083%(+0.017)#782 |
| 20. | St Louis | 0.096% | 0.045%(+0.051)#18 | 0.083%(+0.012)#918 |
| 21. | Lee S Summit | 0.048% | 0.045%(+0.003)#19 | 0.083%(-0.035)#919 |
| 22. | Columbia | 0.034% | 0.045%(-0.011)#20 | 0.083%(-0.049)#920 |
| 23. | Kirkwood | 0.031% | 0.045%(-0.014)#21 | 0.083%(-0.052)#921 |
| 24. | Oakville | 0.025% | 0.045%(-0.019)#22 | 0.083%(-0.058)#922 |
| 25. | Springfield | 0.024% | 0.045%(-0.020)#23 | 0.083%(-0.059)#923 |
| 26. | Jefferson City | 0.021% | 0.045%(-0.024)#24 | 0.083%(-0.062)#924 |
Common Questions
What are the Top 10 Cities with the Highest Percentage of Immigrants from Ethiopia in Missouri?
Top 10 Cities with the Highest Percentage of Immigrants from Ethiopia in Missouri are:
#1
4.53%
#2
1.93%
#3
0.88%
#4
0.85%
#5
0.75%
#6
0.66%
#7
0.36%
#8
0.27%
#9
0.26%
#10
0.23%
What city has the Highest Percentage of Immigrants from Ethiopia in Missouri?
Riverside has the Highest Percentage of Immigrants from Ethiopia in Missouri with 4.53%.
What is the Percentage of Immigrants from Ethiopia in the State of Missouri?
Percentage of Immigrants from Ethiopia in Missouri is 0.045%.
What is the Percentage of Immigrants from Ethiopia in the United States?
Percentage of Immigrants from Ethiopia in the United States is 0.083%.