Cities with the Highest Percentage of Immigrants from Brazil in Virginia
RELATED REPORTS & OPTIONS
Brazil
Virginia
Compare Cities
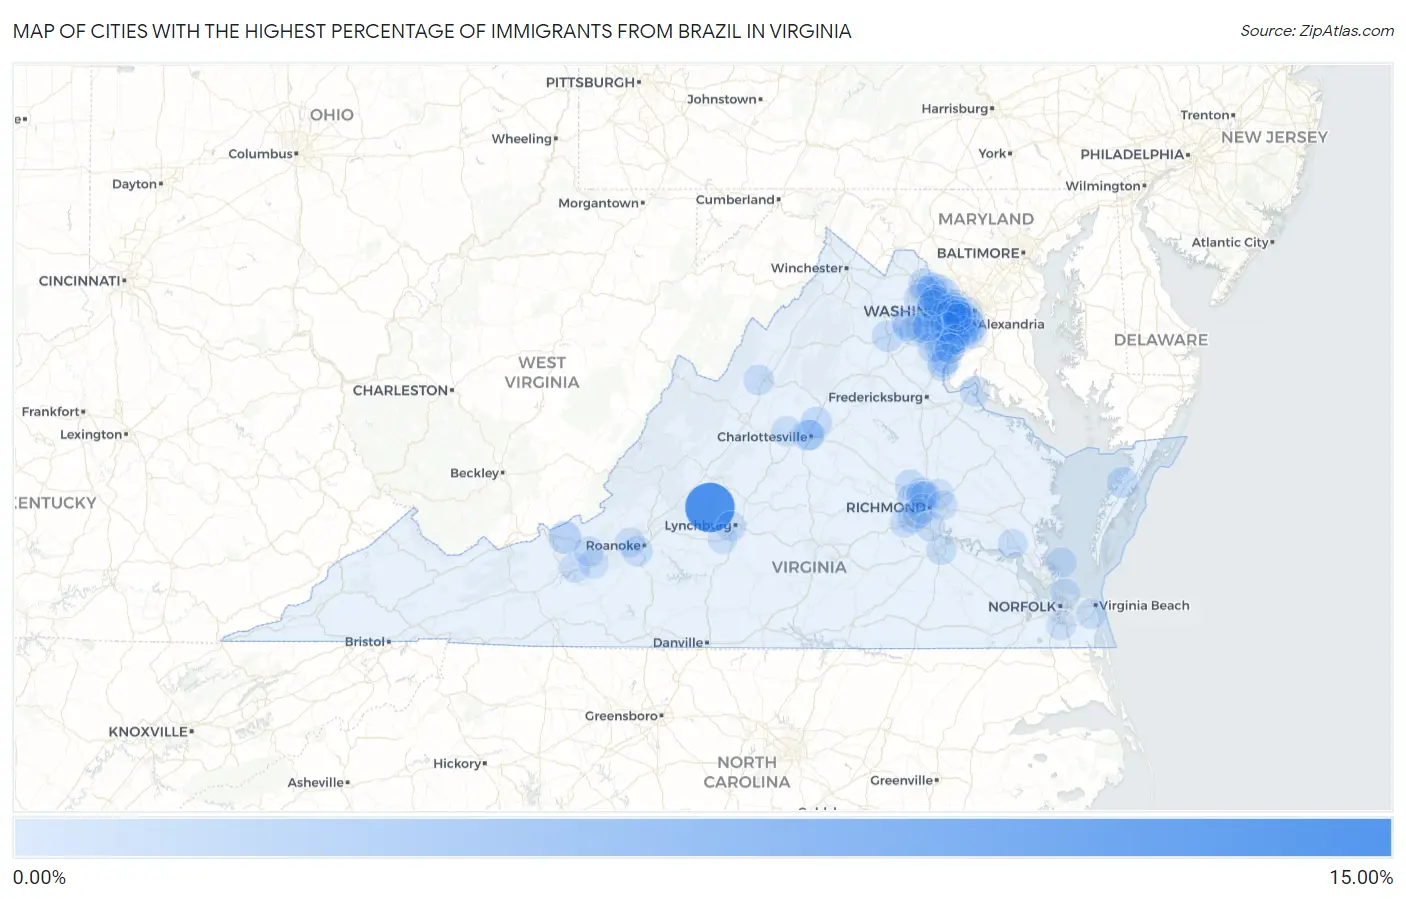
Map of Cities with the Highest Percentage of Immigrants from Brazil in Virginia
0.00%
15.00%
Cities with the Highest Percentage of Immigrants from Brazil in Virginia
| City | Brazil | vs State | vs National | |
| 1. | Big Island | 13.26% | 0.094%(+13.2)#-1 | 0.17%(+13.1)#0 |
| 2. | Pembroke | 1.79% | 0.094%(+1.70)#0 | 0.17%(+1.62)#1 |
| 3. | Fair Lakes | 1.35% | 0.094%(+1.25)#1 | 0.17%(+1.18)#2 |
| 4. | One Loudoun | 1.26% | 0.094%(+1.17)#2 | 0.17%(+1.09)#3 |
| 5. | University Of Virginia | 0.95% | 0.094%(+0.860)#169 | 0.17%(+0.787)#3,259 |
| 6. | Hollymead | 0.85% | 0.094%(+0.753)#170 | 0.17%(+0.680)#3,260 |
| 7. | Warrenton | 0.81% | 0.094%(+0.717)#171 | 0.17%(+0.644)#3,261 |
| 8. | Onancock | 0.77% | 0.094%(+0.673)#172 | 0.17%(+0.600)#3,262 |
| 9. | Fairfax Station | 0.72% | 0.094%(+0.631)#173 | 0.17%(+0.558)#3,263 |
| 10. | Triangle | 0.66% | 0.094%(+0.568)#174 | 0.17%(+0.495)#3,264 |
| 11. | Wyndham | 0.56% | 0.094%(+0.468)#175 | 0.17%(+0.395)#3,265 |
| 12. | Tuckahoe | 0.55% | 0.094%(+0.460)#176 | 0.17%(+0.387)#3,266 |
| 13. | Lowes Island | 0.54% | 0.094%(+0.448)#177 | 0.17%(+0.375)#3,267 |
| 14. | Wolf Trap | 0.53% | 0.094%(+0.441)#178 | 0.17%(+0.368)#3,367 |
| 15. | Kings Park | 0.50% | 0.094%(+0.406)#179 | 0.17%(+0.333)#3,368 |
| 16. | Lansdowne | 0.47% | 0.094%(+0.374)#180 | 0.17%(+0.300)#3,433 |
| 17. | Mclean | 0.45% | 0.094%(+0.358)#181 | 0.17%(+0.285)#3,434 |
| 18. | Mcnair | 0.45% | 0.094%(+0.353)#182 | 0.17%(+0.279)#3,435 |
| 19. | Dulles Town Center | 0.44% | 0.094%(+0.348)#183 | 0.17%(+0.275)#3,436 |
| 20. | Huntington | 0.42% | 0.094%(+0.330)#184 | 0.17%(+0.257)#3,437 |
| 21. | Dahlgren Center | 0.41% | 0.094%(+0.321)#185 | 0.17%(+0.248)#3,438 |
| 22. | Cave Spring | 0.40% | 0.094%(+0.302)#186 | 0.17%(+0.229)#3,439 |
| 23. | Dunn Loring | 0.39% | 0.094%(+0.297)#187 | 0.17%(+0.224)#3,440 |
| 24. | Ashburn | 0.39% | 0.094%(+0.293)#188 | 0.17%(+0.220)#3,441 |
| 25. | Lincolnia | 0.37% | 0.094%(+0.275)#189 | 0.17%(+0.202)#3,442 |
| 26. | Dayton | 0.37% | 0.094%(+0.272)#190 | 0.17%(+0.199)#3,443 |
| 27. | Oakton | 0.34% | 0.094%(+0.248)#191 | 0.17%(+0.175)#3,444 |
| 28. | Rockwood | 0.33% | 0.094%(+0.241)#192 | 0.17%(+0.167)#3,445 |
| 29. | Rose Hill Cdp Fairfax County | 0.31% | 0.094%(+0.218)#193 | 0.17%(+0.144)#3,446 |
| 30. | Manassas Park | 0.31% | 0.094%(+0.216)#194 | 0.17%(+0.143)#3,447 |
| 31. | Potomac Mills | 0.31% | 0.094%(+0.214)#195 | 0.17%(+0.140)#3,448 |
| 32. | Arlington | 0.29% | 0.094%(+0.194)#196 | 0.17%(+0.121)#3,449 |
| 33. | Woodlawn Cdp Fairfax County | 0.28% | 0.094%(+0.185)#197 | 0.17%(+0.112)#3,450 |
| 34. | Reston | 0.27% | 0.094%(+0.176)#198 | 0.17%(+0.103)#3,451 |
| 35. | Radford | 0.26% | 0.094%(+0.169)#199 | 0.17%(+0.096)#3,452 |
| 36. | West Springfield | 0.26% | 0.094%(+0.167)#200 | 0.17%(+0.094)#3,453 |
| 37. | Laurel | 0.26% | 0.094%(+0.166)#201 | 0.17%(+0.093)#3,454 |
| 38. | Great Falls | 0.25% | 0.094%(+0.160)#202 | 0.17%(+0.087)#3,455 |
| 39. | Dumbarton | 0.24% | 0.094%(+0.148)#203 | 0.17%(+0.075)#3,456 |
| 40. | Countryside | 0.24% | 0.094%(+0.145)#204 | 0.17%(+0.072)#3,457 |
| 41. | Laurel Hill | 0.23% | 0.094%(+0.138)#205 | 0.17%(+0.065)#3,458 |
| 42. | Brandermill | 0.23% | 0.094%(+0.137)#206 | 0.17%(+0.064)#3,459 |
| 43. | Falls Church | 0.23% | 0.094%(+0.133)#207 | 0.17%(+0.060)#3,460 |
| 44. | North Springfield | 0.22% | 0.094%(+0.123)#208 | 0.17%(+0.050)#3,461 |
| 45. | Poquoson | 0.22% | 0.094%(+0.123)#209 | 0.17%(+0.050)#3,462 |
| 46. | South Run | 0.22% | 0.094%(+0.122)#210 | 0.17%(+0.049)#3,463 |
| 47. | Buckhall | 0.20% | 0.094%(+0.110)#211 | 0.17%(+0.037)#3,464 |
| 48. | Vienna | 0.20% | 0.094%(+0.108)#212 | 0.17%(+0.034)#3,465 |
| 49. | Groveton | 0.20% | 0.094%(+0.105)#213 | 0.17%(+0.032)#3,466 |
| 50. | Fort Lee | 0.20% | 0.094%(+0.104)#214 | 0.17%(+0.031)#3,467 |
| 51. | Bailey S Crossroads | 0.20% | 0.094%(+0.104)#215 | 0.17%(+0.031)#3,468 |
| 52. | Alexandria | 0.20% | 0.094%(+0.103)#216 | 0.17%(+0.030)#3,469 |
| 53. | Springfield | 0.19% | 0.094%(+0.100)#217 | 0.17%(+0.027)#3,470 |
| 54. | Fort Belvoir | 0.19% | 0.094%(+0.098)#218 | 0.17%(+0.025)#3,471 |
| 55. | Haymarket | 0.19% | 0.094%(+0.097)#219 | 0.17%(+0.024)#3,472 |
| 56. | Occoquan | 0.19% | 0.094%(+0.093)#220 | 0.17%(+0.020)#3,473 |
| 57. | Crozet | 0.17% | 0.094%(+0.075)#221 | 0.17%(+0.002)#3,474 |
| 58. | Manchester | 0.17% | 0.094%(+0.074)#222 | 0.17%(+0.001)#3,475 |
| 59. | Dale City | 0.17% | 0.094%(+0.073)#223 | 0.17%(-0.000)#3,476 |
| 60. | Fair Oaks | 0.17% | 0.094%(+0.071)#224 | 0.17%(-0.002)#3,477 |
| 61. | Fairfax | 0.17% | 0.094%(+0.071)#225 | 0.17%(-0.002)#3,478 |
| 62. | Virginia Beach | 0.16% | 0.094%(+0.069)#226 | 0.17%(-0.004)#3,479 |
| 63. | Charlottesville | 0.16% | 0.094%(+0.066)#227 | 0.17%(-0.007)#3,648 |
| 64. | Brambleton | 0.16% | 0.094%(+0.064)#228 | 0.17%(-0.009)#3,649 |
| 65. | Independent Hill | 0.15% | 0.094%(+0.058)#229 | 0.17%(-0.015)#3,650 |
| 66. | Lake Barcroft | 0.15% | 0.094%(+0.057)#230 | 0.17%(-0.016)#3,651 |
| 67. | Lakeside | 0.15% | 0.094%(+0.055)#231 | 0.17%(-0.018)#3,652 |
| 68. | Lynchburg | 0.14% | 0.094%(+0.043)#232 | 0.17%(-0.030)#3,653 |
| 69. | Tysons | 0.13% | 0.094%(+0.033)#233 | 0.17%(-0.040)#3,654 |
| 70. | Linton Hall | 0.12% | 0.094%(+0.030)#234 | 0.17%(-0.043)#3,655 |
| 71. | Hayfield | 0.11% | 0.094%(+0.020)#235 | 0.17%(-0.053)#3,656 |
| 72. | Cherry Hill | 0.11% | 0.094%(+0.017)#236 | 0.17%(-0.056)#3,657 |
| 73. | Mechanicsville | 0.11% | 0.094%(+0.013)#237 | 0.17%(-0.060)#3,780 |
| 74. | Idylwood | 0.11% | 0.094%(+0.013)#238 | 0.17%(-0.060)#3,781 |
| 75. | Richmond | 0.10% | 0.094%(+0.010)#239 | 0.17%(-0.063)#3,782 |
| 76. | Timberlake | 0.10% | 0.094%(+0.006)#240 | 0.17%(-0.067)#3,783 |
| 77. | Chantilly | 0.100% | 0.094%(+0.006)#241 | 0.17%(-0.067)#3,784 |
| 78. | Christiansburg | 0.087% | 0.094%(-0.007)#242 | 0.17%(-0.080)#3,842 |
| 79. | Salem | 0.087% | 0.094%(-0.007)#243 | 0.17%(-0.080)#3,843 |
| 80. | Burke | 0.086% | 0.094%(-0.008)#244 | 0.17%(-0.081)#3,844 |
| 81. | Floris | 0.081% | 0.094%(-0.013)#245 | 0.17%(-0.086)#3,845 |
| 82. | Bull Run | 0.078% | 0.094%(-0.015)#246 | 0.17%(-0.089)#3,846 |
| 83. | Burke Centre | 0.078% | 0.094%(-0.016)#247 | 0.17%(-0.089)#3,847 |
| 84. | Blacksburg | 0.078% | 0.094%(-0.016)#248 | 0.17%(-0.089)#3,848 |
| 85. | Difficult Run | 0.077% | 0.094%(-0.017)#249 | 0.17%(-0.090)#3,849 |
| 86. | Gainesville | 0.077% | 0.094%(-0.017)#250 | 0.17%(-0.090)#3,850 |
| 87. | Quantico Base | 0.074% | 0.094%(-0.019)#251 | 0.17%(-0.092)#3,851 |
| 88. | Merrifield | 0.070% | 0.094%(-0.023)#252 | 0.17%(-0.097)#3,852 |
| 89. | Fort Hunt | 0.069% | 0.094%(-0.025)#253 | 0.17%(-0.098)#3,853 |
| 90. | Highland Springs | 0.067% | 0.094%(-0.026)#254 | 0.17%(-0.100)#3,854 |
| 91. | Yorkshire | 0.066% | 0.094%(-0.027)#255 | 0.17%(-0.101)#3,855 |
| 92. | Annandale | 0.066% | 0.094%(-0.028)#256 | 0.17%(-0.101)#3,856 |
| 93. | Williamsburg | 0.065% | 0.094%(-0.029)#257 | 0.17%(-0.102)#3,857 |
| 94. | Bellwood | 0.064% | 0.094%(-0.029)#258 | 0.17%(-0.103)#3,858 |
| 95. | Lorton | 0.063% | 0.094%(-0.030)#259 | 0.17%(-0.103)#3,859 |
| 96. | Norfolk | 0.063% | 0.094%(-0.031)#260 | 0.17%(-0.104)#3,860 |
| 97. | Herndon | 0.061% | 0.094%(-0.032)#261 | 0.17%(-0.105)#3,861 |
| 98. | West Falls Church | 0.061% | 0.094%(-0.033)#262 | 0.17%(-0.106)#3,862 |
| 99. | Woodbridge | 0.056% | 0.094%(-0.037)#263 | 0.17%(-0.111)#3,863 |
| 100. | Chesapeake | 0.054% | 0.094%(-0.040)#264 | 0.17%(-0.113)#3,864 |
Common Questions
What are the Top 10 Cities with the Highest Percentage of Immigrants from Brazil in Virginia?
Top 10 Cities with the Highest Percentage of Immigrants from Brazil in Virginia are:
#1
13.26%
#2
1.79%
#3
1.35%
#4
0.95%
#5
0.85%
#6
0.81%
#7
0.77%
#8
0.72%
#9
0.66%
#10
0.56%
What city has the Highest Percentage of Immigrants from Brazil in Virginia?
Big Island has the Highest Percentage of Immigrants from Brazil in Virginia with 13.26%.
What is the Percentage of Immigrants from Brazil in the State of Virginia?
Percentage of Immigrants from Brazil in Virginia is 0.094%.
What is the Percentage of Immigrants from Brazil in the United States?
Percentage of Immigrants from Brazil in the United States is 0.17%.