Cities with the Highest Percentage of Immigrants from Brazil in Illinois
RELATED REPORTS & OPTIONS
Brazil
Illinois
Compare Cities
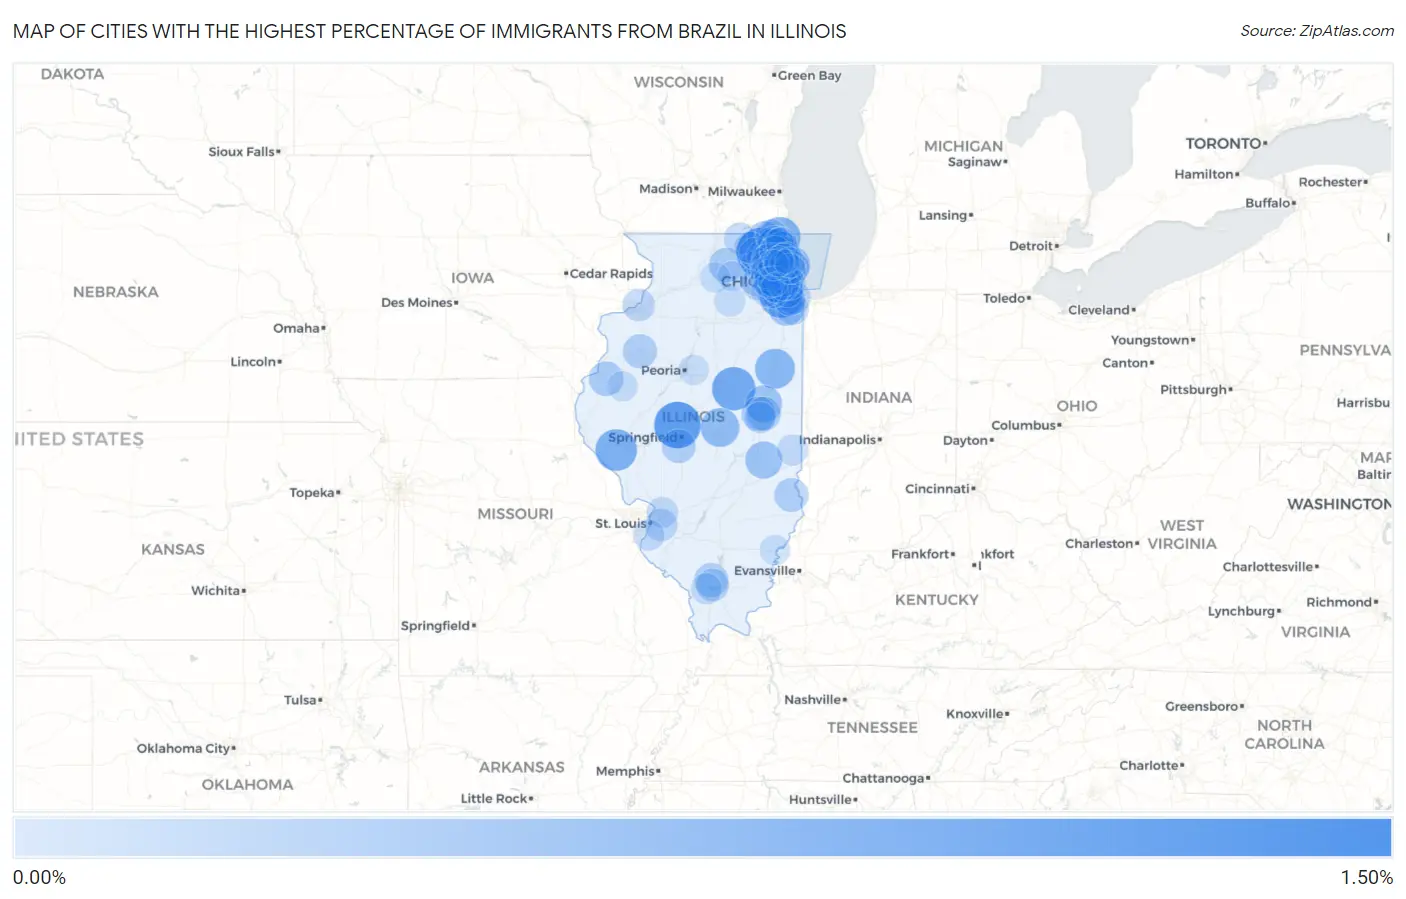
Map of Cities with the Highest Percentage of Immigrants from Brazil in Illinois
0.00%
1.50%
Cities with the Highest Percentage of Immigrants from Brazil in Illinois
| City | Brazil | vs State | vs National | |
| 1. | Oakwood Hills | 1.37% | 0.069%(+1.30)#45 | 0.17%(+1.21)#2,609 |
| 2. | Athens | 1.17% | 0.069%(+1.10)#46 | 0.17%(+1.00)#2,610 |
| 3. | Ellsworth | 0.95% | 0.069%(+0.879)#47 | 0.17%(+0.781)#2,611 |
| 4. | Palos Park | 0.93% | 0.069%(+0.862)#48 | 0.17%(+0.764)#2,612 |
| 5. | Indian Head Park | 0.92% | 0.069%(+0.851)#49 | 0.17%(+0.753)#2,613 |
| 6. | Mettawa | 0.83% | 0.069%(+0.763)#50 | 0.17%(+0.665)#2,614 |
| 7. | Pittsfield | 0.82% | 0.069%(+0.750)#51 | 0.17%(+0.652)#2,615 |
| 8. | Wadsworth | 0.78% | 0.069%(+0.714)#52 | 0.17%(+0.616)#2,616 |
| 9. | Berkeley | 0.74% | 0.069%(+0.669)#53 | 0.17%(+0.571)#2,617 |
| 10. | Onarga | 0.70% | 0.069%(+0.630)#54 | 0.17%(+0.532)#2,618 |
| 11. | Forsyth | 0.62% | 0.069%(+0.554)#55 | 0.17%(+0.456)#2,619 |
| 12. | Oakbrook Terrace | 0.56% | 0.069%(+0.488)#56 | 0.17%(+0.390)#2,620 |
| 13. | Kenilworth | 0.55% | 0.069%(+0.483)#57 | 0.17%(+0.385)#2,621 |
| 14. | Charleston | 0.51% | 0.069%(+0.443)#58 | 0.17%(+0.345)#2,622 |
| 15. | Thomasboro | 0.49% | 0.069%(+0.420)#59 | 0.17%(+0.322)#2,623 |
| 16. | Vernon Hills | 0.47% | 0.069%(+0.398)#72 | 0.17%(+0.300)#3,256 |
| 17. | Frankfort Square | 0.45% | 0.069%(+0.380)#73 | 0.17%(+0.282)#3,257 |
| 18. | Schaumburg | 0.39% | 0.069%(+0.326)#74 | 0.17%(+0.228)#3,258 |
| 19. | Fox Lake | 0.39% | 0.069%(+0.320)#75 | 0.17%(+0.222)#3,259 |
| 20. | Gages Lake | 0.38% | 0.069%(+0.307)#76 | 0.17%(+0.209)#3,260 |
| 21. | Lake Zurich | 0.37% | 0.069%(+0.301)#101 | 0.17%(+0.203)#3,736 |
| 22. | La Harpe | 0.34% | 0.069%(+0.270)#102 | 0.17%(+0.172)#3,737 |
| 23. | Kildeer | 0.34% | 0.069%(+0.270)#103 | 0.17%(+0.172)#3,738 |
| 24. | Champaign | 0.34% | 0.069%(+0.269)#104 | 0.17%(+0.171)#3,739 |
| 25. | Kirkland | 0.33% | 0.069%(+0.266)#105 | 0.17%(+0.168)#3,740 |
| 26. | Urbana | 0.31% | 0.069%(+0.241)#106 | 0.17%(+0.143)#3,741 |
| 27. | Bush | 0.31% | 0.069%(+0.240)#107 | 0.17%(+0.142)#3,742 |
| 28. | Galesburg | 0.31% | 0.069%(+0.239)#108 | 0.17%(+0.141)#3,743 |
| 29. | Robinson | 0.30% | 0.069%(+0.227)#109 | 0.17%(+0.129)#3,744 |
| 30. | Chatham | 0.29% | 0.069%(+0.222)#110 | 0.17%(+0.124)#3,745 |
| 31. | Round Lake | 0.28% | 0.069%(+0.215)#111 | 0.17%(+0.117)#3,746 |
| 32. | Evanston | 0.28% | 0.069%(+0.214)#112 | 0.17%(+0.116)#3,747 |
| 33. | Blue Island | 0.28% | 0.069%(+0.210)#113 | 0.17%(+0.112)#3,748 |
| 34. | Carol Stream | 0.25% | 0.069%(+0.181)#114 | 0.17%(+0.083)#3,749 |
| 35. | Third Lake | 0.25% | 0.069%(+0.178)#115 | 0.17%(+0.080)#3,750 |
| 36. | Lincolnwood | 0.24% | 0.069%(+0.172)#116 | 0.17%(+0.074)#3,751 |
| 37. | Elmhurst | 0.23% | 0.069%(+0.159)#117 | 0.17%(+0.061)#3,752 |
| 38. | Grayslake | 0.23% | 0.069%(+0.157)#118 | 0.17%(+0.059)#3,753 |
| 39. | Carterville | 0.22% | 0.069%(+0.154)#119 | 0.17%(+0.056)#3,754 |
| 40. | Burr Ridge | 0.21% | 0.069%(+0.138)#120 | 0.17%(+0.040)#3,755 |
| 41. | Glen Ellyn | 0.20% | 0.069%(+0.136)#121 | 0.17%(+0.038)#3,756 |
| 42. | Olympia Fields | 0.20% | 0.069%(+0.134)#122 | 0.17%(+0.036)#3,757 |
| 43. | Hinsdale | 0.20% | 0.069%(+0.129)#123 | 0.17%(+0.031)#3,758 |
| 44. | Hampton | 0.19% | 0.069%(+0.125)#124 | 0.17%(+0.027)#3,759 |
| 45. | Batavia | 0.19% | 0.069%(+0.125)#125 | 0.17%(+0.027)#3,760 |
| 46. | Fairview Heights | 0.19% | 0.069%(+0.121)#126 | 0.17%(+0.023)#3,761 |
| 47. | Sleepy Hollow | 0.19% | 0.069%(+0.118)#127 | 0.17%(+0.020)#3,762 |
| 48. | Harwood Heights | 0.18% | 0.069%(+0.110)#128 | 0.17%(+0.012)#3,763 |
| 49. | Harvard | 0.18% | 0.069%(+0.106)#129 | 0.17%(+0.008)#3,764 |
| 50. | Lake Forest | 0.17% | 0.069%(+0.101)#130 | 0.17%(+0.003)#3,765 |
| 51. | Geneva | 0.17% | 0.069%(+0.099)#131 | 0.17%(+0.001)#3,766 |
| 52. | Burbank | 0.17% | 0.069%(+0.099)#132 | 0.17%(+0.001)#3,767 |
| 53. | Northlake | 0.17% | 0.069%(+0.097)#133 | 0.17%(-0.001)#3,768 |
| 54. | Winfield | 0.16% | 0.069%(+0.092)#134 | 0.17%(-0.006)#3,769 |
| 55. | Oak Park | 0.16% | 0.069%(+0.091)#135 | 0.17%(-0.007)#3,846 |
| 56. | Crystal Lake | 0.16% | 0.069%(+0.089)#136 | 0.17%(-0.009)#3,847 |
| 57. | Libertyville | 0.16% | 0.069%(+0.087)#137 | 0.17%(-0.011)#3,848 |
| 58. | North Chicago | 0.16% | 0.069%(+0.087)#138 | 0.17%(-0.011)#3,849 |
| 59. | Fox River Grove | 0.15% | 0.069%(+0.083)#139 | 0.17%(-0.015)#3,850 |
| 60. | River Forest | 0.15% | 0.069%(+0.078)#140 | 0.17%(-0.020)#3,851 |
| 61. | Woodstock | 0.15% | 0.069%(+0.077)#141 | 0.17%(-0.021)#3,852 |
| 62. | Chicago | 0.15% | 0.069%(+0.077)#142 | 0.17%(-0.021)#3,853 |
| 63. | Antioch | 0.14% | 0.069%(+0.074)#143 | 0.17%(-0.024)#3,854 |
| 64. | Palatine | 0.14% | 0.069%(+0.073)#144 | 0.17%(-0.026)#3,855 |
| 65. | Buffalo Grove | 0.14% | 0.069%(+0.069)#145 | 0.17%(-0.029)#3,856 |
| 66. | Deer Park | 0.14% | 0.069%(+0.067)#146 | 0.17%(-0.031)#3,857 |
| 67. | Hoffman Estates | 0.13% | 0.069%(+0.065)#147 | 0.17%(-0.033)#3,858 |
| 68. | Savoy | 0.13% | 0.069%(+0.058)#148 | 0.17%(-0.040)#3,859 |
| 69. | Glen Carbon | 0.12% | 0.069%(+0.056)#149 | 0.17%(-0.042)#3,860 |
| 70. | Midlothian | 0.12% | 0.069%(+0.051)#150 | 0.17%(-0.047)#3,861 |
| 71. | Columbia | 0.12% | 0.069%(+0.049)#151 | 0.17%(-0.049)#3,862 |
| 72. | Woodridge | 0.12% | 0.069%(+0.049)#152 | 0.17%(-0.049)#3,863 |
| 73. | Carbondale | 0.11% | 0.069%(+0.040)#153 | 0.17%(-0.058)#3,864 |
| 74. | Paris | 0.11% | 0.069%(+0.039)#154 | 0.17%(-0.059)#3,865 |
| 75. | Barrington | 0.11% | 0.069%(+0.038)#155 | 0.17%(-0.060)#3,866 |
| 76. | Hanover Park | 0.10% | 0.069%(+0.036)#156 | 0.17%(-0.062)#3,867 |
| 77. | Mount Prospect | 0.10% | 0.069%(+0.034)#157 | 0.17%(-0.064)#3,868 |
| 78. | Gurnee | 0.10% | 0.069%(+0.032)#158 | 0.17%(-0.066)#3,869 |
| 79. | Bloomingdale | 0.098% | 0.069%(+0.029)#159 | 0.17%(-0.069)#3,870 |
| 80. | Highland Park | 0.096% | 0.069%(+0.027)#160 | 0.17%(-0.071)#3,871 |
| 81. | Naperville | 0.087% | 0.069%(+0.018)#161 | 0.17%(-0.080)#3,872 |
| 82. | Leland | 0.087% | 0.069%(+0.018)#162 | 0.17%(-0.080)#3,873 |
| 83. | Mundelein | 0.085% | 0.069%(+0.017)#163 | 0.17%(-0.081)#3,874 |
| 84. | Waukegan | 0.085% | 0.069%(+0.016)#164 | 0.17%(-0.082)#3,875 |
| 85. | Brookfield | 0.083% | 0.069%(+0.014)#165 | 0.17%(-0.084)#3,876 |
| 86. | Prospect Heights | 0.082% | 0.069%(+0.013)#166 | 0.17%(-0.085)#3,877 |
| 87. | Wheaton | 0.078% | 0.069%(+0.009)#167 | 0.17%(-0.089)#3,878 |
| 88. | Deerfield | 0.078% | 0.069%(+0.009)#168 | 0.17%(-0.089)#3,879 |
| 89. | Lombard | 0.075% | 0.069%(+0.006)#169 | 0.17%(-0.092)#3,880 |
| 90. | Glenview | 0.071% | 0.069%(+0.002)#170 | 0.17%(-0.096)#3,881 |
| 91. | Grayville | 0.065% | 0.069%(-0.004)#171 | 0.17%(-0.102)#3,882 |
| 92. | Rochelle | 0.064% | 0.069%(-0.005)#172 | 0.17%(-0.103)#3,883 |
| 93. | Skokie | 0.063% | 0.069%(-0.006)#173 | 0.17%(-0.104)#3,884 |
| 94. | Macomb | 0.059% | 0.069%(-0.010)#174 | 0.17%(-0.108)#3,885 |
| 95. | Rolling Meadows | 0.058% | 0.069%(-0.011)#175 | 0.17%(-0.109)#3,886 |
| 96. | Westmont | 0.058% | 0.069%(-0.011)#176 | 0.17%(-0.109)#3,887 |
| 97. | Washington | 0.056% | 0.069%(-0.013)#177 | 0.17%(-0.111)#3,888 |
| 98. | Winnetka | 0.056% | 0.069%(-0.013)#178 | 0.17%(-0.111)#3,889 |
| 99. | Wheeling | 0.054% | 0.069%(-0.015)#179 | 0.17%(-0.113)#3,890 |
| 100. | Dekalb | 0.052% | 0.069%(-0.017)#180 | 0.17%(-0.115)#3,926 |
Common Questions
What are the Top 10 Cities with the Highest Percentage of Immigrants from Brazil in Illinois?
Top 10 Cities with the Highest Percentage of Immigrants from Brazil in Illinois are:
#1
1.37%
#2
1.17%
#3
0.95%
#4
0.93%
#5
0.92%
#6
0.83%
#7
0.82%
#8
0.78%
#9
0.74%
#10
0.70%
What city has the Highest Percentage of Immigrants from Brazil in Illinois?
Oakwood Hills has the Highest Percentage of Immigrants from Brazil in Illinois with 1.37%.
What is the Percentage of Immigrants from Brazil in the State of Illinois?
Percentage of Immigrants from Brazil in Illinois is 0.069%.
What is the Percentage of Immigrants from Brazil in the United States?
Percentage of Immigrants from Brazil in the United States is 0.17%.