Cities with the Highest Percentage of Households Residing in Condos/Apartments in Massachusetts
RELATED REPORTS & OPTIONS
Condo/Apartment Residency
Massachusetts
Compare Cities
Map of Cities with the Highest Percentage of Households Residing in Condos/Apartments in Massachusetts
0.0%
50.0%
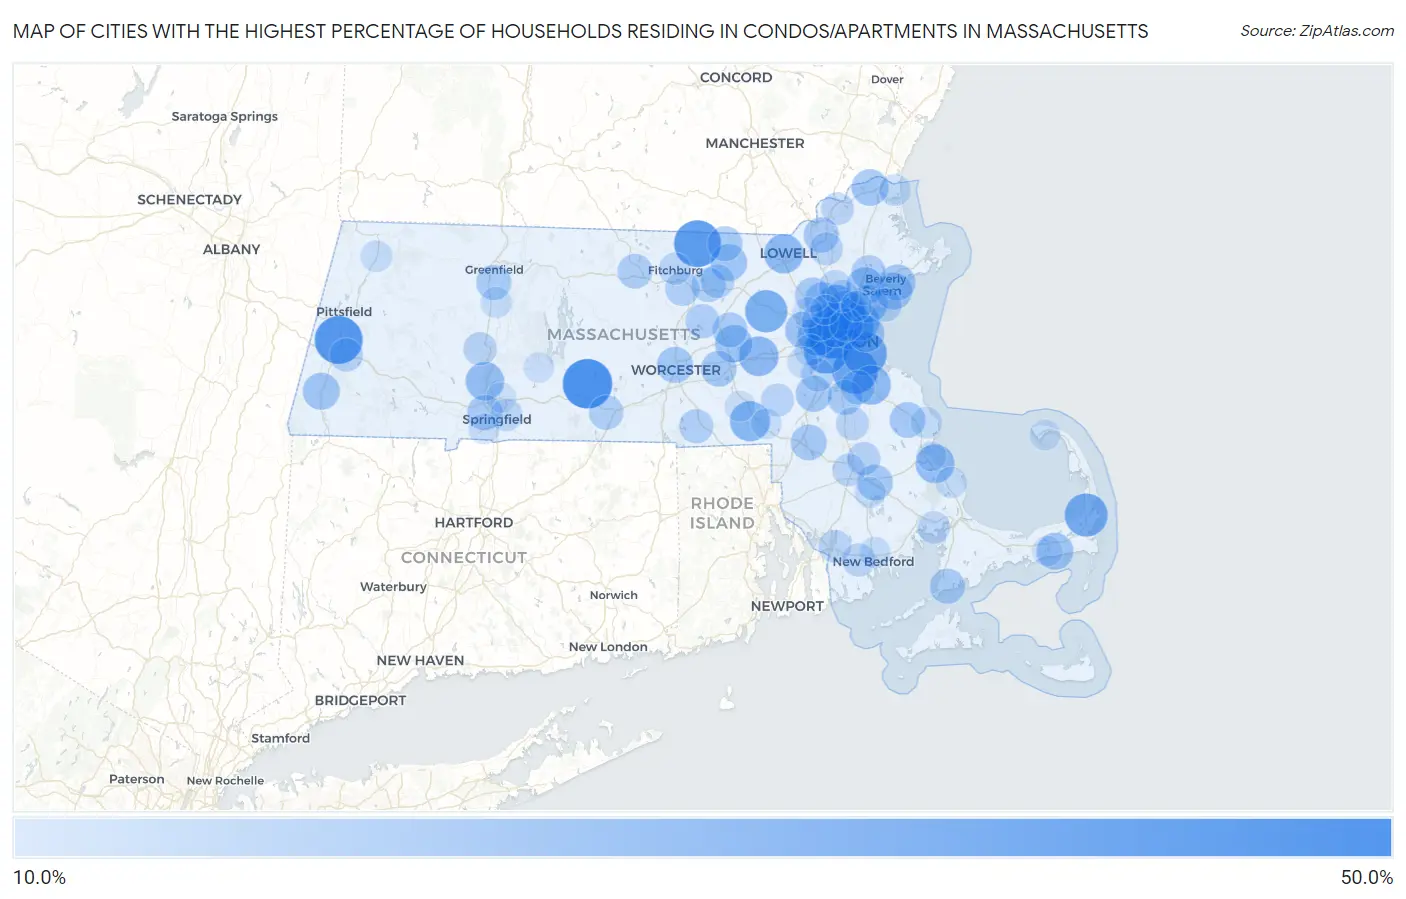
Cities with the Highest Percentage of Households Residing in Condos/Apartments in Massachusetts
| City | Detached Home Residency | vs State | vs National | |
| 1. | Warren | 43.3% | 16.2%(+27.1)#1 | 13.8%(+29.5)#200 |
| 2. | Cambridge | 42.7% | 16.2%(+26.5)#2 | 13.8%(+28.9)#206 |
| 3. | Lenox | 40.4% | 16.2%(+24.2)#3 | 13.8%(+26.6)#249 |
| 4. | Townsend | 38.6% | 16.2%(+22.4)#4 | 13.8%(+24.8)#287 |
| 5. | Quincy | 35.6% | 16.2%(+19.4)#5 | 13.8%(+21.8)#365 |
| 6. | Brookline | 34.8% | 16.2%(+18.6)#6 | 13.8%(+21.0)#389 |
| 7. | Chelsea | 33.6% | 16.2%(+17.4)#7 | 13.8%(+19.8)#420 |
| 8. | Boston | 33.5% | 16.2%(+17.3)#8 | 13.8%(+19.7)#424 |
| 9. | Orleans | 32.0% | 16.2%(+15.8)#9 | 13.8%(+18.2)#478 |
| 10. | Malden | 30.9% | 16.2%(+14.7)#10 | 13.8%(+17.1)#523 |
| 11. | West Concord | 30.5% | 16.2%(+14.3)#11 | 13.8%(+16.7)#552 |
| 12. | West Warren | 30.5% | 16.2%(+14.3)#12 | 13.8%(+16.7)#554 |
| 13. | Stoneham | 27.1% | 16.2%(+10.9)#13 | 13.8%(+13.3)#768 |
| 14. | Bellingham | 27.0% | 16.2%(+10.8)#14 | 13.8%(+13.2)#780 |
| 15. | Framingham | 26.0% | 16.2%(+9.80)#15 | 13.8%(+12.2)#838 |
| 16. | Lowell | 25.4% | 16.2%(+9.20)#16 | 13.8%(+11.6)#881 |
| 17. | Weymouth Town | 25.4% | 16.2%(+9.20)#17 | 13.8%(+11.6)#882 |
| 18. | Revere | 25.0% | 16.2%(+8.80)#18 | 13.8%(+11.2)#915 |
| 19. | Watertown Town | 25.0% | 16.2%(+8.80)#19 | 13.8%(+11.2)#917 |
| 20. | Amherst | 24.9% | 16.2%(+8.70)#20 | 13.8%(+11.1)#930 |
| 21. | Plymouth | 24.6% | 16.2%(+8.40)#21 | 13.8%(+10.8)#969 |
| 22. | Melrose | 24.5% | 16.2%(+8.30)#22 | 13.8%(+10.7)#981 |
| 23. | Holyoke | 24.2% | 16.2%(+8.00)#23 | 13.8%(+10.4)#1,020 |
| 24. | Lynn | 23.0% | 16.2%(+6.80)#24 | 13.8%(+9.20)#1,146 |
| 25. | Medford | 23.0% | 16.2%(+6.80)#25 | 13.8%(+9.20)#1,149 |
| 26. | Peabody | 22.9% | 16.2%(+6.70)#26 | 13.8%(+9.10)#1,159 |
| 27. | Marlborough | 22.1% | 16.2%(+5.90)#27 | 13.8%(+8.30)#1,266 |
| 28. | Somerville | 21.8% | 16.2%(+5.60)#28 | 13.8%(+8.00)#1,302 |
| 29. | Waltham | 21.7% | 16.2%(+5.50)#29 | 13.8%(+7.90)#1,316 |
| 30. | Great Barrington | 21.4% | 16.2%(+5.20)#30 | 13.8%(+7.60)#1,365 |
| 31. | Dennis Port | 21.3% | 16.2%(+5.10)#31 | 13.8%(+7.50)#1,380 |
| 32. | Salem | 21.2% | 16.2%(+5.00)#32 | 13.8%(+7.40)#1,388 |
| 33. | Arlington | 21.1% | 16.2%(+4.90)#33 | 13.8%(+7.30)#1,410 |
| 34. | Groton | 21.0% | 16.2%(+4.80)#34 | 13.8%(+7.20)#1,436 |
| 35. | Winthrop Town | 20.9% | 16.2%(+4.70)#35 | 13.8%(+7.10)#1,445 |
| 36. | Amesbury Town | 20.9% | 16.2%(+4.70)#36 | 13.8%(+7.10)#1,447 |
| 37. | Worcester | 20.3% | 16.2%(+4.10)#37 | 13.8%(+6.50)#1,520 |
| 38. | Norwood | 20.1% | 16.2%(+3.90)#38 | 13.8%(+6.30)#1,556 |
| 39. | Beverly | 20.0% | 16.2%(+3.80)#39 | 13.8%(+6.20)#1,574 |
| 40. | Mansfield Center | 19.6% | 16.2%(+3.40)#40 | 13.8%(+5.80)#1,657 |
| 41. | Woburn | 19.5% | 16.2%(+3.30)#41 | 13.8%(+5.70)#1,667 |
| 42. | Middleborough Center | 19.5% | 16.2%(+3.30)#42 | 13.8%(+5.70)#1,672 |
| 43. | Westborough | 19.3% | 16.2%(+3.10)#43 | 13.8%(+5.50)#1,718 |
| 44. | North Pembroke | 19.3% | 16.2%(+3.10)#44 | 13.8%(+5.50)#1,719 |
| 45. | West Springfield Town | 19.0% | 16.2%(+2.80)#45 | 13.8%(+5.20)#1,763 |
| 46. | Lawrence | 18.7% | 16.2%(+2.50)#46 | 13.8%(+4.90)#1,809 |
| 47. | Burlington | 18.5% | 16.2%(+2.30)#47 | 13.8%(+4.70)#1,852 |
| 48. | Falmouth | 18.4% | 16.2%(+2.20)#48 | 13.8%(+4.60)#1,882 |
| 49. | Pepperell | 18.4% | 16.2%(+2.20)#49 | 13.8%(+4.60)#1,885 |
| 50. | Deerfield | 18.4% | 16.2%(+2.20)#50 | 13.8%(+4.60)#1,889 |
| 51. | Randolph Town | 18.3% | 16.2%(+2.10)#51 | 13.8%(+4.50)#1,899 |
| 52. | Hudson | 18.2% | 16.2%(+2.00)#52 | 13.8%(+4.40)#1,923 |
| 53. | Gardner | 17.8% | 16.2%(+1.60)#53 | 13.8%(+4.00)#1,982 |
| 54. | Danvers | 17.5% | 16.2%(+1.30)#54 | 13.8%(+3.70)#2,047 |
| 55. | Fiskdale | 17.4% | 16.2%(+1.20)#55 | 13.8%(+3.60)#2,080 |
| 56. | Shirley | 17.1% | 16.2%(+0.900)#56 | 13.8%(+3.30)#2,157 |
| 57. | Leominster | 17.0% | 16.2%(+0.800)#57 | 13.8%(+3.20)#2,163 |
| 58. | Clinton | 16.8% | 16.2%(+0.600)#58 | 13.8%(+3.00)#2,229 |
| 59. | East Douglas | 16.8% | 16.2%(+0.600)#59 | 13.8%(+3.00)#2,233 |
| 60. | Braintree Town | 16.5% | 16.2%(+0.300)#60 | 13.8%(+2.70)#2,286 |
| 61. | Devens | 16.2% | 16.2%(=0.000)#61 | 13.8%(+2.40)#2,373 |
| 62. | Bridgewater Town | 15.6% | 16.2%(-0.600)#62 | 13.8%(+1.80)#2,482 |
| 63. | Lee | 15.5% | 16.2%(-0.700)#63 | 13.8%(+1.70)#2,528 |
| 64. | Swampscott | 15.4% | 16.2%(-0.800)#64 | 13.8%(+1.60)#2,548 |
| 65. | Everett | 15.3% | 16.2%(-0.900)#65 | 13.8%(+1.50)#2,571 |
| 66. | Northampton | 15.3% | 16.2%(-0.900)#66 | 13.8%(+1.50)#2,576 |
| 67. | Smith Mills | 15.3% | 16.2%(-0.900)#67 | 13.8%(+1.50)#2,588 |
| 68. | Andover | 15.2% | 16.2%(-1.00)#68 | 13.8%(+1.40)#2,617 |
| 69. | Dedham | 15.0% | 16.2%(-1.20)#69 | 13.8%(+1.20)#2,677 |
| 70. | Brockton | 14.8% | 16.2%(-1.40)#70 | 13.8%(+1.00)#2,726 |
| 71. | Millis Clicquot | 14.7% | 16.2%(-1.50)#71 | 13.8%(+0.900)#2,776 |
| 72. | Haverhill | 14.5% | 16.2%(-1.70)#72 | 13.8%(+0.700)#2,822 |
| 73. | Raynham Center | 14.5% | 16.2%(-1.70)#73 | 13.8%(+0.700)#2,840 |
| 74. | Fall River | 14.4% | 16.2%(-1.80)#74 | 13.8%(+0.600)#2,847 |
| 75. | Onset | 14.1% | 16.2%(-2.10)#75 | 13.8%(+0.300)#2,980 |
| 76. | Springfield | 13.9% | 16.2%(-2.30)#76 | 13.8%(+0.100)#3,014 |
| 77. | Wakefield | 13.8% | 16.2%(-2.40)#77 | 13.8%(=0.000)#3,052 |
| 78. | Reading | 13.8% | 16.2%(-2.40)#78 | 13.8%(=0.000)#3,054 |
| 79. | Fitchburg | 13.5% | 16.2%(-2.70)#79 | 13.8%(-0.300)#3,162 |
| 80. | North Attleborough | 13.0% | 16.2%(-3.20)#80 | 13.8%(-0.800)#3,352 |
| 81. | Salisbury | 12.9% | 16.2%(-3.30)#81 | 13.8%(-0.900)#3,389 |
| 82. | Newton | 12.5% | 16.2%(-3.70)#82 | 13.8%(-1.30)#3,526 |
| 83. | Adams | 12.3% | 16.2%(-3.90)#83 | 13.8%(-1.50)#3,636 |
| 84. | Marshfield | 12.3% | 16.2%(-3.90)#84 | 13.8%(-1.50)#3,638 |
| 85. | The Pinehills | 12.2% | 16.2%(-4.00)#85 | 13.8%(-1.60)#3,691 |
| 86. | South Deerfield | 12.0% | 16.2%(-4.20)#86 | 13.8%(-1.80)#3,792 |
| 87. | New Bedford | 11.7% | 16.2%(-4.50)#87 | 13.8%(-2.10)#3,905 |
| 88. | North Lakeville | 11.5% | 16.2%(-4.70)#88 | 13.8%(-2.30)#4,019 |
| 89. | Franklin Town | 11.3% | 16.2%(-4.90)#89 | 13.8%(-2.50)#4,073 |
| 90. | Provincetown | 11.3% | 16.2%(-4.90)#90 | 13.8%(-2.50)#4,106 |
| 91. | Agawam Town | 11.2% | 16.2%(-5.00)#91 | 13.8%(-2.60)#4,134 |
| 92. | Milford | 11.2% | 16.2%(-5.00)#92 | 13.8%(-2.60)#4,135 |
| 93. | Needham | 11.0% | 16.2%(-5.20)#93 | 13.8%(-2.80)#4,217 |
| 94. | Lexington | 10.7% | 16.2%(-5.50)#94 | 13.8%(-3.10)#4,368 |
| 95. | Saugus | 10.7% | 16.2%(-5.50)#95 | 13.8%(-3.10)#4,371 |
| 96. | West Dennis | 10.6% | 16.2%(-5.60)#96 | 13.8%(-3.20)#4,453 |
| 97. | Belchertown | 10.4% | 16.2%(-5.80)#97 | 13.8%(-3.40)#4,559 |
| 98. | Chicopee | 10.2% | 16.2%(-6.00)#98 | 13.8%(-3.60)#4,620 |
| 99. | Winchester | 10.2% | 16.2%(-6.00)#99 | 13.8%(-3.60)#4,625 |
| 100. | North Plymouth | 10.1% | 16.2%(-6.10)#100 | 13.8%(-3.70)#4,691 |
Common Questions
What are the Top 10 Cities with the Highest Percentage of Households Residing in Condos/Apartments in Massachusetts?
Top 10 Cities with the Highest Percentage of Households Residing in Condos/Apartments in Massachusetts are:
What city has the Highest Percentage of Households Residing in Condos/Apartments in Massachusetts?
Warren has the Highest Percentage of Households Residing in Condos/Apartments in Massachusetts with 43.3%.
What is the Percentage of Households Residing in Condos/Apartments in the State of Massachusetts?
Percentage of Households Residing in Condos/Apartments in Massachusetts is 16.2%.
What is the Percentage of Households Residing in Condos/Apartments in the United States?
Percentage of Households Residing in Condos/Apartments in the United States is 13.8%.