Cities with the Highest Percentage of Households Residing in Condos/Apartments in Connecticut
RELATED REPORTS & OPTIONS
Condo/Apartment Residency
Connecticut
Compare Cities
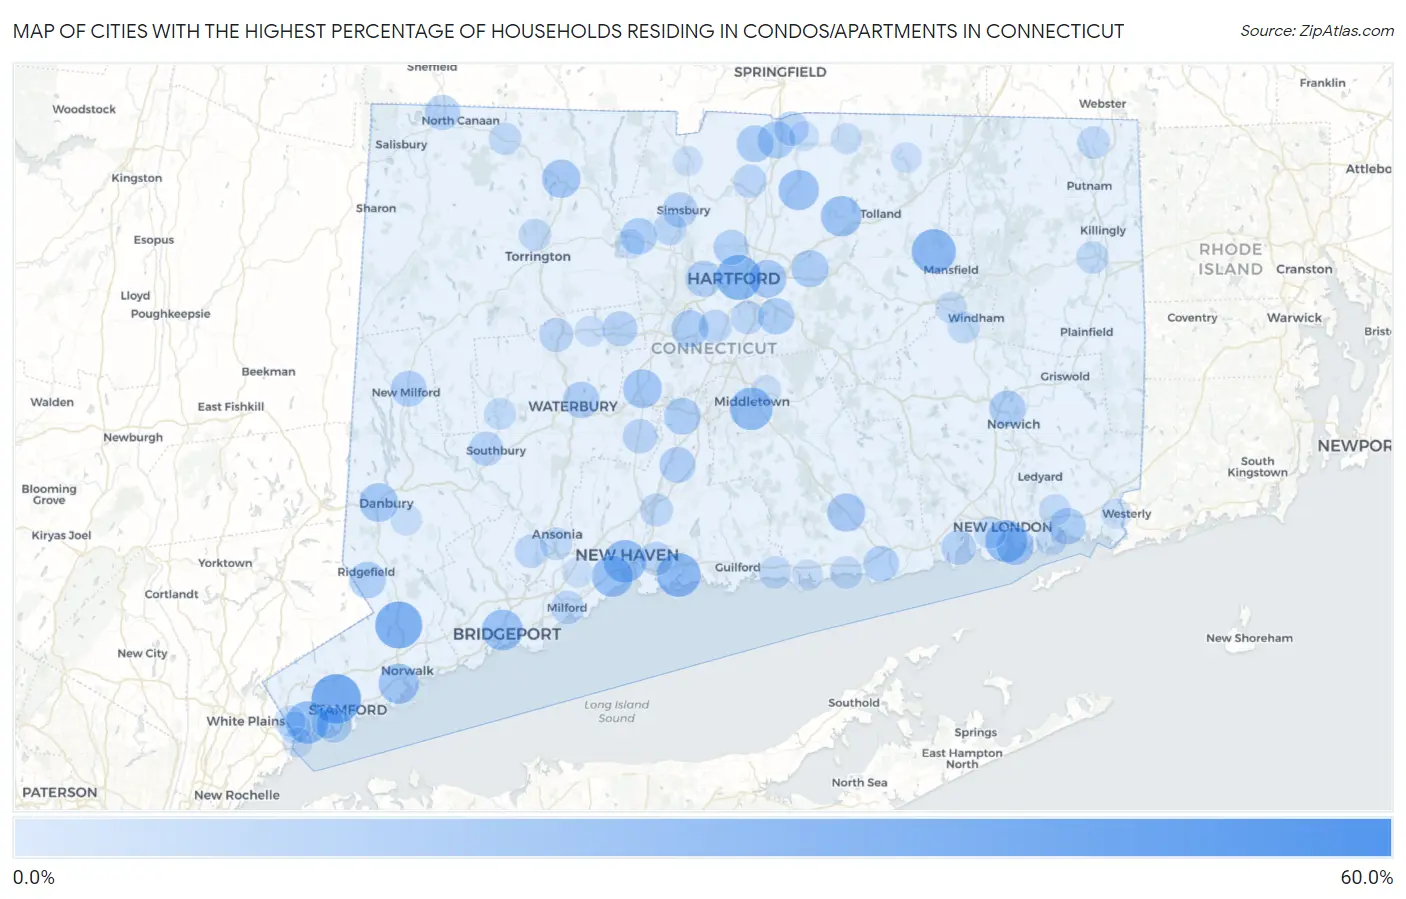
Map of Cities with the Highest Percentage of Households Residing in Condos/Apartments in Connecticut
0.0%
60.0%
Cities with the Highest Percentage of Households Residing in Condos/Apartments in Connecticut
| City | Detached Home Residency | vs State | vs National | |
| 1. | Hawleyville | 52.6% | 12.8%(+39.8)#1 | 13.8%(+38.8)#108 |
| 2. | Pleasant Valley | 40.8% | 12.8%(+28.0)#2 | 13.8%(+27.0)#242 |
| 3. | Stamford | 36.7% | 12.8%(+23.9)#3 | 13.8%(+22.9)#334 |
| 4. | Wilton Center | 32.6% | 12.8%(+19.8)#4 | 13.8%(+18.8)#460 |
| 5. | Route 7 Gateway | 31.8% | 12.8%(+19.0)#5 | 13.8%(+18.0)#490 |
| 6. | Hartford | 29.4% | 12.8%(+16.6)#6 | 13.8%(+15.6)#599 |
| 7. | Storrs | 27.8% | 12.8%(+15.0)#7 | 13.8%(+14.0)#702 |
| 8. | Branford Center | 27.2% | 12.8%(+14.4)#8 | 13.8%(+13.4)#757 |
| 9. | Stratford Downtown | 27.2% | 12.8%(+14.4)#9 | 13.8%(+13.4)#762 |
| 10. | Middletown | 25.2% | 12.8%(+12.4)#10 | 13.8%(+11.4)#906 |
| 11. | New Haven | 25.1% | 12.8%(+12.3)#11 | 13.8%(+11.3)#908 |
| 12. | Greenwich | 24.9% | 12.8%(+12.1)#12 | 13.8%(+11.1)#935 |
| 13. | Jewett City Borough | 24.6% | 12.8%(+11.8)#13 | 13.8%(+10.8)#972 |
| 14. | New London | 24.4% | 12.8%(+11.6)#14 | 13.8%(+10.6)#996 |
| 15. | West Haven | 22.8% | 12.8%(+10.00)#15 | 13.8%(+9.00)#1,174 |
| 16. | Bridgeport | 22.4% | 12.8%(+9.60)#16 | 13.8%(+8.60)#1,219 |
| 17. | Rockville | 21.8% | 12.8%(+9.00)#17 | 13.8%(+8.00)#1,308 |
| 18. | Broad Brook | 21.5% | 12.8%(+8.70)#18 | 13.8%(+7.70)#1,352 |
| 19. | Norwalk | 21.1% | 12.8%(+8.30)#19 | 13.8%(+7.30)#1,408 |
| 20. | South Wilton | 20.3% | 12.8%(+7.50)#20 | 13.8%(+6.50)#1,531 |
| 21. | Darien Downtown | 19.1% | 12.8%(+6.30)#21 | 13.8%(+5.30)#1,759 |
| 22. | Plantsville | 19.0% | 12.8%(+6.20)#22 | 13.8%(+5.20)#1,770 |
| 23. | Danbury | 18.7% | 12.8%(+5.90)#23 | 13.8%(+4.90)#1,810 |
| 24. | Bantam Borough | 18.7% | 12.8%(+5.90)#24 | 13.8%(+4.90)#1,824 |
| 25. | Winsted | 18.3% | 12.8%(+5.50)#25 | 13.8%(+4.50)#1,907 |
| 26. | Deep River Center | 17.6% | 12.8%(+4.80)#26 | 13.8%(+3.80)#2,032 |
| 27. | East Hartford | 17.3% | 12.8%(+4.50)#27 | 13.8%(+3.50)#2,092 |
| 28. | Groton | 17.2% | 12.8%(+4.40)#28 | 13.8%(+3.40)#2,127 |
| 29. | New Britain | 16.3% | 12.8%(+3.50)#29 | 13.8%(+2.50)#2,335 |
| 30. | Manchester | 16.3% | 12.8%(+3.50)#30 | 13.8%(+2.50)#2,337 |
| 31. | Thompsonville | 16.1% | 12.8%(+3.30)#31 | 13.8%(+2.30)#2,388 |
| 32. | Suffield Depot | 15.6% | 12.8%(+2.80)#32 | 13.8%(+1.80)#2,495 |
| 33. | Meriden | 15.4% | 12.8%(+2.60)#33 | 13.8%(+1.60)#2,538 |
| 34. | Norwich | 15.3% | 12.8%(+2.50)#34 | 13.8%(+1.50)#2,574 |
| 35. | Ridgefield | 15.3% | 12.8%(+2.50)#35 | 13.8%(+1.50)#2,584 |
| 36. | Mystic | 15.3% | 12.8%(+2.50)#36 | 13.8%(+1.50)#2,589 |
| 37. | Waterbury | 15.1% | 12.8%(+2.30)#37 | 13.8%(+1.30)#2,637 |
| 38. | Glastonbury Center | 14.9% | 12.8%(+2.10)#38 | 13.8%(+1.10)#2,708 |
| 39. | Canton Valley | 14.8% | 12.8%(+2.00)#39 | 13.8%(+1.00)#2,753 |
| 40. | West Hartford | 14.5% | 12.8%(+1.70)#40 | 13.8%(+0.700)#2,823 |
| 41. | Wallingford Center | 14.5% | 12.8%(+1.70)#41 | 13.8%(+0.700)#2,832 |
| 42. | New Milford | 14.2% | 12.8%(+1.40)#42 | 13.8%(+0.400)#2,944 |
| 43. | Old Saybrook Center | 13.8% | 12.8%(+1.00)#43 | 13.8%(=0.000)#3,075 |
| 44. | Lordship | 13.7% | 12.8%(+0.900)#44 | 13.8%(-0.100)#3,102 |
| 45. | Blue Hills | 13.4% | 12.8%(+0.600)#45 | 13.8%(-0.400)#3,211 |
| 46. | Canaan | 13.1% | 12.8%(+0.300)#46 | 13.8%(-0.700)#3,337 |
| 47. | Old Greenwich | 13.0% | 12.8%(+0.200)#47 | 13.8%(-0.800)#3,361 |
| 48. | Bristol | 12.8% | 12.8%(=0.000)#48 | 13.8%(-1.00)#3,410 |
| 49. | Simsbury Center | 12.8% | 12.8%(=0.000)#49 | 13.8%(-1.00)#3,432 |
| 50. | New Canaan | 12.4% | 12.8%(-0.400)#50 | 13.8%(-1.40)#3,594 |
| 51. | Niantic | 12.3% | 12.8%(-0.500)#51 | 13.8%(-1.50)#3,641 |
| 52. | Mechanicsville | 12.3% | 12.8%(-0.500)#52 | 13.8%(-1.50)#3,657 |
| 53. | Sherwood Manor | 12.0% | 12.8%(-0.800)#53 | 13.8%(-1.80)#3,780 |
| 54. | Cheshire Village | 11.8% | 12.8%(-1.000)#54 | 13.8%(-2.00)#3,886 |
| 55. | Heritage Village | 11.6% | 12.8%(-1.20)#55 | 13.8%(-2.20)#3,981 |
| 56. | Thomaston | 11.2% | 12.8%(-1.60)#56 | 13.8%(-2.60)#4,166 |
| 57. | Trumbull Center | 10.8% | 12.8%(-2.00)#57 | 13.8%(-3.00)#4,324 |
| 58. | Woodmont Borough | 10.6% | 12.8%(-2.20)#58 | 13.8%(-3.20)#4,456 |
| 59. | East Haven | 10.5% | 12.8%(-2.30)#59 | 13.8%(-3.30)#4,472 |
| 60. | Wethersfield | 10.4% | 12.8%(-2.40)#60 | 13.8%(-3.40)#4,533 |
| 61. | Windsor Locks | 10.2% | 12.8%(-2.60)#61 | 13.8%(-3.60)#4,633 |
| 62. | Westport | 10.2% | 12.8%(-2.60)#62 | 13.8%(-3.60)#4,651 |
| 63. | Milford City Balance | 10.0% | 12.8%(-2.80)#63 | 13.8%(-3.80)#4,727 |
| 64. | Shelton | 9.9% | 12.8%(-2.90)#64 | 13.8%(-3.90)#4,796 |
| 65. | Stonington Borough | 9.8% | 12.8%(-3.00)#65 | 13.8%(-4.00)#4,892 |
| 66. | Newington | 9.6% | 12.8%(-3.20)#66 | 13.8%(-4.20)#4,959 |
| 67. | North Haven | 9.6% | 12.8%(-3.20)#67 | 13.8%(-4.20)#4,961 |
| 68. | Weatogue | 9.5% | 12.8%(-3.30)#68 | 13.8%(-4.30)#5,042 |
| 69. | North Grosvenor Dale | 9.1% | 12.8%(-3.70)#69 | 13.8%(-4.70)#5,288 |
| 70. | Derby | 8.9% | 12.8%(-3.90)#70 | 13.8%(-4.90)#5,394 |
| 71. | Westbrook Center | 8.9% | 12.8%(-3.90)#71 | 13.8%(-4.90)#5,417 |
| 72. | East Brooklyn | 8.8% | 12.8%(-4.00)#72 | 13.8%(-5.00)#5,483 |
| 73. | Torrington | 8.6% | 12.8%(-4.20)#73 | 13.8%(-5.20)#5,582 |
| 74. | Norfolk | 8.6% | 12.8%(-4.20)#74 | 13.8%(-5.20)#5,643 |
| 75. | Madison Center | 8.5% | 12.8%(-4.30)#75 | 13.8%(-5.30)#5,706 |
| 76. | Naugatuck Borough | 8.3% | 12.8%(-4.50)#76 | 13.8%(-5.50)#5,786 |
| 77. | Waterford | 8.0% | 12.8%(-4.80)#77 | 13.8%(-5.80)#6,005 |
| 78. | Riverside | 7.9% | 12.8%(-4.90)#78 | 13.8%(-5.90)#6,056 |
| 79. | South Windham | 7.9% | 12.8%(-4.90)#79 | 13.8%(-5.90)#6,084 |
| 80. | Woodbury Center | 7.8% | 12.8%(-5.00)#80 | 13.8%(-6.00)#6,146 |
| 81. | Old Mystic | 7.7% | 12.8%(-5.10)#81 | 13.8%(-6.10)#6,197 |
| 82. | Pemberwick | 7.7% | 12.8%(-5.10)#82 | 13.8%(-6.10)#6,198 |
| 83. | Cornwall Bridge | 7.3% | 12.8%(-5.50)#83 | 13.8%(-6.50)#6,511 |
| 84. | Willimantic | 7.1% | 12.8%(-5.70)#84 | 13.8%(-6.70)#6,601 |
| 85. | Tashua | 7.0% | 12.8%(-5.80)#85 | 13.8%(-6.80)#6,715 |
| 86. | Glenville | 6.8% | 12.8%(-6.00)#86 | 13.8%(-7.00)#6,871 |
| 87. | Noank | 6.7% | 12.8%(-6.10)#87 | 13.8%(-7.10)#6,965 |
| 88. | Bethel | 6.6% | 12.8%(-6.20)#88 | 13.8%(-7.20)#7,006 |
| 89. | Somers | 6.6% | 12.8%(-6.20)#89 | 13.8%(-7.20)#7,036 |
| 90. | Clinton | 6.2% | 12.8%(-6.60)#90 | 13.8%(-7.60)#7,356 |
| 91. | Terryville | 5.9% | 12.8%(-6.90)#91 | 13.8%(-7.90)#7,562 |
| 92. | Stafford Springs | 5.9% | 12.8%(-6.90)#92 | 13.8%(-7.90)#7,565 |
| 93. | Pawcatuck | 5.8% | 12.8%(-7.00)#93 | 13.8%(-8.00)#7,636 |
| 94. | Orange | 5.1% | 12.8%(-7.70)#94 | 13.8%(-8.70)#8,247 |
| 95. | Hazardville | 5.1% | 12.8%(-7.70)#95 | 13.8%(-8.70)#8,266 |
| 96. | Oronoque | 5.1% | 12.8%(-7.70)#96 | 13.8%(-8.70)#8,278 |
| 97. | Byram | 5.0% | 12.8%(-7.80)#97 | 13.8%(-8.80)#8,365 |
| 98. | Salmon Brook | 5.0% | 12.8%(-7.80)#98 | 13.8%(-8.80)#8,392 |
| 99. | Portland | 4.8% | 12.8%(-8.00)#99 | 13.8%(-9.00)#8,545 |
| 100. | Collinsville | 4.8% | 12.8%(-8.00)#100 | 13.8%(-9.00)#8,564 |
Common Questions
What are the Top 10 Cities with the Highest Percentage of Households Residing in Condos/Apartments in Connecticut?
Top 10 Cities with the Highest Percentage of Households Residing in Condos/Apartments in Connecticut are:
#1
36.7%
#2
32.6%
#3
29.4%
#4
27.8%
#5
27.2%
#6
25.2%
#7
25.1%
#8
24.9%
#9
24.4%
#10
22.8%
What city has the Highest Percentage of Households Residing in Condos/Apartments in Connecticut?
Stamford has the Highest Percentage of Households Residing in Condos/Apartments in Connecticut with 36.7%.
What is the Percentage of Households Residing in Condos/Apartments in the State of Connecticut?
Percentage of Households Residing in Condos/Apartments in Connecticut is 12.8%.
What is the Percentage of Households Residing in Condos/Apartments in the United States?
Percentage of Households Residing in Condos/Apartments in the United States is 13.8%.