Cities with the Highest Percentage of Households Residing in Condos/Apartments in Tennessee
RELATED REPORTS & OPTIONS
Condo/Apartment Residency
Tennessee
Compare Cities
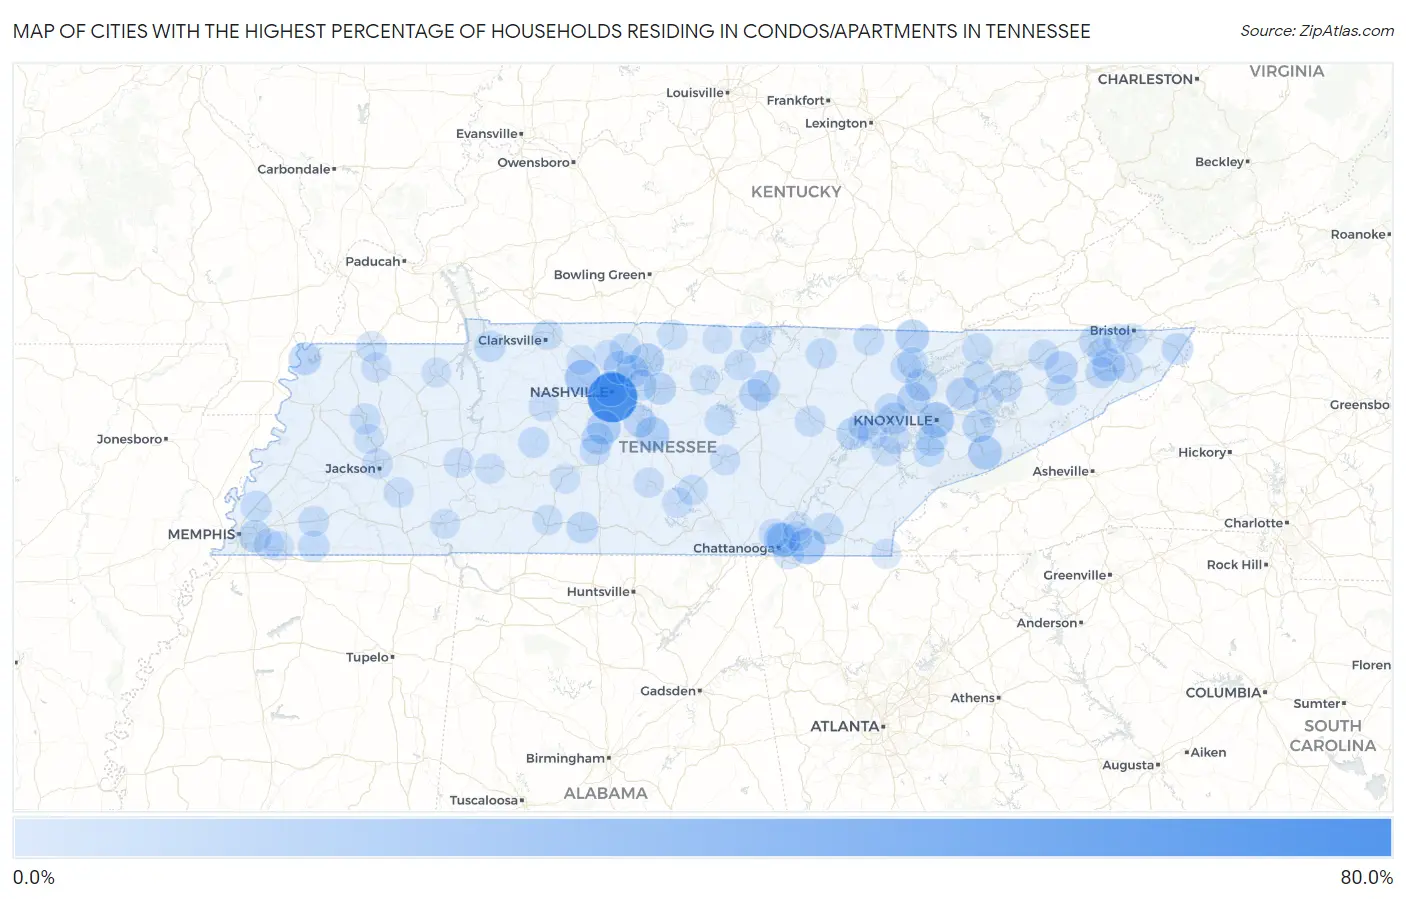
Map of Cities with the Highest Percentage of Households Residing in Condos/Apartments in Tennessee
0.0%
80.0%
Cities with the Highest Percentage of Households Residing in Condos/Apartments in Tennessee
| City | Detached Home Residency | vs State | vs National | |
| 1. | Berry Hill | 78.5% | 8.5%(+70.0)#1 | 13.8%(+64.7)#29 |
| 2. | Collegedale | 24.8% | 8.5%(+16.3)#2 | 13.8%(+11.0)#942 |
| 3. | Knoxville | 24.2% | 8.5%(+15.7)#3 | 13.8%(+10.4)#1,017 |
| 4. | Ashland City | 23.9% | 8.5%(+15.4)#4 | 13.8%(+10.1)#1,053 |
| 5. | Nashville | 23.6% | 8.5%(+15.1)#5 | 13.8%(+9.80)#1,078 |
| 6. | Franklin | 19.2% | 8.5%(+10.7)#6 | 13.8%(+5.40)#1,732 |
| 7. | Gatlinburg | 18.9% | 8.5%(+10.4)#7 | 13.8%(+5.10)#1,783 |
| 8. | Murfreesboro | 18.8% | 8.5%(+10.3)#8 | 13.8%(+5.00)#1,789 |
| 9. | Russellville | 18.6% | 8.5%(+10.1)#9 | 13.8%(+4.80)#1,844 |
| 10. | Chattanooga | 18.5% | 8.5%(+10.00)#10 | 13.8%(+4.70)#1,848 |
| 11. | Jellico | 17.4% | 8.5%(+8.90)#11 | 13.8%(+3.60)#2,081 |
| 12. | Gallatin | 16.7% | 8.5%(+8.20)#12 | 13.8%(+2.90)#2,243 |
| 13. | Goodlettsville | 15.5% | 8.5%(+7.00)#13 | 13.8%(+1.70)#2,509 |
| 14. | Johnson City | 15.0% | 8.5%(+6.50)#14 | 13.8%(+1.20)#2,668 |
| 15. | Blaine | 15.0% | 8.5%(+6.50)#15 | 13.8%(+1.20)#2,688 |
| 16. | Baileyton | 14.2% | 8.5%(+5.70)#16 | 13.8%(+0.400)#2,961 |
| 17. | Clinton | 14.0% | 8.5%(+5.50)#17 | 13.8%(+0.200)#2,995 |
| 18. | Sevierville | 13.9% | 8.5%(+5.40)#18 | 13.8%(+0.100)#3,023 |
| 19. | Tiptonville | 13.9% | 8.5%(+5.40)#19 | 13.8%(+0.100)#3,036 |
| 20. | Memphis | 13.5% | 8.5%(+5.00)#20 | 13.8%(-0.300)#3,154 |
| 21. | Hendersonville | 13.4% | 8.5%(+4.90)#21 | 13.8%(-0.400)#3,185 |
| 22. | Smyrna | 13.3% | 8.5%(+4.80)#22 | 13.8%(-0.500)#3,232 |
| 23. | Oak Ridge | 13.2% | 8.5%(+4.70)#23 | 13.8%(-0.600)#3,281 |
| 24. | Red Bank | 13.1% | 8.5%(+4.60)#24 | 13.8%(-0.700)#3,318 |
| 25. | Rarity Bay | 13.1% | 8.5%(+4.60)#25 | 13.8%(-0.700)#3,343 |
| 26. | Norris | 12.9% | 8.5%(+4.40)#26 | 13.8%(-0.900)#3,401 |
| 27. | Lebanon | 12.2% | 8.5%(+3.70)#27 | 13.8%(-1.60)#3,671 |
| 28. | Algood | 12.2% | 8.5%(+3.70)#28 | 13.8%(-1.60)#3,694 |
| 29. | Cookeville | 11.8% | 8.5%(+3.30)#29 | 13.8%(-2.00)#3,865 |
| 30. | Thompson S Station | 11.7% | 8.5%(+3.20)#30 | 13.8%(-2.10)#3,923 |
| 31. | Rockwood | 11.5% | 8.5%(+3.00)#31 | 13.8%(-2.30)#4,015 |
| 32. | Morristown | 11.1% | 8.5%(+2.60)#32 | 13.8%(-2.70)#4,179 |
| 33. | Pulaski | 11.0% | 8.5%(+2.50)#33 | 13.8%(-2.80)#4,230 |
| 34. | Jonesborough | 10.7% | 8.5%(+2.20)#34 | 13.8%(-3.10)#4,390 |
| 35. | Kingsport | 10.5% | 8.5%(+2.00)#35 | 13.8%(-3.30)#4,469 |
| 36. | Mountain City | 10.3% | 8.5%(+1.80)#36 | 13.8%(-3.50)#4,603 |
| 37. | Cleveland | 10.1% | 8.5%(+1.60)#37 | 13.8%(-3.70)#4,662 |
| 38. | Alcoa | 10.1% | 8.5%(+1.60)#38 | 13.8%(-3.70)#4,674 |
| 39. | Harriman | 9.5% | 8.5%(+1.000)#39 | 13.8%(-4.30)#5,029 |
| 40. | Dover | 9.5% | 8.5%(+1.000)#40 | 13.8%(-4.30)#5,046 |
| 41. | Mount Juliet | 9.3% | 8.5%(+0.800)#41 | 13.8%(-4.50)#5,119 |
| 42. | Maryville | 9.1% | 8.5%(+0.600)#42 | 13.8%(-4.70)#5,246 |
| 43. | Jacksboro | 8.8% | 8.5%(+0.300)#43 | 13.8%(-5.00)#5,477 |
| 44. | Moscow | 8.8% | 8.5%(+0.300)#44 | 13.8%(-5.00)#5,493 |
| 45. | Greeneville | 8.3% | 8.5%(-0.200)#45 | 13.8%(-5.50)#5,790 |
| 46. | White House | 8.3% | 8.5%(-0.200)#46 | 13.8%(-5.50)#5,792 |
| 47. | Millington | 8.3% | 8.5%(-0.200)#47 | 13.8%(-5.50)#5,794 |
| 48. | East Ridge | 8.1% | 8.5%(-0.400)#48 | 13.8%(-5.70)#5,910 |
| 49. | Spring Hill | 8.0% | 8.5%(-0.500)#49 | 13.8%(-5.80)#5,972 |
| 50. | Centerville | 8.0% | 8.5%(-0.500)#50 | 13.8%(-5.80)#6,004 |
| 51. | Smithville | 7.9% | 8.5%(-0.600)#51 | 13.8%(-5.90)#6,063 |
| 52. | Jamestown | 7.9% | 8.5%(-0.600)#52 | 13.8%(-5.90)#6,081 |
| 53. | Celina | 7.9% | 8.5%(-0.600)#53 | 13.8%(-5.90)#6,082 |
| 54. | Trenton | 7.7% | 8.5%(-0.800)#54 | 13.8%(-6.10)#6,193 |
| 55. | Somerville | 7.7% | 8.5%(-0.800)#55 | 13.8%(-6.10)#6,196 |
| 56. | Oneida | 7.6% | 8.5%(-0.900)#56 | 13.8%(-6.20)#6,260 |
| 57. | Oliver Springs | 7.6% | 8.5%(-0.900)#57 | 13.8%(-6.20)#6,261 |
| 58. | Crossville | 7.5% | 8.5%(-1.00)#58 | 13.8%(-6.30)#6,310 |
| 59. | Bristol | 7.4% | 8.5%(-1.10)#59 | 13.8%(-6.40)#6,377 |
| 60. | Tazewell | 7.4% | 8.5%(-1.10)#60 | 13.8%(-6.40)#6,406 |
| 61. | Rutledge | 7.4% | 8.5%(-1.10)#61 | 13.8%(-6.40)#6,412 |
| 62. | Gainesboro | 7.3% | 8.5%(-1.20)#62 | 13.8%(-6.50)#6,497 |
| 63. | La Follette | 6.9% | 8.5%(-1.60)#63 | 13.8%(-6.90)#6,771 |
| 64. | Rogersville | 6.9% | 8.5%(-1.60)#64 | 13.8%(-6.90)#6,780 |
| 65. | Jackson | 6.6% | 8.5%(-1.90)#65 | 13.8%(-7.20)#6,985 |
| 66. | Manchester | 6.6% | 8.5%(-1.90)#66 | 13.8%(-7.20)#7,004 |
| 67. | Lenoir City | 6.5% | 8.5%(-2.00)#67 | 13.8%(-7.30)#7,096 |
| 68. | Lawrenceburg | 6.3% | 8.5%(-2.20)#68 | 13.8%(-7.50)#7,249 |
| 69. | South Fulton | 6.3% | 8.5%(-2.20)#69 | 13.8%(-7.50)#7,284 |
| 70. | Tullahoma | 6.2% | 8.5%(-2.30)#70 | 13.8%(-7.60)#7,325 |
| 71. | Dickson | 6.2% | 8.5%(-2.30)#71 | 13.8%(-7.60)#7,328 |
| 72. | Mcminnville | 6.1% | 8.5%(-2.40)#72 | 13.8%(-7.70)#7,398 |
| 73. | Clarksville | 6.0% | 8.5%(-2.50)#73 | 13.8%(-7.80)#7,452 |
| 74. | Oak Grove Cdp Washington County | 6.0% | 8.5%(-2.50)#74 | 13.8%(-7.80)#7,486 |
| 75. | Westmoreland | 6.0% | 8.5%(-2.50)#75 | 13.8%(-7.80)#7,497 |
| 76. | Signal Mountain | 5.9% | 8.5%(-2.60)#76 | 13.8%(-7.90)#7,551 |
| 77. | Jefferson City | 5.8% | 8.5%(-2.70)#77 | 13.8%(-8.00)#7,626 |
| 78. | Parsons | 5.8% | 8.5%(-2.70)#78 | 13.8%(-8.00)#7,656 |
| 79. | Shelbyville | 5.7% | 8.5%(-2.80)#79 | 13.8%(-8.10)#7,692 |
| 80. | Germantown | 5.6% | 8.5%(-2.90)#80 | 13.8%(-8.20)#7,781 |
| 81. | Henderson | 5.6% | 8.5%(-2.90)#81 | 13.8%(-8.20)#7,815 |
| 82. | Kingston | 5.6% | 8.5%(-2.90)#82 | 13.8%(-8.20)#7,816 |
| 83. | Spurgeon | 5.6% | 8.5%(-2.90)#83 | 13.8%(-8.20)#7,819 |
| 84. | Elizabethton | 5.4% | 8.5%(-3.10)#84 | 13.8%(-8.40)#7,953 |
| 85. | Martin | 5.4% | 8.5%(-3.10)#85 | 13.8%(-8.40)#7,958 |
| 86. | Collierville | 5.3% | 8.5%(-3.20)#86 | 13.8%(-8.50)#8,034 |
| 87. | Humboldt | 5.3% | 8.5%(-3.20)#87 | 13.8%(-8.50)#8,056 |
| 88. | Greenbrier | 5.2% | 8.5%(-3.30)#88 | 13.8%(-8.60)#8,173 |
| 89. | South Carthage | 5.2% | 8.5%(-3.30)#89 | 13.8%(-8.60)#8,213 |
| 90. | Paris | 5.1% | 8.5%(-3.40)#90 | 13.8%(-8.70)#8,257 |
| 91. | Pleasant View | 5.1% | 8.5%(-3.40)#91 | 13.8%(-8.70)#8,273 |
| 92. | Lakesite | 5.1% | 8.5%(-3.40)#92 | 13.8%(-8.70)#8,296 |
| 93. | Harrison | 5.0% | 8.5%(-3.50)#93 | 13.8%(-8.80)#8,354 |
| 94. | Savannah | 5.0% | 8.5%(-3.50)#94 | 13.8%(-8.80)#8,358 |
| 95. | Blountville | 5.0% | 8.5%(-3.50)#95 | 13.8%(-8.80)#8,384 |
| 96. | Linden | 5.0% | 8.5%(-3.50)#96 | 13.8%(-8.80)#8,405 |
| 97. | Loudon | 4.7% | 8.5%(-3.80)#97 | 13.8%(-9.10)#8,660 |
| 98. | Mount Pleasant | 4.7% | 8.5%(-3.80)#98 | 13.8%(-9.10)#8,666 |
| 99. | Red Boiling Springs | 4.7% | 8.5%(-3.80)#99 | 13.8%(-9.10)#8,702 |
| 100. | Copperhill | 4.7% | 8.5%(-3.80)#100 | 13.8%(-9.10)#8,719 |
Common Questions
What are the Top 10 Cities with the Highest Percentage of Households Residing in Condos/Apartments in Tennessee?
Top 10 Cities with the Highest Percentage of Households Residing in Condos/Apartments in Tennessee are:
#1
78.5%
#2
24.8%
#3
24.2%
#4
23.9%
#5
23.6%
#6
19.2%
#7
18.9%
#8
18.8%
#9
18.5%
#10
17.4%
What city has the Highest Percentage of Households Residing in Condos/Apartments in Tennessee?
Berry Hill has the Highest Percentage of Households Residing in Condos/Apartments in Tennessee with 78.5%.
What is the Percentage of Households Residing in Condos/Apartments in the State of Tennessee?
Percentage of Households Residing in Condos/Apartments in Tennessee is 8.5%.
What is the Percentage of Households Residing in Condos/Apartments in the United States?
Percentage of Households Residing in Condos/Apartments in the United States is 13.8%.