Cities with the Highest Percentage of Haitian Population in Maryland
RELATED REPORTS & OPTIONS
Haitian
Maryland
Compare Cities
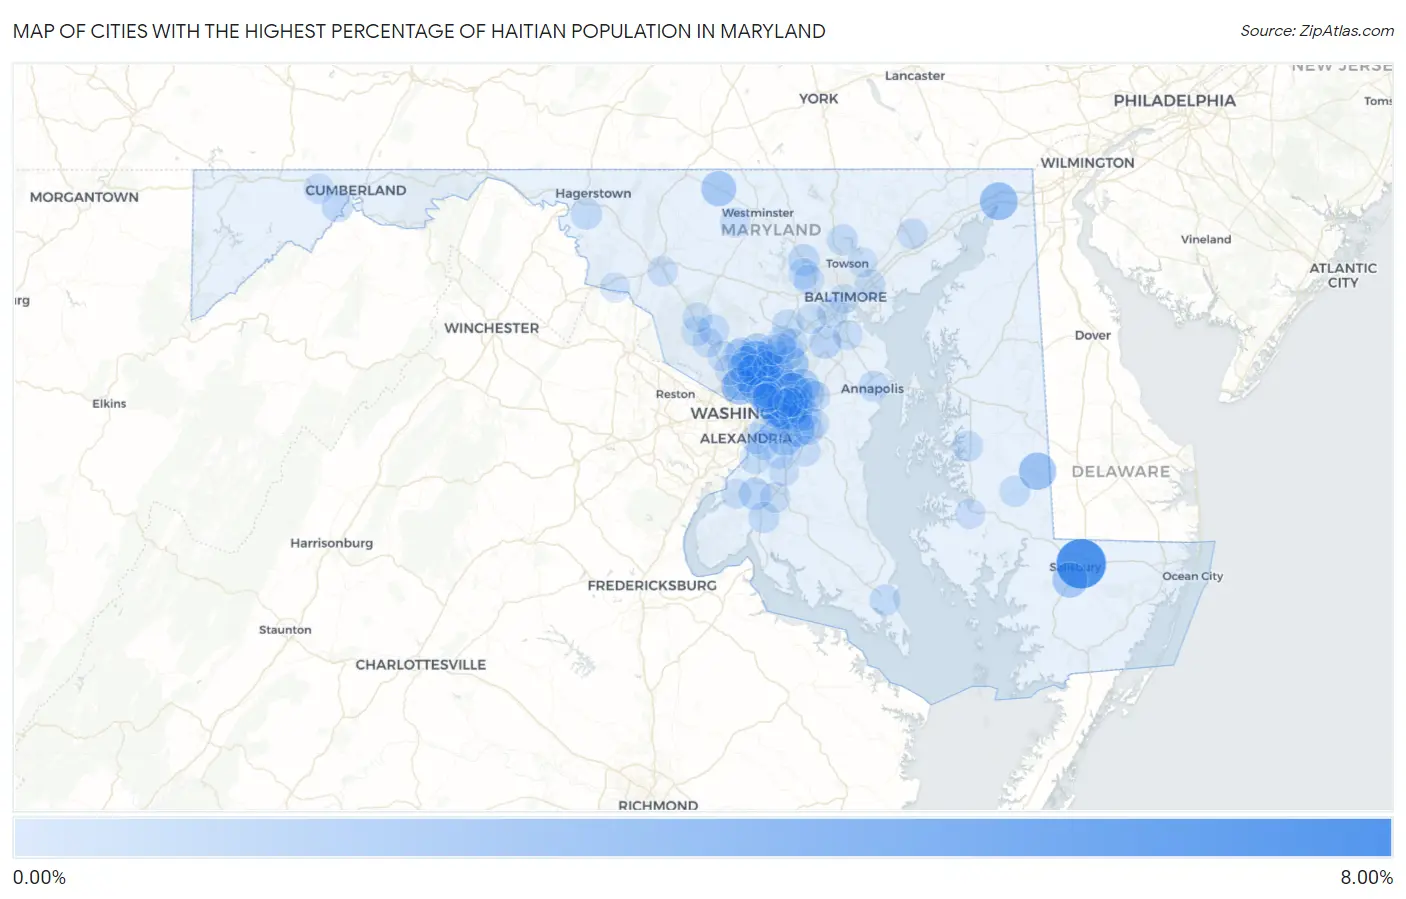
Map of Cities with the Highest Percentage of Haitian Population in Maryland
0.00%
8.00%
Cities with the Highest Percentage of Haitian Population in Maryland
| City | Haitian | vs State | vs National | |
| 1. | Salisbury | 7.05% | 0.28%(+6.77)#1 | 0.32%(+6.73)#88 |
| 2. | Summerfield | 3.85% | 0.28%(+3.56)#2 | 0.32%(+3.53)#171 |
| 3. | Colesville | 3.69% | 0.28%(+3.40)#3 | 0.32%(+3.36)#182 |
| 4. | Lanham | 3.38% | 0.28%(+3.10)#4 | 0.32%(+3.06)#197 |
| 5. | White Oak | 3.20% | 0.28%(+2.92)#5 | 0.32%(+2.88)#205 |
| 6. | North East | 2.78% | 0.28%(+2.50)#6 | 0.32%(+2.46)#235 |
| 7. | Federalsburg | 2.56% | 0.28%(+2.27)#7 | 0.32%(+2.23)#250 |
| 8. | Chevy Chase Section Five | 2.51% | 0.28%(+2.23)#8 | 0.32%(+2.19)#254 |
| 9. | Westphalia | 2.34% | 0.28%(+2.05)#9 | 0.32%(+2.02)#272 |
| 10. | Beltsville | 2.02% | 0.28%(+1.74)#10 | 0.32%(+1.70)#318 |
| 11. | Fruitland | 1.95% | 0.28%(+1.66)#11 | 0.32%(+1.63)#336 |
| 12. | Takoma Park | 1.89% | 0.28%(+1.61)#12 | 0.32%(+1.57)#343 |
| 13. | Taneytown | 1.87% | 0.28%(+1.58)#13 | 0.32%(+1.55)#350 |
| 14. | Hillandale | 1.86% | 0.28%(+1.58)#14 | 0.32%(+1.54)#351 |
| 15. | Glenn Dale | 1.66% | 0.28%(+1.38)#15 | 0.32%(+1.34)#390 |
| 16. | South Laurel | 1.63% | 0.28%(+1.35)#16 | 0.32%(+1.31)#398 |
| 17. | Cottage City | 1.61% | 0.28%(+1.33)#17 | 0.32%(+1.29)#406 |
| 18. | Peppermill Village | 1.56% | 0.28%(+1.28)#18 | 0.32%(+1.24)#420 |
| 19. | Andrews Afb | 1.48% | 0.28%(+1.20)#19 | 0.32%(+1.16)#432 |
| 20. | Adelphi | 1.34% | 0.28%(+1.06)#20 | 0.32%(+1.02)#469 |
| 21. | Colmar Manor | 1.25% | 0.28%(+0.970)#21 | 0.32%(+0.933)#499 |
| 22. | Cloverly | 1.24% | 0.28%(+0.952)#22 | 0.32%(+0.915)#506 |
| 23. | Chevy Chase | 1.16% | 0.28%(+0.882)#23 | 0.32%(+0.844)#536 |
| 24. | Greenbelt | 1.00% | 0.28%(+0.715)#24 | 0.32%(+0.678)#592 |
| 25. | Severn | 0.96% | 0.28%(+0.679)#25 | 0.32%(+0.642)#609 |
| 26. | Mitchellville | 0.96% | 0.28%(+0.676)#26 | 0.32%(+0.638)#613 |
| 27. | Lake Arbor | 0.95% | 0.28%(+0.663)#27 | 0.32%(+0.626)#620 |
| 28. | Bensville | 0.94% | 0.28%(+0.661)#28 | 0.32%(+0.623)#622 |
| 29. | Woodlawn Cdp Prince George S County | 0.93% | 0.28%(+0.649)#29 | 0.32%(+0.611)#629 |
| 30. | Largo | 0.88% | 0.28%(+0.593)#30 | 0.32%(+0.556)#662 |
| 31. | Fairmount Heights | 0.87% | 0.28%(+0.590)#31 | 0.32%(+0.552)#666 |
| 32. | Seabrook | 0.77% | 0.28%(+0.486)#32 | 0.32%(+0.449)#715 |
| 33. | Chillum | 0.73% | 0.28%(+0.450)#33 | 0.32%(+0.412)#732 |
| 34. | Kettering | 0.71% | 0.28%(+0.424)#34 | 0.32%(+0.386)#750 |
| 35. | Owings Mills | 0.70% | 0.28%(+0.414)#35 | 0.32%(+0.377)#757 |
| 36. | Ten Mile Creek | 0.69% | 0.28%(+0.409)#36 | 0.32%(+0.372)#761 |
| 37. | Springdale | 0.67% | 0.28%(+0.384)#37 | 0.32%(+0.346)#782 |
| 38. | Forest Glen | 0.66% | 0.28%(+0.373)#38 | 0.32%(+0.336)#794 |
| 39. | Fairland | 0.65% | 0.28%(+0.371)#39 | 0.32%(+0.334)#795 |
| 40. | Fairwood | 0.65% | 0.28%(+0.370)#40 | 0.32%(+0.333)#798 |
| 41. | Cresaptown | 0.65% | 0.28%(+0.370)#41 | 0.32%(+0.333)#799 |
| 42. | St James | 0.63% | 0.28%(+0.350)#42 | 0.32%(+0.313)#816 |
| 43. | Silver Spring | 0.62% | 0.28%(+0.339)#43 | 0.32%(+0.302)#823 |
| 44. | Lansdowne | 0.56% | 0.28%(+0.279)#44 | 0.32%(+0.242)#879 |
| 45. | Hurlock | 0.53% | 0.28%(+0.242)#45 | 0.32%(+0.205)#915 |
| 46. | Lexington Park | 0.51% | 0.28%(+0.227)#46 | 0.32%(+0.189)#927 |
| 47. | Cockeysville | 0.49% | 0.28%(+0.212)#47 | 0.32%(+0.174)#943 |
| 48. | Fort Washington | 0.47% | 0.28%(+0.190)#48 | 0.32%(+0.152)#970 |
| 49. | La Plata | 0.47% | 0.28%(+0.184)#49 | 0.32%(+0.146)#980 |
| 50. | Randallstown | 0.46% | 0.28%(+0.175)#50 | 0.32%(+0.138)#993 |
| 51. | Columbia | 0.45% | 0.28%(+0.171)#51 | 0.32%(+0.134)#1,001 |
| 52. | Aspen Hill | 0.45% | 0.28%(+0.167)#52 | 0.32%(+0.129)#1,007 |
| 53. | Calverton | 0.45% | 0.28%(+0.165)#53 | 0.32%(+0.127)#1,010 |
| 54. | Naval Academy | 0.45% | 0.28%(+0.164)#54 | 0.32%(+0.126)#1,014 |
| 55. | Laurel | 0.44% | 0.28%(+0.157)#55 | 0.32%(+0.119)#1,023 |
| 56. | Easton | 0.44% | 0.28%(+0.155)#56 | 0.32%(+0.118)#1,028 |
| 57. | North Laurel | 0.43% | 0.28%(+0.151)#57 | 0.32%(+0.114)#1,035 |
| 58. | Montgomery Village | 0.42% | 0.28%(+0.134)#58 | 0.32%(+0.097)#1,062 |
| 59. | Rosedale | 0.41% | 0.28%(+0.126)#59 | 0.32%(+0.088)#1,072 |
| 60. | Bel Air South | 0.41% | 0.28%(+0.123)#60 | 0.32%(+0.086)#1,073 |
| 61. | Bowie | 0.41% | 0.28%(+0.123)#61 | 0.32%(+0.085)#1,075 |
| 62. | West Laurel | 0.37% | 0.28%(+0.086)#62 | 0.32%(+0.049)#1,133 |
| 63. | Brock Hall | 0.36% | 0.28%(+0.076)#63 | 0.32%(+0.039)#1,149 |
| 64. | Forest Heights | 0.34% | 0.28%(+0.058)#64 | 0.32%(+0.020)#1,174 |
| 65. | Burnt Mills | 0.34% | 0.28%(+0.056)#65 | 0.32%(+0.019)#1,179 |
| 66. | Marlton | 0.33% | 0.28%(+0.051)#66 | 0.32%(+0.014)#1,191 |
| 67. | Waldorf | 0.32% | 0.28%(+0.037)#67 | 0.32%(-0.001)#1,222 |
| 68. | Leisure World | 0.31% | 0.28%(+0.029)#68 | 0.32%(-0.008)#1,235 |
| 69. | New Windsor | 0.31% | 0.28%(+0.024)#69 | 0.32%(-0.014)#1,246 |
| 70. | North Bethesda | 0.30% | 0.28%(+0.021)#70 | 0.32%(-0.017)#1,253 |
| 71. | Milford Mill | 0.30% | 0.28%(+0.012)#71 | 0.32%(-0.025)#1,272 |
| 72. | Ballenger Creek | 0.25% | 0.28%(-0.028)#72 | 0.32%(-0.065)#1,357 |
| 73. | Glen Burnie | 0.25% | 0.28%(-0.031)#73 | 0.32%(-0.068)#1,361 |
| 74. | Rockville | 0.25% | 0.28%(-0.033)#74 | 0.32%(-0.070)#1,363 |
| 75. | Marlboro Village | 0.24% | 0.28%(-0.042)#75 | 0.32%(-0.079)#1,394 |
| 76. | Glenmont | 0.23% | 0.28%(-0.048)#76 | 0.32%(-0.086)#1,414 |
| 77. | Landover | 0.23% | 0.28%(-0.054)#77 | 0.32%(-0.091)#1,438 |
| 78. | Frostburg | 0.22% | 0.28%(-0.058)#78 | 0.32%(-0.096)#1,452 |
| 79. | Gaithersburg | 0.22% | 0.28%(-0.058)#79 | 0.32%(-0.096)#1,454 |
| 80. | Burtonsville | 0.22% | 0.28%(-0.060)#80 | 0.32%(-0.097)#1,456 |
| 81. | Cambridge | 0.22% | 0.28%(-0.061)#81 | 0.32%(-0.098)#1,461 |
| 82. | Wheaton | 0.22% | 0.28%(-0.061)#82 | 0.32%(-0.099)#1,465 |
| 83. | Hyattsville | 0.22% | 0.28%(-0.062)#83 | 0.32%(-0.100)#1,468 |
| 84. | Suitland | 0.22% | 0.28%(-0.066)#84 | 0.32%(-0.104)#1,479 |
| 85. | Clinton | 0.21% | 0.28%(-0.074)#85 | 0.32%(-0.112)#1,505 |
| 86. | Ilchester | 0.21% | 0.28%(-0.074)#86 | 0.32%(-0.112)#1,506 |
| 87. | Brandywine | 0.20% | 0.28%(-0.085)#87 | 0.32%(-0.122)#1,527 |
| 88. | Mount Rainier | 0.19% | 0.28%(-0.089)#88 | 0.32%(-0.127)#1,534 |
| 89. | Germantown | 0.19% | 0.28%(-0.094)#89 | 0.32%(-0.132)#1,545 |
| 90. | Brentwood | 0.19% | 0.28%(-0.098)#90 | 0.32%(-0.135)#1,555 |
| 91. | Carney | 0.15% | 0.28%(-0.136)#91 | 0.32%(-0.174)#1,702 |
| 92. | Oxon Hill | 0.15% | 0.28%(-0.137)#92 | 0.32%(-0.175)#1,705 |
| 93. | Kemp Mill | 0.14% | 0.28%(-0.141)#93 | 0.32%(-0.178)#1,720 |
| 94. | Hillcrest Heights | 0.14% | 0.28%(-0.143)#94 | 0.32%(-0.181)#1,737 |
| 95. | Scaggsville | 0.14% | 0.28%(-0.144)#95 | 0.32%(-0.181)#1,740 |
| 96. | Clarksburg | 0.13% | 0.28%(-0.149)#96 | 0.32%(-0.186)#1,764 |
| 97. | Baltimore | 0.13% | 0.28%(-0.153)#97 | 0.32%(-0.191)#1,777 |
| 98. | Brunswick | 0.13% | 0.28%(-0.154)#98 | 0.32%(-0.192)#1,786 |
| 99. | Bryans Road | 0.13% | 0.28%(-0.155)#99 | 0.32%(-0.192)#1,789 |
| 100. | Glenarden | 0.13% | 0.28%(-0.157)#100 | 0.32%(-0.194)#1,799 |
Common Questions
What are the Top 10 Cities with the Highest Percentage of Haitian Population in Maryland?
Top 10 Cities with the Highest Percentage of Haitian Population in Maryland are:
#1
7.05%
#2
3.85%
#3
3.69%
#4
3.38%
#5
3.20%
#6
2.78%
#7
2.56%
#8
2.51%
#9
2.34%
#10
2.02%
What city has the Highest Percentage of Haitian Population in Maryland?
Salisbury has the Highest Percentage of Haitian Population in Maryland with 7.05%.
What is the Percentage of Haitian Population in the State of Maryland?
Percentage of Haitian Population in Maryland is 0.28%.
What is the Percentage of Haitian Population in the United States?
Percentage of Haitian Population in the United States is 0.32%.