Cities with the Highest Percentage of Haitian Population in Missouri
RELATED REPORTS & OPTIONS
Haitian
Missouri
Compare Cities
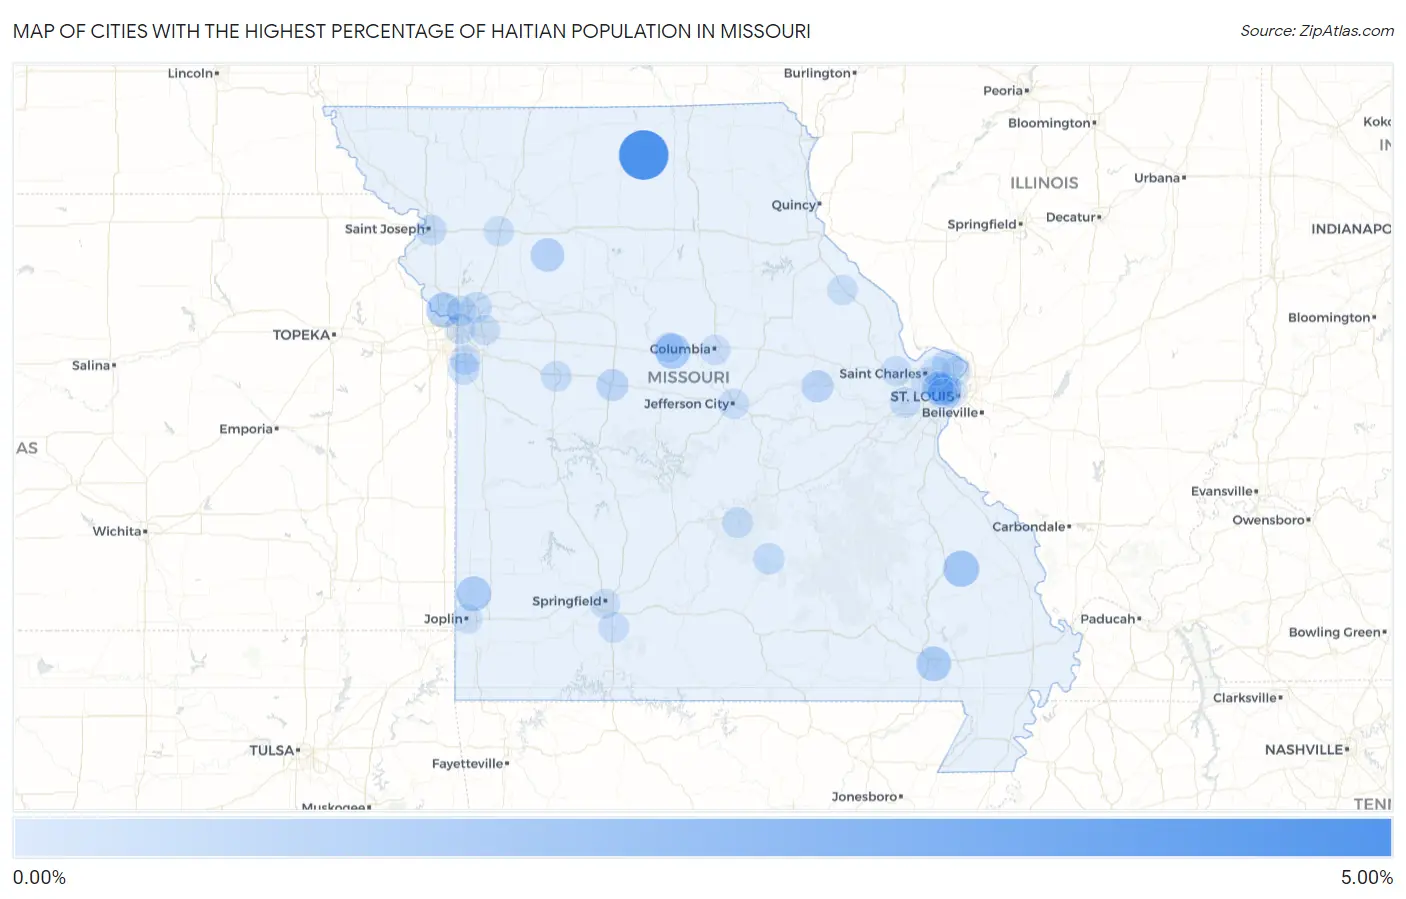
Map of Cities with the Highest Percentage of Haitian Population in Missouri
0.00%
5.00%

Cities with the Highest Percentage of Haitian Population in Missouri
| City | Haitian | vs State | vs National | |
| 1. | Green City | 4.36% | 0.044%(+4.32)#1 | 0.32%(+4.04)#153 |
| 2. | Marquand | 1.31% | 0.044%(+1.26)#2 | 0.32%(+0.987)#485 |
| 3. | Windsor Place | 1.12% | 0.044%(+1.07)#3 | 0.32%(+0.796)#549 |
| 4. | Parkville | 1.06% | 0.044%(+1.01)#4 | 0.32%(+0.736)#567 |
| 5. | Poplar Bluff | 1.00% | 0.044%(+0.955)#5 | 0.32%(+0.679)#591 |
| 6. | Neck City | 1.00% | 0.044%(+0.951)#6 | 0.32%(+0.675)#594 |
| 7. | Braymer | 0.72% | 0.044%(+0.680)#7 | 0.32%(+0.403)#739 |
| 8. | Pagedale | 0.62% | 0.044%(+0.573)#8 | 0.32%(+0.297)#828 |
| 9. | Hermann | 0.42% | 0.044%(+0.377)#9 | 0.32%(+0.101)#1,056 |
| 10. | Sedalia | 0.41% | 0.044%(+0.365)#10 | 0.32%(+0.089)#1,071 |
| 11. | Belton | 0.33% | 0.044%(+0.282)#11 | 0.32%(+0.006)#1,206 |
| 12. | Olivette | 0.32% | 0.044%(+0.276)#12 | 0.32%(-0.000)#1,217 |
| 13. | Old Jamestown | 0.30% | 0.044%(+0.255)#13 | 0.32%(-0.021)#1,266 |
| 14. | Licking | 0.29% | 0.044%(+0.244)#14 | 0.32%(-0.033)#1,289 |
| 15. | University City | 0.24% | 0.044%(+0.200)#15 | 0.32%(-0.076)#1,387 |
| 16. | Liberty | 0.22% | 0.044%(+0.181)#16 | 0.32%(-0.096)#1,455 |
| 17. | Fort Leonard Wood | 0.17% | 0.044%(+0.129)#17 | 0.32%(-0.147)#1,598 |
| 18. | Kansas City | 0.17% | 0.044%(+0.128)#18 | 0.32%(-0.149)#1,608 |
| 19. | Warrensburg | 0.17% | 0.044%(+0.122)#19 | 0.32%(-0.155)#1,630 |
| 20. | St Joseph | 0.15% | 0.044%(+0.106)#20 | 0.32%(-0.171)#1,695 |
| 21. | Wildwood | 0.13% | 0.044%(+0.084)#21 | 0.32%(-0.193)#1,794 |
| 22. | Ozark | 0.11% | 0.044%(+0.063)#22 | 0.32%(-0.213)#1,891 |
| 23. | Jefferson City | 0.096% | 0.044%(+0.052)#23 | 0.32%(-0.224)#1,949 |
| 24. | Columbia | 0.096% | 0.044%(+0.052)#24 | 0.32%(-0.224)#1,952 |
| 25. | Spanish Lake | 0.094% | 0.044%(+0.050)#25 | 0.32%(-0.226)#1,967 |
| 26. | Boonville | 0.078% | 0.044%(+0.034)#26 | 0.32%(-0.243)#2,061 |
| 27. | O Fallon | 0.074% | 0.044%(+0.030)#27 | 0.32%(-0.246)#2,088 |
| 28. | St Louis | 0.053% | 0.044%(+0.009)#28 | 0.32%(-0.267)#2,253 |
| 29. | Maryland Heights | 0.050% | 0.044%(+0.006)#29 | 0.32%(-0.271)#2,278 |
| 30. | Bowling Green | 0.048% | 0.044%(+0.004)#30 | 0.32%(-0.272)#2,291 |
| 31. | Cameron | 0.044% | 0.044%(+0.000)#31 | 0.32%(-0.276)#2,328 |
| 32. | Grandview | 0.042% | 0.044%(-0.001)#32 | 0.32%(-0.278)#2,340 |
| 33. | Hazelwood | 0.039% | 0.044%(-0.004)#33 | 0.32%(-0.281)#2,372 |
| 34. | Overland | 0.038% | 0.044%(-0.006)#34 | 0.32%(-0.282)#2,394 |
| 35. | Independence | 0.032% | 0.044%(-0.012)#35 | 0.32%(-0.288)#2,462 |
| 36. | Gladstone | 0.026% | 0.044%(-0.018)#36 | 0.32%(-0.294)#2,525 |
| 37. | Springfield | 0.011% | 0.044%(-0.033)#37 | 0.32%(-0.309)#2,691 |
| 38. | Joplin | 0.0096% | 0.044%(-0.034)#38 | 0.32%(-0.311)#2,708 |
| 39. | Clayton | 0.0058% | 0.044%(-0.038)#39 | 0.32%(-0.315)#2,738 |
Common Questions
What are the Top 10 Cities with the Highest Percentage of Haitian Population in Missouri?
Top 10 Cities with the Highest Percentage of Haitian Population in Missouri are:
#1
4.36%
#2
1.31%
#3
1.12%
#4
1.06%
#5
1.00%
#6
1.00%
#7
0.72%
#8
0.62%
#9
0.42%
#10
0.41%
What city has the Highest Percentage of Haitian Population in Missouri?
Green City has the Highest Percentage of Haitian Population in Missouri with 4.36%.
What is the Percentage of Haitian Population in the State of Missouri?
Percentage of Haitian Population in Missouri is 0.044%.
What is the Percentage of Haitian Population in the United States?
Percentage of Haitian Population in the United States is 0.32%.