Cities with the Highest Percentage of Haitian Population in Massachusetts
RELATED REPORTS & OPTIONS
Haitian
Massachusetts
Compare Cities
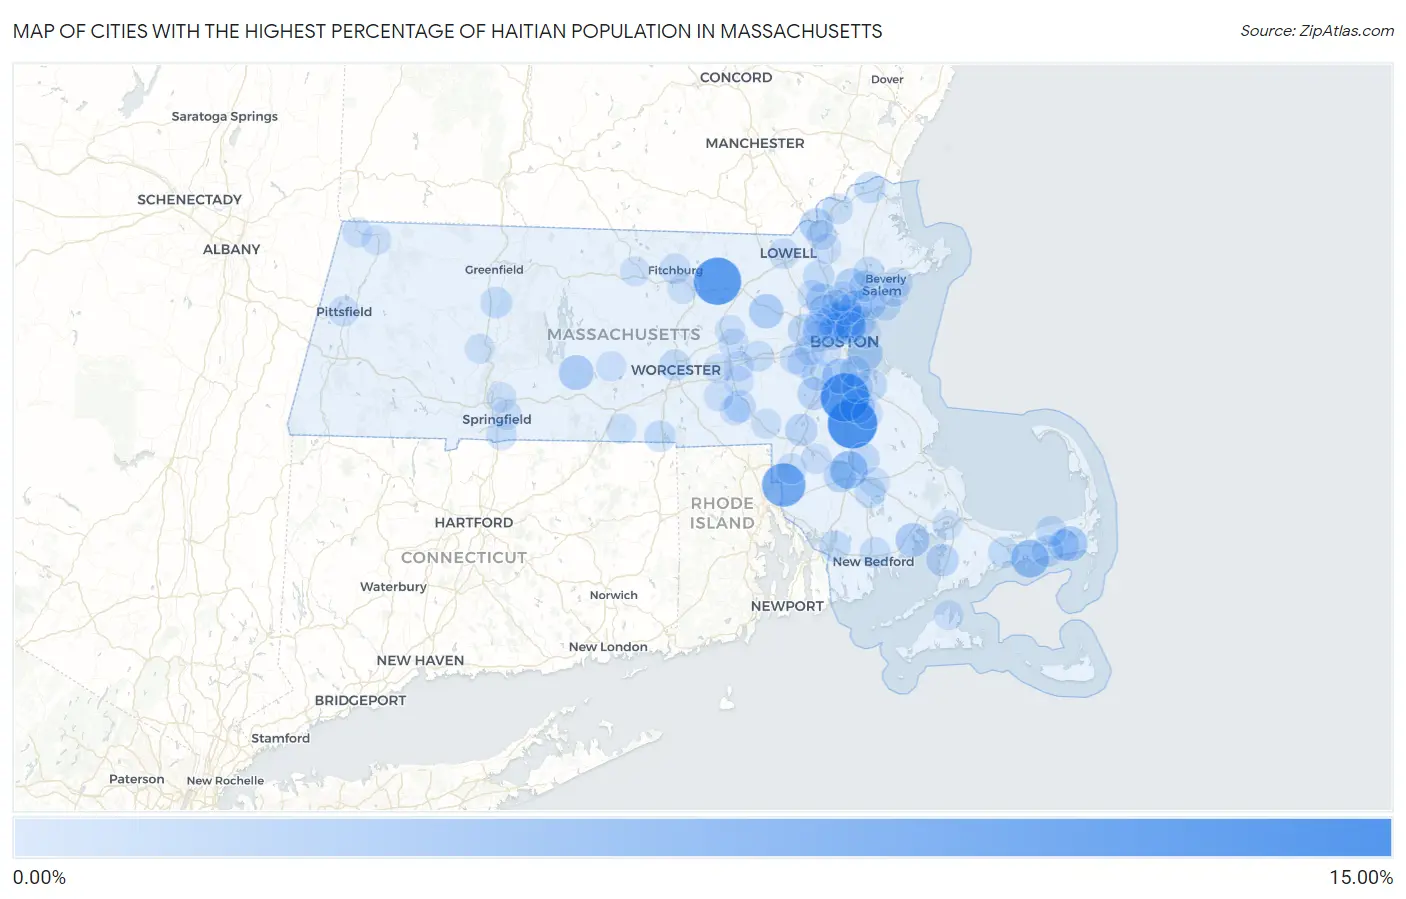
Map of Cities with the Highest Percentage of Haitian Population in Massachusetts
0.00%
15.00%
Cities with the Highest Percentage of Haitian Population in Massachusetts
| City | Haitian | vs State | vs National | |
| 1. | Brockton | 13.42% | 1.15%(+12.3)#1 | 0.32%(+13.1)#35 |
| 2. | Randolph Town | 12.67% | 1.15%(+11.5)#2 | 0.32%(+12.4)#40 |
| 3. | Devens | 11.91% | 1.15%(+10.8)#3 | 0.32%(+11.6)#43 |
| 4. | North Seekonk | 9.13% | 1.15%(+7.98)#4 | 0.32%(+8.81)#60 |
| 5. | Everett | 5.91% | 1.15%(+4.76)#5 | 0.32%(+5.59)#107 |
| 6. | West Yarmouth | 5.18% | 1.15%(+4.03)#6 | 0.32%(+4.86)#127 |
| 7. | Raynham Center | 5.10% | 1.15%(+3.95)#7 | 0.32%(+4.78)#131 |
| 8. | Malden | 5.03% | 1.15%(+3.88)#8 | 0.32%(+4.71)#135 |
| 9. | Milton | 3.59% | 1.15%(+2.43)#9 | 0.32%(+3.26)#190 |
| 10. | Medford | 3.43% | 1.15%(+2.28)#10 | 0.32%(+3.11)#194 |
| 11. | Harwich Center | 3.31% | 1.15%(+2.16)#11 | 0.32%(+2.99)#199 |
| 12. | Boston | 3.16% | 1.15%(+2.01)#12 | 0.32%(+2.84)#212 |
| 13. | Ware | 3.12% | 1.15%(+1.97)#13 | 0.32%(+2.80)#214 |
| 14. | Holbrook | 3.01% | 1.15%(+1.86)#14 | 0.32%(+2.69)#221 |
| 15. | West Concord | 2.90% | 1.15%(+1.75)#15 | 0.32%(+2.58)#231 |
| 16. | Marion Center | 2.76% | 1.15%(+1.60)#16 | 0.32%(+2.43)#238 |
| 17. | Methuen Town | 2.20% | 1.15%(+1.05)#17 | 0.32%(+1.88)#294 |
| 18. | Lynnfield | 2.07% | 1.15%(+0.915)#18 | 0.32%(+1.75)#307 |
| 19. | Woburn | 2.06% | 1.15%(+0.913)#19 | 0.32%(+1.74)#308 |
| 20. | Lynn | 1.91% | 1.15%(+0.763)#20 | 0.32%(+1.59)#341 |
| 21. | Norwood | 1.82% | 1.15%(+0.668)#21 | 0.32%(+1.50)#357 |
| 22. | Taunton | 1.63% | 1.15%(+0.476)#22 | 0.32%(+1.31)#401 |
| 23. | North Falmouth | 1.60% | 1.15%(+0.445)#23 | 0.32%(+1.28)#413 |
| 24. | Foxborough | 1.57% | 1.15%(+0.418)#24 | 0.32%(+1.25)#417 |
| 25. | Saugus | 1.49% | 1.15%(+0.344)#25 | 0.32%(+1.17)#429 |
| 26. | Waltham | 1.30% | 1.15%(+0.146)#26 | 0.32%(+0.976)#488 |
| 27. | Cambridge | 1.29% | 1.15%(+0.142)#27 | 0.32%(+0.972)#491 |
| 28. | Milford | 1.25% | 1.15%(+0.101)#28 | 0.32%(+0.931)#500 |
| 29. | Weymouth Town | 1.25% | 1.15%(+0.097)#29 | 0.32%(+0.927)#501 |
| 30. | Revere | 1.20% | 1.15%(+0.048)#30 | 0.32%(+0.878)#526 |
| 31. | Winchester | 1.19% | 1.15%(+0.037)#31 | 0.32%(+0.868)#530 |
| 32. | West Dennis | 1.17% | 1.15%(+0.020)#32 | 0.32%(+0.851)#534 |
| 33. | Somerville | 1.16% | 1.15%(+0.010)#33 | 0.32%(+0.840)#538 |
| 34. | Northwest Harwich | 1.13% | 1.15%(-0.022)#34 | 0.32%(+0.808)#547 |
| 35. | Bridgewater Town | 1.08% | 1.15%(-0.068)#35 | 0.32%(+0.763)#558 |
| 36. | Peabody | 1.04% | 1.15%(-0.107)#36 | 0.32%(+0.724)#571 |
| 37. | Dedham | 1.03% | 1.15%(-0.125)#37 | 0.32%(+0.705)#576 |
| 38. | Amesbury Town | 1.02% | 1.15%(-0.126)#38 | 0.32%(+0.704)#578 |
| 39. | Worcester | 1.01% | 1.15%(-0.138)#39 | 0.32%(+0.693)#584 |
| 40. | Wilmington | 1.01% | 1.15%(-0.142)#40 | 0.32%(+0.689)#587 |
| 41. | South Deerfield | 0.97% | 1.15%(-0.178)#41 | 0.32%(+0.653)#604 |
| 42. | Danvers | 0.95% | 1.15%(-0.198)#42 | 0.32%(+0.633)#616 |
| 43. | Swampscott | 0.91% | 1.15%(-0.238)#43 | 0.32%(+0.592)#643 |
| 44. | Fall River | 0.88% | 1.15%(-0.272)#44 | 0.32%(+0.559)#660 |
| 45. | Barnstable Town | 0.81% | 1.15%(-0.341)#45 | 0.32%(+0.489)#694 |
| 46. | Webster | 0.80% | 1.15%(-0.352)#46 | 0.32%(+0.479)#697 |
| 47. | North Lakeville | 0.74% | 1.15%(-0.408)#47 | 0.32%(+0.422)#730 |
| 48. | East Dennis | 0.73% | 1.15%(-0.423)#48 | 0.32%(+0.407)#735 |
| 49. | Salem | 0.66% | 1.15%(-0.486)#49 | 0.32%(+0.344)#787 |
| 50. | Braintree Town | 0.63% | 1.15%(-0.521)#50 | 0.32%(+0.309)#819 |
| 51. | New Bedford | 0.60% | 1.15%(-0.555)#51 | 0.32%(+0.276)#839 |
| 52. | Quincy | 0.60% | 1.15%(-0.556)#52 | 0.32%(+0.275)#842 |
| 53. | Melrose | 0.58% | 1.15%(-0.567)#53 | 0.32%(+0.263)#862 |
| 54. | Haverhill | 0.58% | 1.15%(-0.574)#54 | 0.32%(+0.256)#866 |
| 55. | Watertown Town | 0.53% | 1.15%(-0.625)#55 | 0.32%(+0.205)#914 |
| 56. | Attleboro | 0.51% | 1.15%(-0.644)#56 | 0.32%(+0.186)#931 |
| 57. | Fitchburg | 0.47% | 1.15%(-0.682)#57 | 0.32%(+0.148)#977 |
| 58. | Lowell | 0.46% | 1.15%(-0.695)#58 | 0.32%(+0.135)#997 |
| 59. | Longmeadow | 0.45% | 1.15%(-0.701)#59 | 0.32%(+0.129)#1,006 |
| 60. | North Attleborough | 0.43% | 1.15%(-0.725)#60 | 0.32%(+0.106)#1,045 |
| 61. | Framingham | 0.40% | 1.15%(-0.751)#61 | 0.32%(+0.079)#1,082 |
| 62. | Beverly | 0.40% | 1.15%(-0.752)#62 | 0.32%(+0.078)#1,083 |
| 63. | Wellesley | 0.38% | 1.15%(-0.772)#63 | 0.32%(+0.058)#1,114 |
| 64. | Norton Center | 0.31% | 1.15%(-0.841)#64 | 0.32%(-0.010)#1,237 |
| 65. | Newton | 0.30% | 1.15%(-0.848)#65 | 0.32%(-0.017)#1,255 |
| 66. | Pittsfield | 0.29% | 1.15%(-0.858)#66 | 0.32%(-0.028)#1,277 |
| 67. | Hopedale | 0.29% | 1.15%(-0.861)#67 | 0.32%(-0.030)#1,282 |
| 68. | Abington | 0.29% | 1.15%(-0.863)#68 | 0.32%(-0.032)#1,287 |
| 69. | Andover | 0.29% | 1.15%(-0.864)#69 | 0.32%(-0.034)#1,291 |
| 70. | Chelsea | 0.27% | 1.15%(-0.880)#70 | 0.32%(-0.050)#1,328 |
| 71. | Marlborough | 0.27% | 1.15%(-0.883)#71 | 0.32%(-0.052)#1,334 |
| 72. | North Brookfield | 0.25% | 1.15%(-0.905)#72 | 0.32%(-0.074)#1,377 |
| 73. | Cordaville | 0.24% | 1.15%(-0.908)#73 | 0.32%(-0.078)#1,391 |
| 74. | Arlington | 0.23% | 1.15%(-0.920)#74 | 0.32%(-0.089)#1,433 |
| 75. | Springfield | 0.23% | 1.15%(-0.922)#75 | 0.32%(-0.092)#1,440 |
| 76. | Burlington | 0.21% | 1.15%(-0.941)#76 | 0.32%(-0.110)#1,499 |
| 77. | Leominster | 0.20% | 1.15%(-0.947)#77 | 0.32%(-0.116)#1,514 |
| 78. | Stoneham | 0.20% | 1.15%(-0.951)#78 | 0.32%(-0.120)#1,522 |
| 79. | Lawrence | 0.20% | 1.15%(-0.954)#79 | 0.32%(-0.124)#1,530 |
| 80. | Franklin Town | 0.18% | 1.15%(-0.968)#80 | 0.32%(-0.137)#1,560 |
| 81. | Needham | 0.18% | 1.15%(-0.972)#81 | 0.32%(-0.142)#1,577 |
| 82. | Southbridge Town | 0.15% | 1.15%(-0.998)#82 | 0.32%(-0.168)#1,683 |
| 83. | Amherst | 0.14% | 1.15%(-1.01)#83 | 0.32%(-0.177)#1,712 |
| 84. | Greenfield | 0.12% | 1.15%(-1.03)#84 | 0.32%(-0.196)#1,810 |
| 85. | Upton | 0.12% | 1.15%(-1.04)#85 | 0.32%(-0.205)#1,850 |
| 86. | Wakefield | 0.100% | 1.15%(-1.05)#86 | 0.32%(-0.221)#1,931 |
| 87. | North Adams | 0.093% | 1.15%(-1.06)#87 | 0.32%(-0.228)#1,975 |
| 88. | Hopkinton | 0.091% | 1.15%(-1.06)#88 | 0.32%(-0.229)#1,984 |
| 89. | Brookline | 0.086% | 1.15%(-1.06)#89 | 0.32%(-0.234)#2,010 |
| 90. | Vineyard Haven | 0.084% | 1.15%(-1.07)#90 | 0.32%(-0.236)#2,019 |
| 91. | Chicopee | 0.072% | 1.15%(-1.08)#91 | 0.32%(-0.248)#2,104 |
| 92. | Williamstown | 0.067% | 1.15%(-1.08)#92 | 0.32%(-0.254)#2,141 |
| 93. | Winthrop Town | 0.063% | 1.15%(-1.09)#93 | 0.32%(-0.257)#2,171 |
| 94. | Northampton | 0.053% | 1.15%(-1.10)#94 | 0.32%(-0.267)#2,252 |
| 95. | Gardner | 0.052% | 1.15%(-1.10)#95 | 0.32%(-0.268)#2,262 |
| 96. | Belmont | 0.048% | 1.15%(-1.10)#96 | 0.32%(-0.272)#2,293 |
| 97. | Westborough | 0.046% | 1.15%(-1.11)#97 | 0.32%(-0.275)#2,316 |
| 98. | Middleborough Center | 0.038% | 1.15%(-1.11)#98 | 0.32%(-0.282)#2,387 |
| 99. | Buzzards Bay | 0.033% | 1.15%(-1.12)#99 | 0.32%(-0.287)#2,438 |
| 100. | Hudson | 0.026% | 1.15%(-1.13)#100 | 0.32%(-0.295)#2,527 |
Common Questions
What are the Top 10 Cities with the Highest Percentage of Haitian Population in Massachusetts?
Top 10 Cities with the Highest Percentage of Haitian Population in Massachusetts are:
#1
13.42%
#2
12.67%
#3
11.91%
#4
9.13%
#5
5.91%
#6
5.18%
#7
5.10%
#8
5.03%
#9
3.59%
#10
3.43%
What city has the Highest Percentage of Haitian Population in Massachusetts?
Brockton has the Highest Percentage of Haitian Population in Massachusetts with 13.42%.
What is the Percentage of Haitian Population in the State of Massachusetts?
Percentage of Haitian Population in Massachusetts is 1.15%.
What is the Percentage of Haitian Population in the United States?
Percentage of Haitian Population in the United States is 0.32%.