Cities with the Highest Percentage of Haitian Population in New York
RELATED REPORTS & OPTIONS
Haitian
New York
Compare Cities
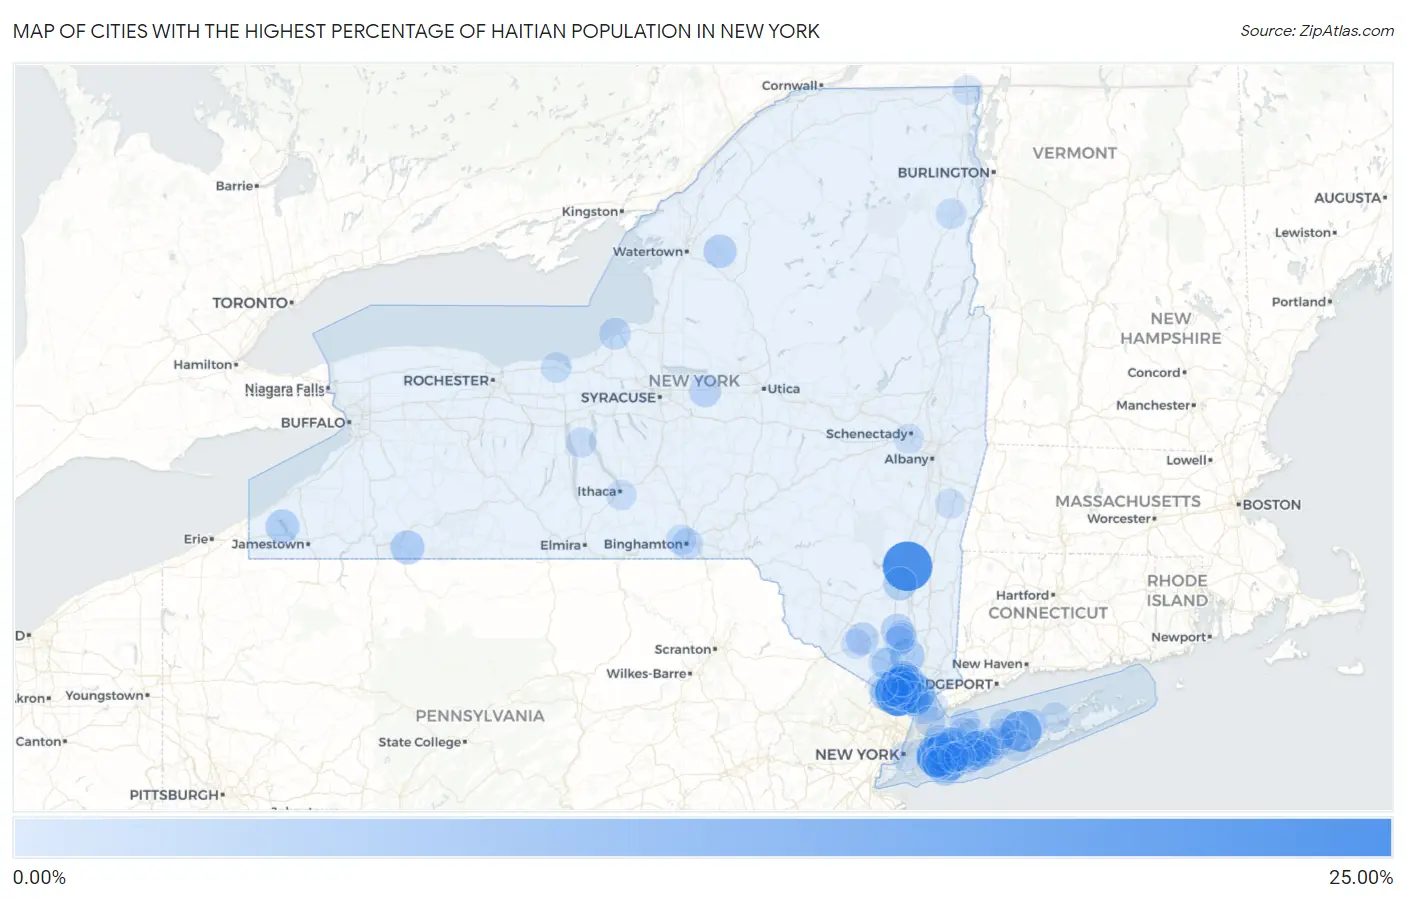
Map of Cities with the Highest Percentage of Haitian Population in New York
0.00%
25.00%
Cities with the Highest Percentage of Haitian Population in New York
| City | Haitian | vs State | vs National | |
| 1. | East Kingston | 20.25% | 0.92%(+19.3)#1 | 0.32%(+19.9)#15 |
| 2. | Spring Valley | 17.94% | 0.92%(+17.0)#2 | 0.32%(+17.6)#22 |
| 3. | Elmont | 12.95% | 0.92%(+12.0)#3 | 0.32%(+12.6)#37 |
| 4. | North Valley Stream | 11.75% | 0.92%(+10.8)#4 | 0.32%(+11.4)#44 |
| 5. | Gordon Heights | 11.46% | 0.92%(+10.5)#5 | 0.32%(+11.1)#46 |
| 6. | Upper Nyack | 10.50% | 0.92%(+9.58)#6 | 0.32%(+10.2)#49 |
| 7. | New Cassel | 8.14% | 0.92%(+7.22)#7 | 0.32%(+7.82)#75 |
| 8. | Baldwin | 7.50% | 0.92%(+6.58)#8 | 0.32%(+7.18)#80 |
| 9. | Hillcrest | 6.82% | 0.92%(+5.90)#9 | 0.32%(+6.50)#91 |
| 10. | South Floral Park | 6.43% | 0.92%(+5.51)#10 | 0.32%(+6.11)#95 |
| 11. | Wyandanch | 6.07% | 0.92%(+5.15)#11 | 0.32%(+5.75)#102 |
| 12. | Suffern | 6.01% | 0.92%(+5.09)#12 | 0.32%(+5.69)#105 |
| 13. | Fairview Cdp Westchester County | 5.95% | 0.92%(+5.02)#13 | 0.32%(+5.63)#106 |
| 14. | South Nyack | 5.83% | 0.92%(+4.91)#14 | 0.32%(+5.51)#110 |
| 15. | Chestnut Ridge | 5.29% | 0.92%(+4.37)#15 | 0.32%(+4.97)#123 |
| 16. | Highland Falls | 5.27% | 0.92%(+4.35)#16 | 0.32%(+4.95)#124 |
| 17. | West Haverstraw | 5.10% | 0.92%(+4.18)#17 | 0.32%(+4.78)#132 |
| 18. | South Hempstead | 4.91% | 0.92%(+3.99)#18 | 0.32%(+4.59)#141 |
| 19. | Weston Mills | 4.77% | 0.92%(+3.84)#19 | 0.32%(+4.45)#143 |
| 20. | North Amityville | 4.53% | 0.92%(+3.61)#20 | 0.32%(+4.21)#147 |
| 21. | Chautauqua | 4.43% | 0.92%(+3.51)#21 | 0.32%(+4.11)#149 |
| 22. | Hempstead | 4.40% | 0.92%(+3.48)#22 | 0.32%(+4.08)#150 |
| 23. | Rifton | 4.20% | 0.92%(+3.27)#23 | 0.32%(+3.88)#160 |
| 24. | West Carthage | 4.17% | 0.92%(+3.24)#24 | 0.32%(+3.85)#162 |
| 25. | Freeport | 4.02% | 0.92%(+3.10)#25 | 0.32%(+3.70)#166 |
| 26. | North Babylon | 3.96% | 0.92%(+3.04)#26 | 0.32%(+3.64)#167 |
| 27. | Pomona | 3.83% | 0.92%(+2.91)#27 | 0.32%(+3.51)#172 |
| 28. | Gardnertown | 3.65% | 0.92%(+2.73)#28 | 0.32%(+3.33)#184 |
| 29. | Deer Park | 3.60% | 0.92%(+2.68)#29 | 0.32%(+3.28)#189 |
| 30. | Scotchtown | 3.48% | 0.92%(+2.55)#30 | 0.32%(+3.16)#192 |
| 31. | Lakeview | 3.40% | 0.92%(+2.48)#31 | 0.32%(+3.08)#196 |
| 32. | Haverstraw | 3.28% | 0.92%(+2.36)#32 | 0.32%(+2.96)#200 |
| 33. | Uniondale | 3.24% | 0.92%(+2.32)#33 | 0.32%(+2.92)#202 |
| 34. | Munsey Park | 3.22% | 0.92%(+2.30)#34 | 0.32%(+2.90)#204 |
| 35. | Roosevelt | 3.19% | 0.92%(+2.27)#35 | 0.32%(+2.87)#209 |
| 36. | Valley Stream | 3.17% | 0.92%(+2.25)#36 | 0.32%(+2.85)#211 |
| 37. | Malverne | 3.13% | 0.92%(+2.21)#37 | 0.32%(+2.81)#213 |
| 38. | Thiells | 3.12% | 0.92%(+2.19)#38 | 0.32%(+2.80)#215 |
| 39. | Barnum Island | 3.02% | 0.92%(+2.09)#39 | 0.32%(+2.70)#220 |
| 40. | Canastota | 2.95% | 0.92%(+2.02)#40 | 0.32%(+2.62)#225 |
| 41. | Suny Oswego | 2.70% | 0.92%(+1.77)#41 | 0.32%(+2.38)#241 |
| 42. | Montebello | 2.69% | 0.92%(+1.77)#42 | 0.32%(+2.37)#242 |
| 43. | Tuxedo | 2.67% | 0.92%(+1.75)#43 | 0.32%(+2.35)#244 |
| 44. | Central Islip | 2.51% | 0.92%(+1.59)#44 | 0.32%(+2.19)#253 |
| 45. | Ridge | 2.46% | 0.92%(+1.54)#45 | 0.32%(+2.14)#261 |
| 46. | West Hempstead | 2.41% | 0.92%(+1.49)#46 | 0.32%(+2.09)#266 |
| 47. | Westbury | 2.32% | 0.92%(+1.40)#47 | 0.32%(+2.00)#277 |
| 48. | Herricks | 2.27% | 0.92%(+1.35)#48 | 0.32%(+1.95)#279 |
| 49. | New Hempstead | 2.26% | 0.92%(+1.33)#49 | 0.32%(+1.94)#283 |
| 50. | East Massapequa | 2.26% | 0.92%(+1.33)#50 | 0.32%(+1.94)#284 |
| 51. | New Windsor | 2.24% | 0.92%(+1.32)#51 | 0.32%(+1.92)#286 |
| 52. | Harriman | 2.23% | 0.92%(+1.31)#52 | 0.32%(+1.91)#288 |
| 53. | Lynbrook | 2.18% | 0.92%(+1.25)#53 | 0.32%(+1.86)#297 |
| 54. | Farmingdale | 2.16% | 0.92%(+1.24)#54 | 0.32%(+1.84)#299 |
| 55. | Binghamton | 2.12% | 0.92%(+1.20)#55 | 0.32%(+1.80)#303 |
| 56. | Lloyd Harbor | 2.10% | 0.92%(+1.18)#56 | 0.32%(+1.78)#305 |
| 57. | Stony Point | 2.04% | 0.92%(+1.12)#57 | 0.32%(+1.72)#313 |
| 58. | Ardsley | 2.03% | 0.92%(+1.11)#58 | 0.32%(+1.71)#316 |
| 59. | Brentwood | 2.03% | 0.92%(+1.11)#59 | 0.32%(+1.71)#317 |
| 60. | Huntington Station | 1.99% | 0.92%(+1.07)#60 | 0.32%(+1.67)#322 |
| 61. | Nyack | 1.98% | 0.92%(+1.06)#61 | 0.32%(+1.66)#325 |
| 62. | New City | 1.95% | 0.92%(+1.03)#62 | 0.32%(+1.63)#332 |
| 63. | Hewlett | 1.94% | 0.92%(+1.01)#63 | 0.32%(+1.62)#339 |
| 64. | Bay Shore | 1.82% | 0.92%(+0.901)#64 | 0.32%(+1.50)#355 |
| 65. | Wheatley Heights | 1.74% | 0.92%(+0.820)#65 | 0.32%(+1.42)#373 |
| 66. | Vails Gate | 1.70% | 0.92%(+0.778)#66 | 0.32%(+1.38)#383 |
| 67. | Monroe | 1.65% | 0.92%(+0.723)#67 | 0.32%(+1.33)#393 |
| 68. | Elizabethtown | 1.63% | 0.92%(+0.705)#68 | 0.32%(+1.31)#399 |
| 69. | Nanuet | 1.63% | 0.92%(+0.705)#69 | 0.32%(+1.31)#400 |
| 70. | Johnson City | 1.62% | 0.92%(+0.699)#70 | 0.32%(+1.30)#404 |
| 71. | Sodus | 1.62% | 0.92%(+0.695)#71 | 0.32%(+1.30)#405 |
| 72. | Old Westbury | 1.52% | 0.92%(+0.597)#72 | 0.32%(+1.20)#424 |
| 73. | White Plains | 1.52% | 0.92%(+0.596)#73 | 0.32%(+1.20)#425 |
| 74. | Islandia | 1.51% | 0.92%(+0.591)#74 | 0.32%(+1.19)#427 |
| 75. | West Babylon | 1.45% | 0.92%(+0.531)#75 | 0.32%(+1.13)#437 |
| 76. | Fallsburg | 1.45% | 0.92%(+0.530)#76 | 0.32%(+1.13)#439 |
| 77. | South Valley Stream | 1.44% | 0.92%(+0.517)#77 | 0.32%(+1.12)#440 |
| 78. | Riverhead | 1.44% | 0.92%(+0.516)#78 | 0.32%(+1.12)#441 |
| 79. | South Hill | 1.41% | 0.92%(+0.484)#79 | 0.32%(+1.09)#450 |
| 80. | Monsey | 1.40% | 0.92%(+0.481)#80 | 0.32%(+1.08)#452 |
| 81. | New York | 1.38% | 0.92%(+0.454)#81 | 0.32%(+1.06)#457 |
| 82. | Middletown | 1.36% | 0.92%(+0.440)#82 | 0.32%(+1.04)#462 |
| 83. | New Rochelle | 1.34% | 0.92%(+0.416)#83 | 0.32%(+1.02)#470 |
| 84. | Viola | 1.33% | 0.92%(+0.405)#84 | 0.32%(+1.01)#473 |
| 85. | Romulus | 1.31% | 0.92%(+0.383)#85 | 0.32%(+0.985)#486 |
| 86. | North Bellmore | 1.29% | 0.92%(+0.368)#86 | 0.32%(+0.971)#492 |
| 87. | Farmingville | 1.27% | 0.92%(+0.351)#87 | 0.32%(+0.953)#493 |
| 88. | Mount Ivy | 1.27% | 0.92%(+0.345)#88 | 0.32%(+0.947)#494 |
| 89. | North Wantagh | 1.24% | 0.92%(+0.318)#89 | 0.32%(+0.920)#504 |
| 90. | Nesconset | 1.23% | 0.92%(+0.310)#90 | 0.32%(+0.912)#507 |
| 91. | Siena College | 1.22% | 0.92%(+0.299)#91 | 0.32%(+0.901)#513 |
| 92. | Laurel Hollow | 1.22% | 0.92%(+0.297)#92 | 0.32%(+0.899)#514 |
| 93. | Stony Brook University | 1.21% | 0.92%(+0.288)#93 | 0.32%(+0.890)#516 |
| 94. | Patchogue | 1.20% | 0.92%(+0.277)#94 | 0.32%(+0.879)#525 |
| 95. | Chatham | 1.19% | 0.92%(+0.269)#95 | 0.32%(+0.871)#528 |
| 96. | Newburgh | 1.17% | 0.92%(+0.246)#96 | 0.32%(+0.848)#535 |
| 97. | Sloatsburg | 1.15% | 0.92%(+0.229)#97 | 0.32%(+0.831)#541 |
| 98. | Champlain | 1.10% | 0.92%(+0.175)#98 | 0.32%(+0.777)#552 |
| 99. | North Merrick | 1.07% | 0.92%(+0.152)#99 | 0.32%(+0.754)#562 |
| 100. | Rotterdam | 1.06% | 0.92%(+0.140)#100 | 0.32%(+0.743)#564 |
Common Questions
What are the Top 10 Cities with the Highest Percentage of Haitian Population in New York?
Top 10 Cities with the Highest Percentage of Haitian Population in New York are:
#1
20.25%
#2
17.94%
#3
12.95%
#4
11.75%
#5
11.46%
#6
10.50%
#7
8.14%
#8
7.50%
#9
6.82%
#10
6.43%
What city has the Highest Percentage of Haitian Population in New York?
East Kingston has the Highest Percentage of Haitian Population in New York with 20.25%.
What is the Percentage of Haitian Population in the State of New York?
Percentage of Haitian Population in New York is 0.92%.
What is the Percentage of Haitian Population in the United States?
Percentage of Haitian Population in the United States is 0.32%.