Kingsburg, CA Map & Demographics
Kingsburg Map
Kingsburg Overview
$32,155
PER CAPITA INCOME
$83,242
AVG FAMILY INCOME
$74,897
AVG HOUSEHOLD INCOME
42.0%
WAGE / INCOME GAP [ % ]
58.0¢/ $1
WAGE / INCOME GAP [ $ ]
$10,545
FAMILY INCOME DEFICIT
0.44
INEQUALITY / GINI INDEX
12,490
TOTAL POPULATION
5,837
MALE POPULATION
6,653
FEMALE POPULATION
87.73
MALES / 100 FEMALES
113.98
FEMALES / 100 MALES
37.6
MEDIAN AGE
3.6
AVG FAMILY SIZE
2.9
AVG HOUSEHOLD SIZE
5,429
LABOR FORCE [ PEOPLE ]
55.3%
PERCENT IN LABOR FORCE
5.5%
UNEMPLOYMENT RATE
Kingsburg Zip Codes
Kingsburg Area Codes
Income in Kingsburg
Income Overview in Kingsburg
Per Capita Income in Kingsburg is $32,155, while median incomes of families and households are $83,242 and $74,897 respectively.
| Characteristic | Number | Measure |
| Per Capita Income | 12,490 | $32,155 |
| Median Family Income | 2,939 | $83,242 |
| Mean Family Income | 2,939 | $107,209 |
| Median Household Income | 4,260 | $74,897 |
| Mean Household Income | 4,260 | $89,579 |
| Income Deficit | 2,939 | $10,545 |
| Wage / Income Gap (%) | 12,490 | 42.03% |
| Wage / Income Gap ($) | 12,490 | 57.97¢ per $1 |
| Gini / Inequality Index | 12,490 | 0.44 |
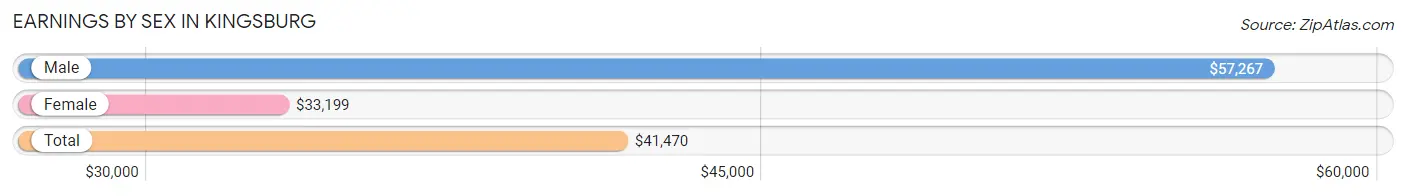
Earnings by Sex in Kingsburg
Average Earnings in Kingsburg are $41,470, $57,267 for men and $33,199 for women, a difference of 42.0%.
| Sex | Number | Average Earnings |
| Male | 3,048 (53.5%) | $57,267 |
| Female | 2,653 (46.5%) | $33,199 |
| Total | 5,701 (100.0%) | $41,470 |
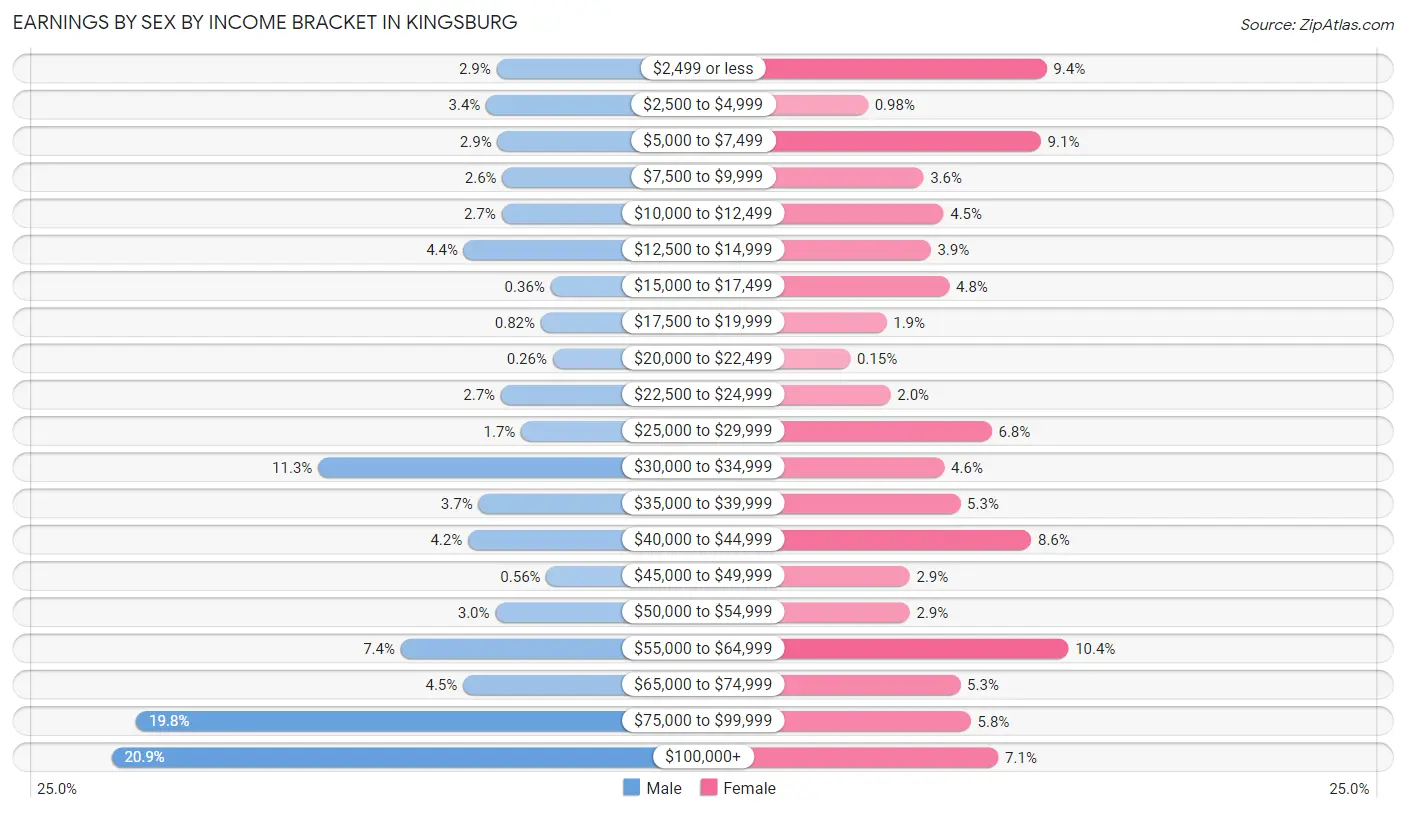
Earnings by Sex by Income Bracket in Kingsburg
The most common earnings brackets in Kingsburg are $100,000+ for men (638 | 20.9%) and $55,000 to $64,999 for women (275 | 10.4%).
| Income | Male | Female |
| $2,499 or less | 88 (2.9%) | 248 (9.3%) |
| $2,500 to $4,999 | 103 (3.4%) | 26 (1.0%) |
| $5,000 to $7,499 | 87 (2.9%) | 241 (9.1%) |
| $7,500 to $9,999 | 80 (2.6%) | 95 (3.6%) |
| $10,000 to $12,499 | 81 (2.7%) | 120 (4.5%) |
| $12,500 to $14,999 | 135 (4.4%) | 104 (3.9%) |
| $15,000 to $17,499 | 11 (0.4%) | 127 (4.8%) |
| $17,500 to $19,999 | 25 (0.8%) | 49 (1.8%) |
| $20,000 to $22,499 | 8 (0.3%) | 4 (0.2%) |
| $22,500 to $24,999 | 82 (2.7%) | 54 (2.0%) |
| $25,000 to $29,999 | 53 (1.7%) | 180 (6.8%) |
| $30,000 to $34,999 | 343 (11.3%) | 121 (4.6%) |
| $35,000 to $39,999 | 114 (3.7%) | 141 (5.3%) |
| $40,000 to $44,999 | 129 (4.2%) | 229 (8.6%) |
| $45,000 to $49,999 | 17 (0.6%) | 78 (2.9%) |
| $50,000 to $54,999 | 90 (2.9%) | 78 (2.9%) |
| $55,000 to $64,999 | 225 (7.4%) | 275 (10.4%) |
| $65,000 to $74,999 | 136 (4.5%) | 141 (5.3%) |
| $75,000 to $99,999 | 603 (19.8%) | 154 (5.8%) |
| $100,000+ | 638 (20.9%) | 188 (7.1%) |
| Total | 3,048 (100.0%) | 2,653 (100.0%) |
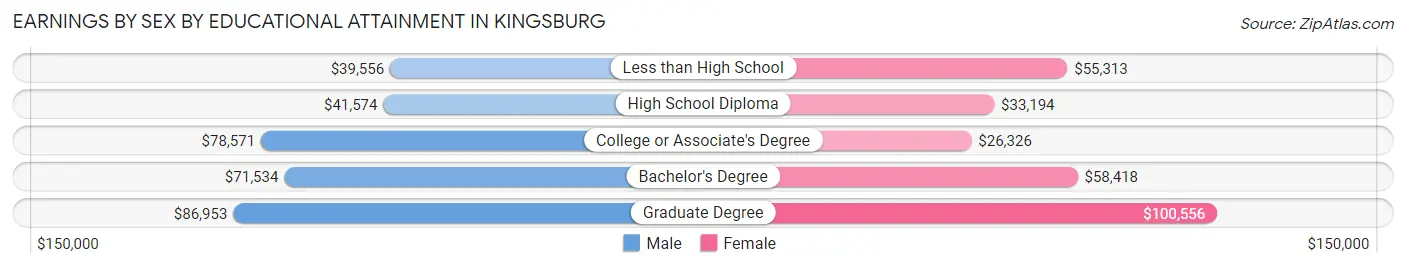
Earnings by Sex by Educational Attainment in Kingsburg
Average earnings in Kingsburg are $66,579 for men and $40,747 for women, a difference of 38.8%. Men with an educational attainment of graduate degree enjoy the highest average annual earnings of $86,953, while those with less than high school education earn the least with $39,556. Women with an educational attainment of graduate degree earn the most with the average annual earnings of $100,556, while those with college or associate's degree education have the smallest earnings of $26,326.
| Educational Attainment | Male Income | Female Income |
| Less than High School | $39,556 | $55,313 |
| High School Diploma | $41,574 | $33,194 |
| College or Associate's Degree | $78,571 | $26,326 |
| Bachelor's Degree | $71,534 | $58,418 |
| Graduate Degree | $86,953 | $100,556 |
| Total | $66,579 | $40,747 |
Family Income in Kingsburg
Family Income Brackets in Kingsburg
According to the Kingsburg family income data, there are 614 families falling into the $50,000 to $74,999 income range, which is the most common income bracket and makes up 20.9% of all families. Conversely, the $10,000 to $14,999 income bracket is the least frequent group with only 9 families (0.3%) belonging to this category.
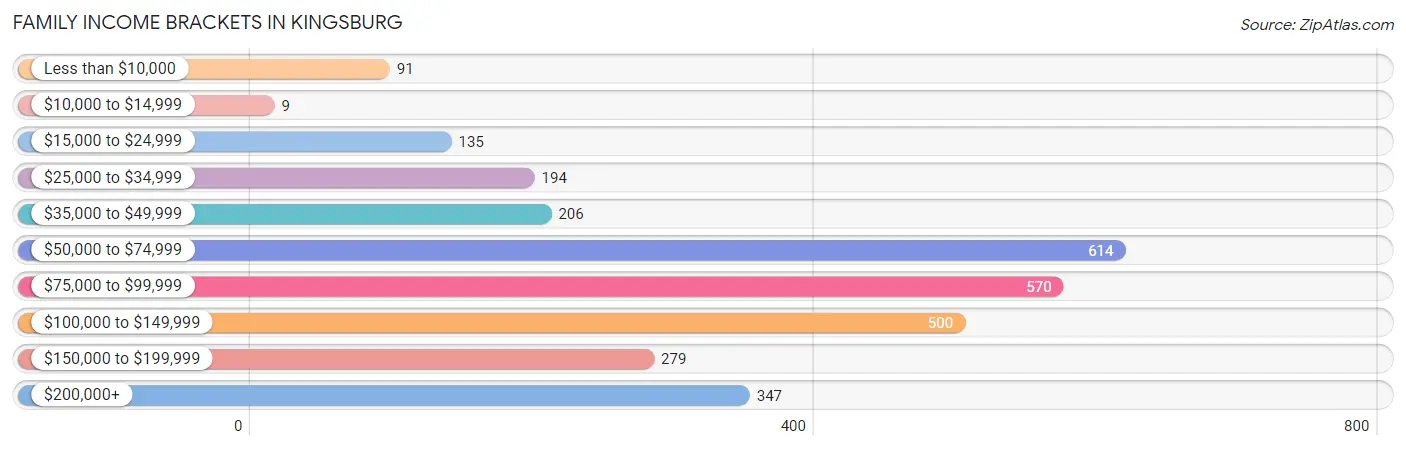
| Income Bracket | # Families | % Families |
| Less than $10,000 | 91 | 3.1% |
| $10,000 to $14,999 | 9 | 0.3% |
| $15,000 to $24,999 | 135 | 4.6% |
| $25,000 to $34,999 | 194 | 6.6% |
| $35,000 to $49,999 | 206 | 7.0% |
| $50,000 to $74,999 | 614 | 20.9% |
| $75,000 to $99,999 | 570 | 19.4% |
| $100,000 to $149,999 | 500 | 17.0% |
| $150,000 to $199,999 | 279 | 9.5% |
| $200,000+ | 347 | 11.8% |
Family Income by Famaliy Size in Kingsburg
4-person families (514 | 17.5%) account for the highest median family income in Kingsburg with $107,500 per family, while 2-person families (1,265 | 43.0%) have the highest median income of $40,413 per family member.
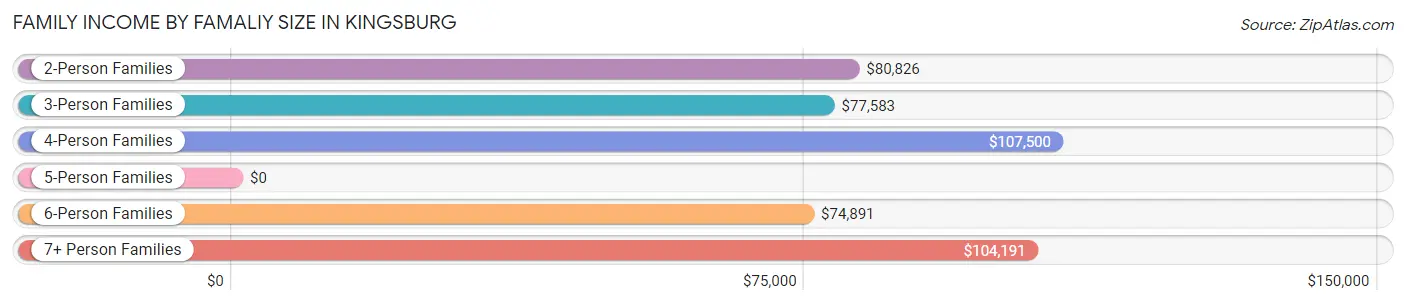
| Income Bracket | # Families | Median Income |
| 2-Person Families | 1,265 (43.0%) | $80,826 |
| 3-Person Families | 652 (22.2%) | $77,583 |
| 4-Person Families | 514 (17.5%) | $107,500 |
| 5-Person Families | 286 (9.7%) | $0 |
| 6-Person Families | 120 (4.1%) | $74,891 |
| 7+ Person Families | 102 (3.5%) | $104,191 |
| Total | 2,939 (100.0%) | $83,242 |
Family Income by Number of Earners in Kingsburg
The median family income in Kingsburg is $83,242, with families comprising 3+ earners (320) having the highest median family income of $133,148, while families with no earners (361) have the lowest median family income of $49,781, accounting for 10.9% and 12.3% of families, respectively.
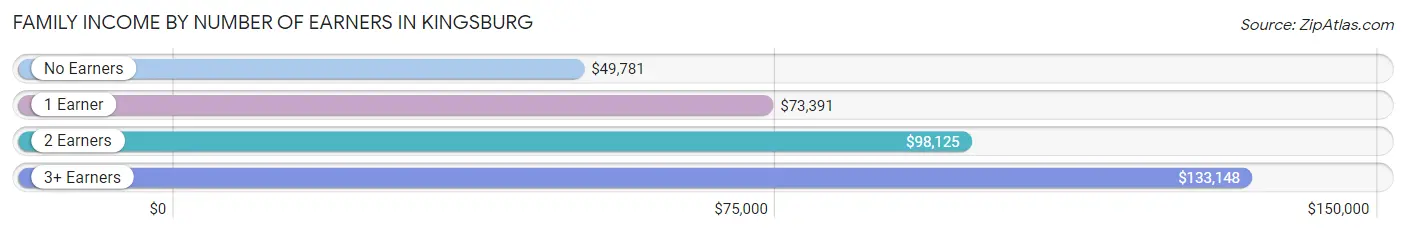
| Number of Earners | # Families | Median Income |
| No Earners | 361 (12.3%) | $49,781 |
| 1 Earner | 1,151 (39.2%) | $73,391 |
| 2 Earners | 1,107 (37.7%) | $98,125 |
| 3+ Earners | 320 (10.9%) | $133,148 |
| Total | 2,939 (100.0%) | $83,242 |
Household Income in Kingsburg
Household Income Brackets in Kingsburg
With 814 households falling in the category, the $75,000 to $99,999 income range is the most frequent in Kingsburg, accounting for 19.1% of all households. In contrast, only 162 households (3.8%) fall into the $10,000 to $14,999 income bracket, making it the least populous group.
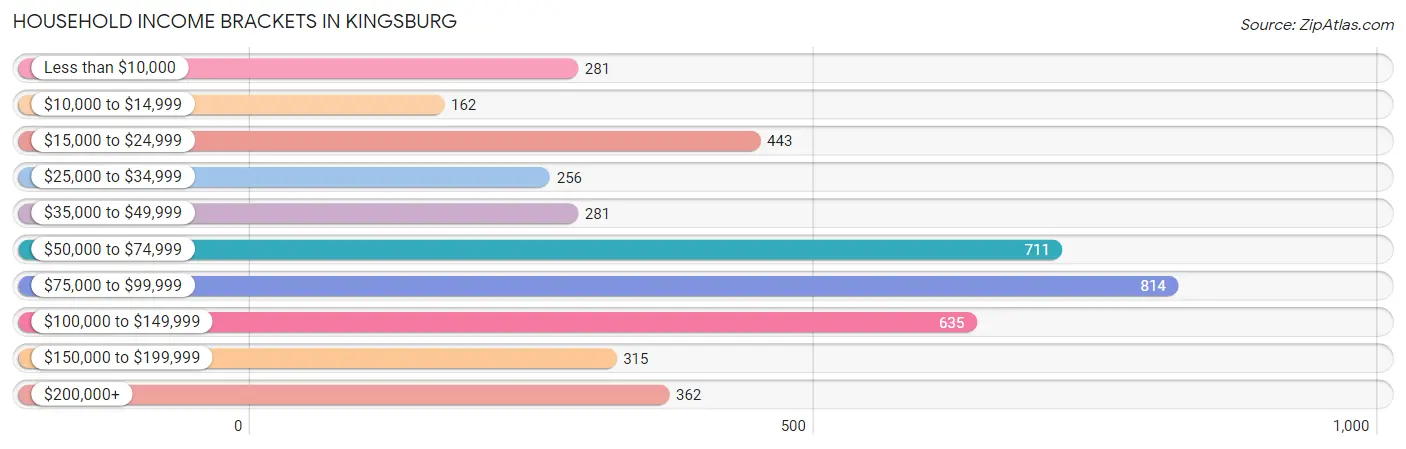
| Income Bracket | # Households | % Households |
| Less than $10,000 | 281 | 6.6% |
| $10,000 to $14,999 | 162 | 3.8% |
| $15,000 to $24,999 | 443 | 10.4% |
| $25,000 to $34,999 | 256 | 6.0% |
| $35,000 to $49,999 | 281 | 6.6% |
| $50,000 to $74,999 | 711 | 16.7% |
| $75,000 to $99,999 | 814 | 19.1% |
| $100,000 to $149,999 | 635 | 14.9% |
| $150,000 to $199,999 | 315 | 7.4% |
| $200,000+ | 362 | 8.5% |
Household Income by Householder Age in Kingsburg
The median household income in Kingsburg is $74,897, with the highest median household income of $80,699 found in the 45 to 64 years age bracket for the primary householder. A total of 1,421 households (33.4%) fall into this category. Meanwhile, the 15 to 24 years age bracket for the primary householder has the lowest median household income of $0, with 78 households (1.8%) in this group.
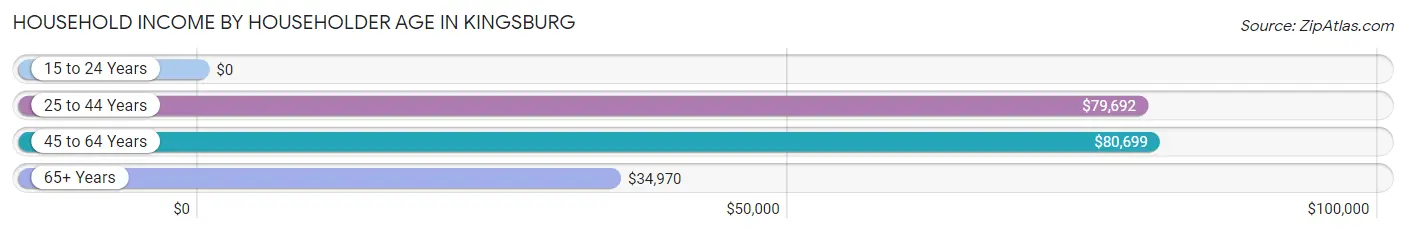
| Income Bracket | # Households | Median Income |
| 15 to 24 Years | 78 (1.8%) | $0 |
| 25 to 44 Years | 1,514 (35.5%) | $79,692 |
| 45 to 64 Years | 1,421 (33.4%) | $80,699 |
| 65+ Years | 1,247 (29.3%) | $34,970 |
| Total | 4,260 (100.0%) | $74,897 |
Poverty in Kingsburg
Income Below Poverty by Sex and Age in Kingsburg
With 9.6% poverty level for males and 9.5% for females among the residents of Kingsburg, 18 to 24 year old males and 35 to 44 year old females are the most vulnerable to poverty, with 149 males (26.3%) and 188 females (17.4%) in their respective age groups living below the poverty level.
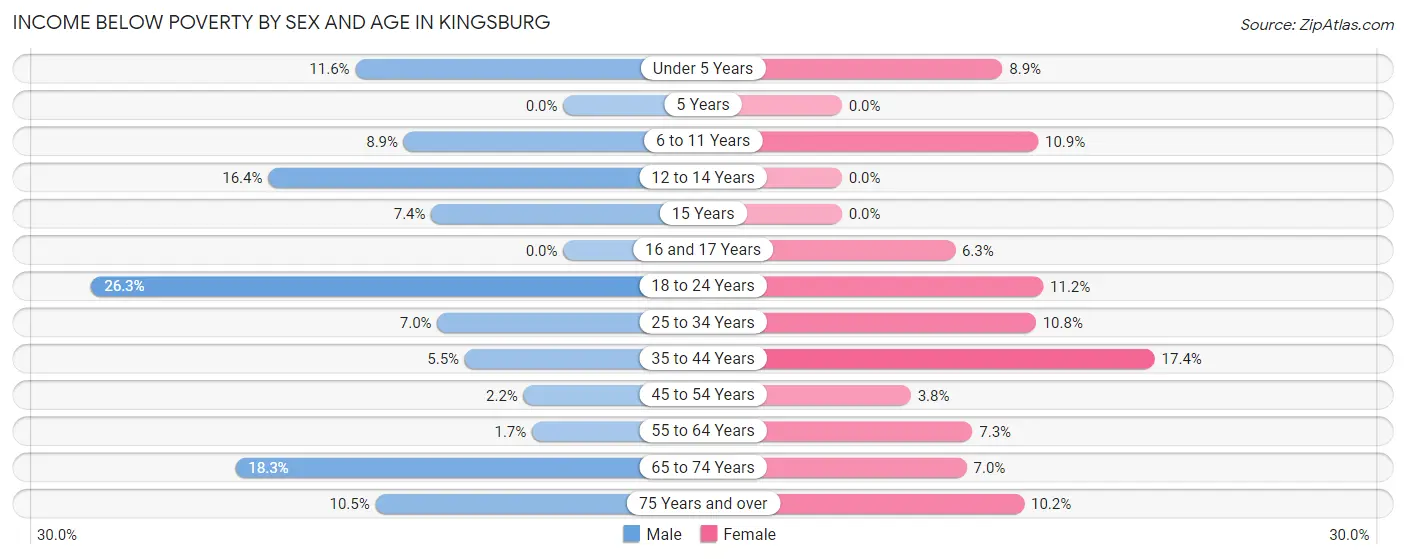
| Age Bracket | Male | Female |
| Under 5 Years | 22 (11.6%) | 37 (8.9%) |
| 5 Years | 0 (0.0%) | 0 (0.0%) |
| 6 to 11 Years | 72 (8.9%) | 60 (10.9%) |
| 12 to 14 Years | 35 (16.4%) | 0 (0.0%) |
| 15 Years | 5 (7.3%) | 0 (0.0%) |
| 16 and 17 Years | 0 (0.0%) | 24 (6.3%) |
| 18 to 24 Years | 149 (26.3%) | 74 (11.2%) |
| 25 to 34 Years | 44 (7.0%) | 70 (10.8%) |
| 35 to 44 Years | 57 (5.5%) | 188 (17.4%) |
| 45 to 54 Years | 13 (2.2%) | 21 (3.8%) |
| 55 to 64 Years | 8 (1.7%) | 63 (7.3%) |
| 65 to 74 Years | 113 (18.3%) | 43 (7.0%) |
| 75 Years and over | 41 (10.5%) | 46 (10.2%) |
| Total | 559 (9.6%) | 626 (9.5%) |
Income Above Poverty by Sex and Age in Kingsburg
According to the poverty statistics in Kingsburg, males aged 5 years and females aged 12 to 14 years are the age groups that are most secure financially, with 100.0% of males and 100.0% of females in these age groups living above the poverty line.
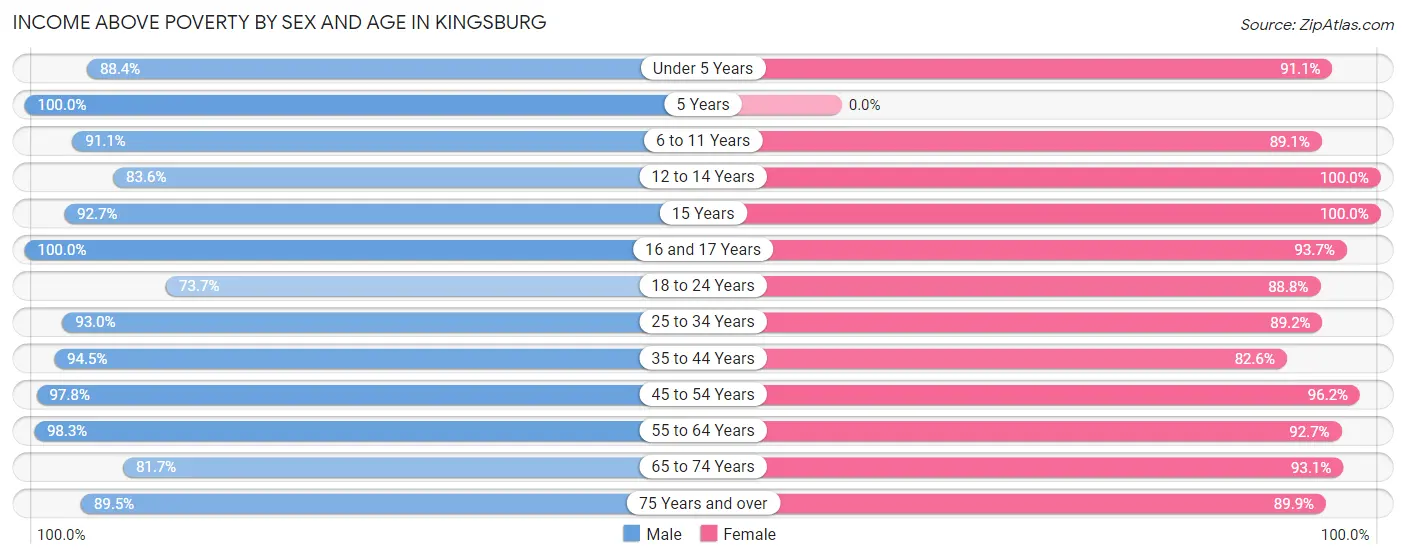
| Age Bracket | Male | Female |
| Under 5 Years | 168 (88.4%) | 377 (91.1%) |
| 5 Years | 52 (100.0%) | 0 (0.0%) |
| 6 to 11 Years | 739 (91.1%) | 489 (89.1%) |
| 12 to 14 Years | 178 (83.6%) | 245 (100.0%) |
| 15 Years | 63 (92.6%) | 131 (100.0%) |
| 16 and 17 Years | 177 (100.0%) | 357 (93.7%) |
| 18 to 24 Years | 418 (73.7%) | 586 (88.8%) |
| 25 to 34 Years | 584 (93.0%) | 578 (89.2%) |
| 35 to 44 Years | 984 (94.5%) | 891 (82.6%) |
| 45 to 54 Years | 575 (97.8%) | 526 (96.2%) |
| 55 to 64 Years | 452 (98.3%) | 804 (92.7%) |
| 65 to 74 Years | 506 (81.7%) | 576 (93.0%) |
| 75 Years and over | 351 (89.5%) | 407 (89.8%) |
| Total | 5,247 (90.4%) | 5,967 (90.5%) |
Income Below Poverty Among Married-Couple Families in Kingsburg
The poverty statistics for married-couple families in Kingsburg show that 4.8% or 102 of the total 2,130 families live below the poverty line. Families with 3 or 4 children have the highest poverty rate of 16.9%, comprising of 33 families. On the other hand, families with no children have the lowest poverty rate of 2.3%, which includes 29 families.
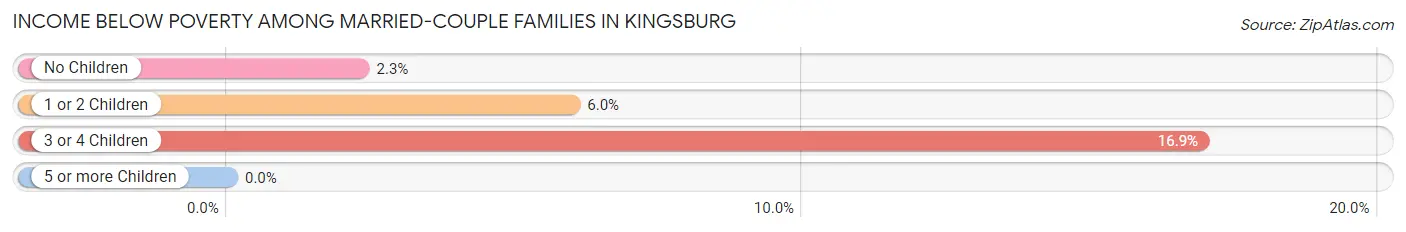
| Children | Above Poverty | Below Poverty |
| No Children | 1,235 (97.7%) | 29 (2.3%) |
| 1 or 2 Children | 631 (94.0%) | 40 (6.0%) |
| 3 or 4 Children | 162 (83.1%) | 33 (16.9%) |
| 5 or more Children | 0 (0.0%) | 0 (0.0%) |
| Total | 2,028 (95.2%) | 102 (4.8%) |
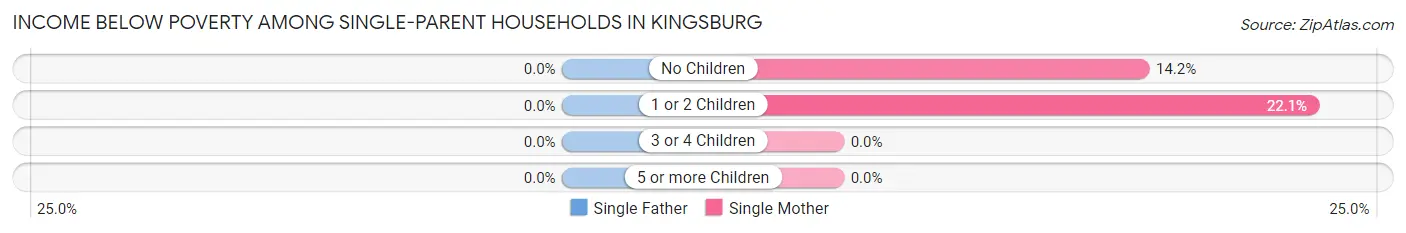
Income Below Poverty Among Single-Parent Households in Kingsburg
| Children | Single Father | Single Mother |
| No Children | 0 (0.0%) | 31 (14.2%) |
| 1 or 2 Children | 0 (0.0%) | 54 (22.1%) |
| 3 or 4 Children | 0 (0.0%) | 0 (0.0%) |
| 5 or more Children | 0 (0.0%) | 0 (0.0%) |
| Total | 0 (0.0%) | 85 (13.5%) |
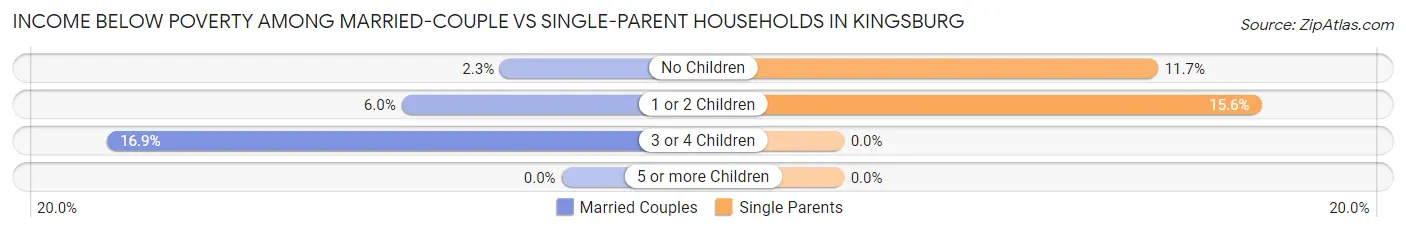
Income Below Poverty Among Married-Couple vs Single-Parent Households in Kingsburg
The poverty data for Kingsburg shows that 102 of the married-couple family households (4.8%) and 85 of the single-parent households (10.5%) are living below the poverty level. Within the married-couple family households, those with 3 or 4 children have the highest poverty rate, with 33 households (16.9%) falling below the poverty line. Among the single-parent households, those with 1 or 2 children have the highest poverty rate, with 54 household (15.6%) living below poverty.
| Children | Married-Couple Families | Single-Parent Households |
| No Children | 29 (2.3%) | 31 (11.7%) |
| 1 or 2 Children | 40 (6.0%) | 54 (15.6%) |
| 3 or 4 Children | 33 (16.9%) | 0 (0.0%) |
| 5 or more Children | 0 (0.0%) | 0 (0.0%) |
| Total | 102 (4.8%) | 85 (10.5%) |
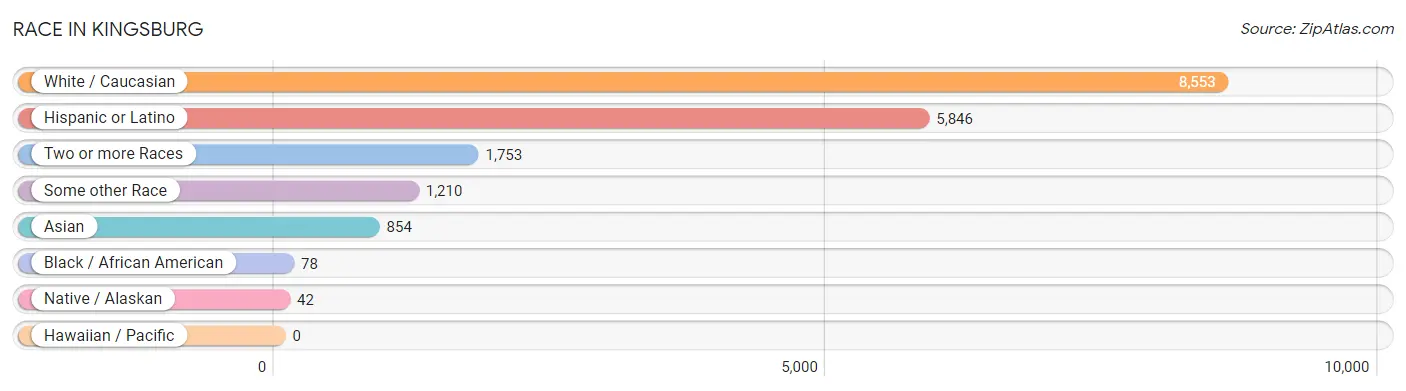
Race in Kingsburg
The most populous races in Kingsburg are White / Caucasian (8,553 | 68.5%), Hispanic or Latino (5,846 | 46.8%), and Two or more Races (1,753 | 14.0%).
| Race | # Population | % Population |
| Asian | 854 | 6.8% |
| Black / African American | 78 | 0.6% |
| Hawaiian / Pacific | 0 | 0.0% |
| Hispanic or Latino | 5,846 | 46.8% |
| Native / Alaskan | 42 | 0.3% |
| White / Caucasian | 8,553 | 68.5% |
| Two or more Races | 1,753 | 14.0% |
| Some other Race | 1,210 | 9.7% |
| Total | 12,490 | 100.0% |
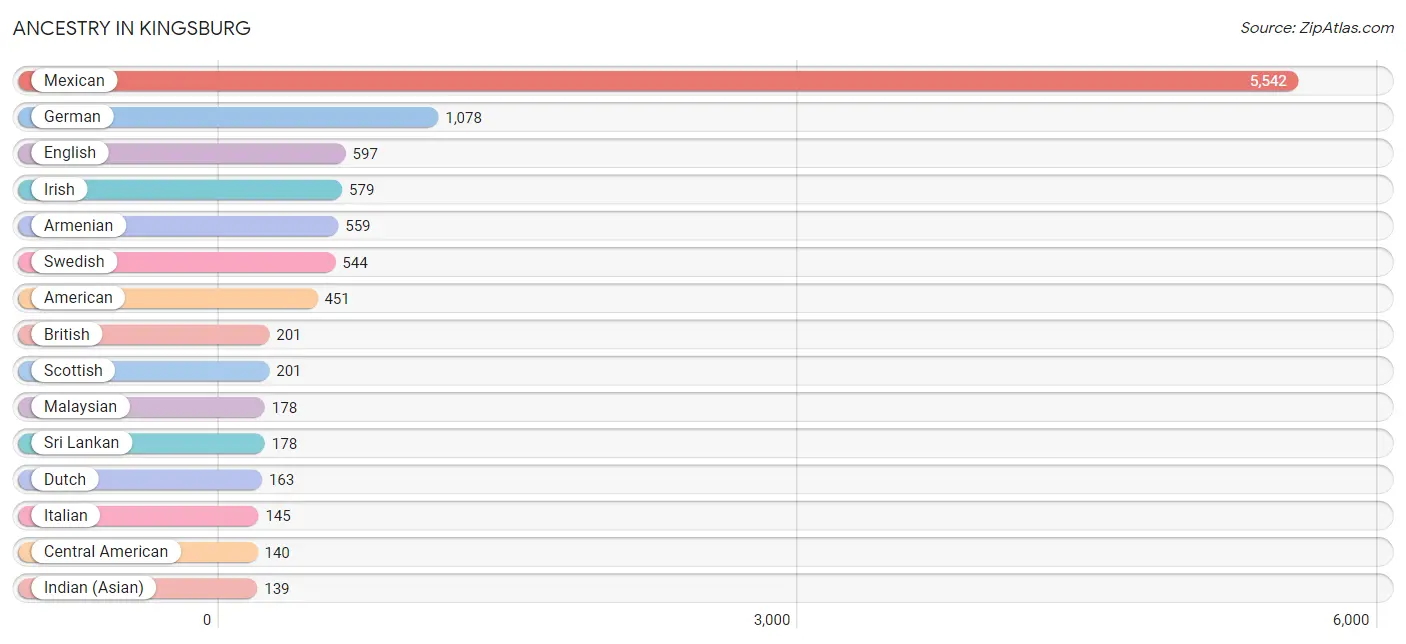
Ancestry in Kingsburg
The most populous ancestries reported in Kingsburg are Mexican (5,542 | 44.4%), German (1,078 | 8.6%), English (597 | 4.8%), Irish (579 | 4.6%), and Armenian (559 | 4.5%), together accounting for 66.9% of all Kingsburg residents.
| Ancestry | # Population | % Population |
| American | 451 | 3.6% |
| Arab | 128 | 1.0% |
| Armenian | 559 | 4.5% |
| Bhutanese | 100 | 0.8% |
| British | 201 | 1.6% |
| Canadian | 27 | 0.2% |
| Central American | 140 | 1.1% |
| Cherokee | 48 | 0.4% |
| Choctaw | 29 | 0.2% |
| Creek | 12 | 0.1% |
| Czech | 81 | 0.6% |
| Danish | 56 | 0.4% |
| Dutch | 163 | 1.3% |
| English | 597 | 4.8% |
| European | 95 | 0.8% |
| Finnish | 38 | 0.3% |
| French | 54 | 0.4% |
| German | 1,078 | 8.6% |
| Guatemalan | 105 | 0.8% |
| Indian (Asian) | 139 | 1.1% |
| Irish | 579 | 4.6% |
| Italian | 145 | 1.2% |
| Japanese | 124 | 1.0% |
| Korean | 71 | 0.6% |
| Malaysian | 178 | 1.4% |
| Mexican | 5,542 | 44.4% |
| Navajo | 18 | 0.1% |
| Northern European | 18 | 0.1% |
| Norwegian | 24 | 0.2% |
| Palestinian | 29 | 0.2% |
| Polish | 11 | 0.1% |
| Portuguese | 105 | 0.8% |
| Pueblo | 32 | 0.3% |
| Puerto Rican | 101 | 0.8% |
| Russian | 76 | 0.6% |
| Salvadoran | 35 | 0.3% |
| Scandinavian | 94 | 0.7% |
| Scotch-Irish | 19 | 0.2% |
| Scottish | 201 | 1.6% |
| Spanish | 10 | 0.1% |
| Sri Lankan | 178 | 1.4% |
| Swedish | 544 | 4.4% |
| Swiss | 75 | 0.6% |
| Syrian | 47 | 0.4% |
| Thai | 67 | 0.5% |
| Welsh | 6 | 0.1% | View All 46 Rows |
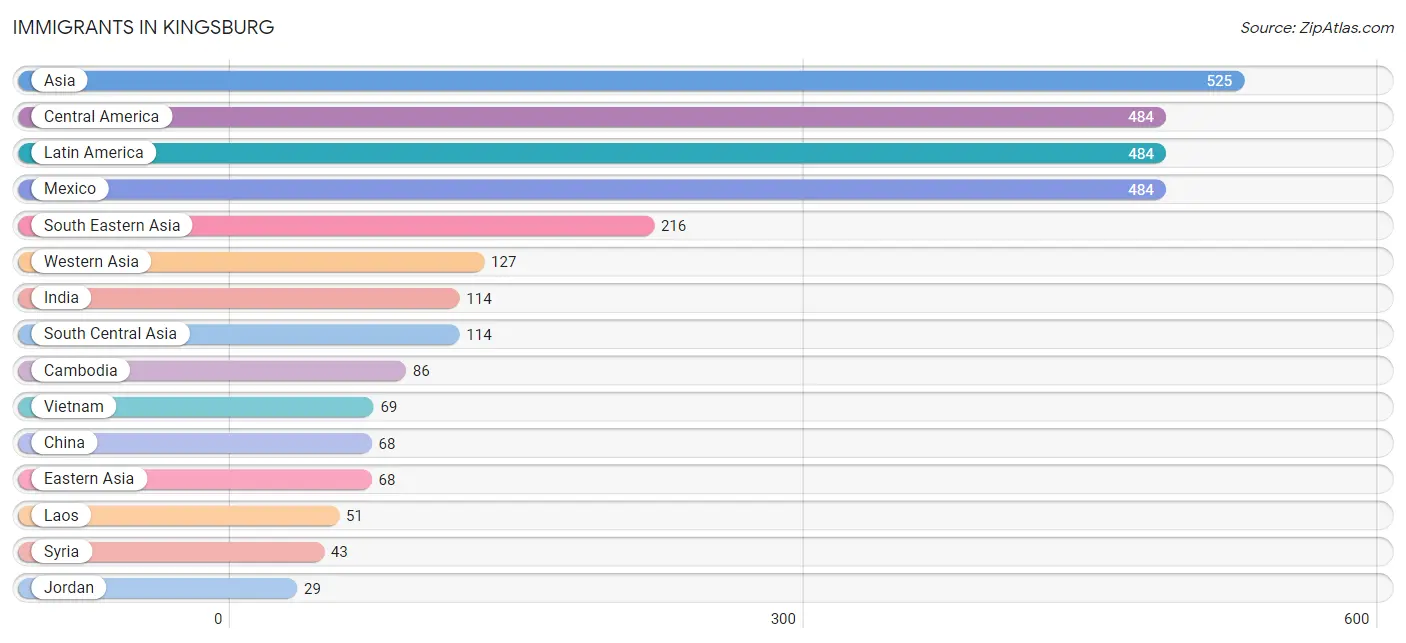
Immigrants in Kingsburg
The most numerous immigrant groups reported in Kingsburg came from Asia (525 | 4.2%), Central America (484 | 3.9%), Latin America (484 | 3.9%), Mexico (484 | 3.9%), and South Eastern Asia (216 | 1.7%), together accounting for 17.6% of all Kingsburg residents.
| Immigration Origin | # Population | % Population |
| Armenia | 21 | 0.2% |
| Asia | 525 | 4.2% |
| Cambodia | 86 | 0.7% |
| Central America | 484 | 3.9% |
| China | 68 | 0.5% |
| Eastern Asia | 68 | 0.5% |
| Eastern Europe | 15 | 0.1% |
| Europe | 22 | 0.2% |
| India | 114 | 0.9% |
| Israel | 11 | 0.1% |
| Jordan | 29 | 0.2% |
| Kuwait | 23 | 0.2% |
| Laos | 51 | 0.4% |
| Latin America | 484 | 3.9% |
| Mexico | 484 | 3.9% |
| Portugal | 7 | 0.1% |
| Russia | 15 | 0.1% |
| South Central Asia | 114 | 0.9% |
| South Eastern Asia | 216 | 1.7% |
| Southern Europe | 7 | 0.1% |
| Syria | 43 | 0.3% |
| Vietnam | 69 | 0.5% |
| Western Asia | 127 | 1.0% | View All 23 Rows |
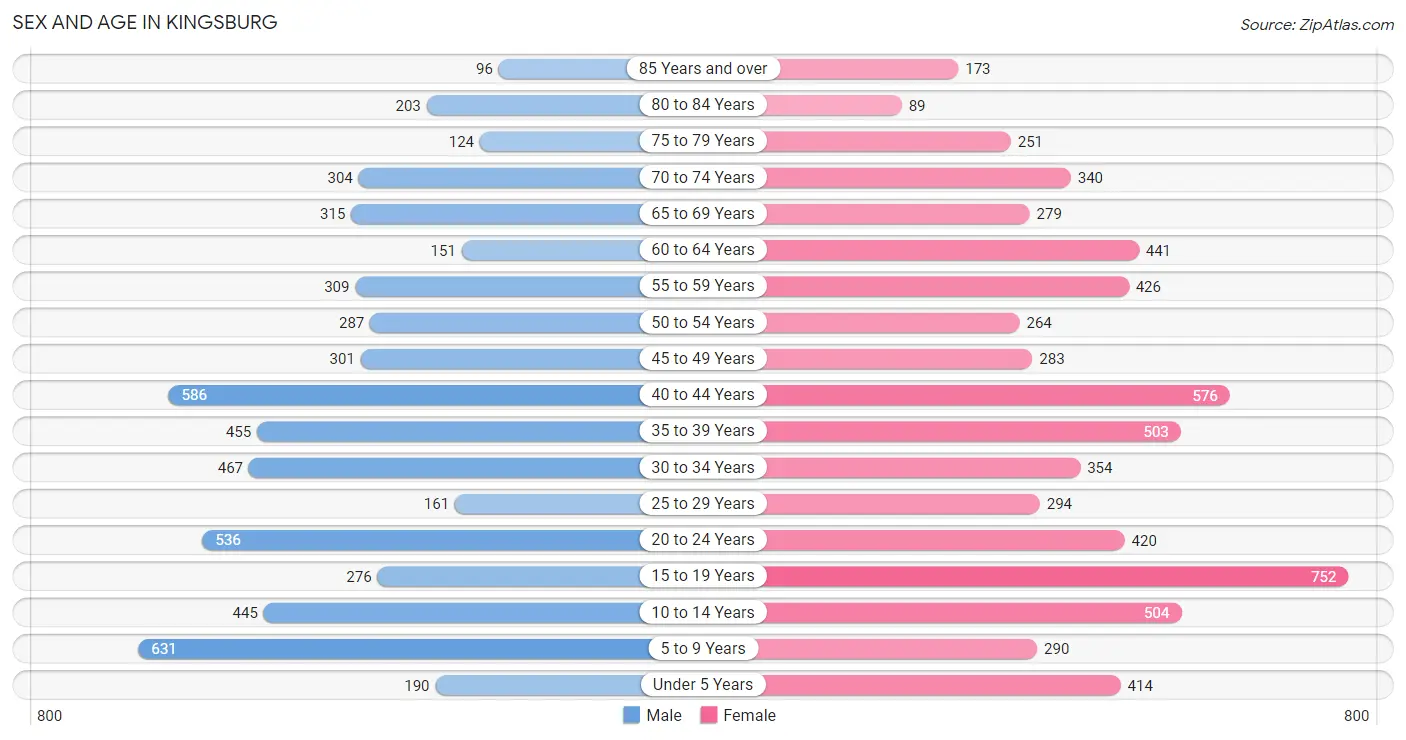
Sex and Age in Kingsburg
Sex and Age in Kingsburg
The most populous age groups in Kingsburg are 5 to 9 Years (631 | 10.8%) for men and 15 to 19 Years (752 | 11.3%) for women.
| Age Bracket | Male | Female |
| Under 5 Years | 190 (3.3%) | 414 (6.2%) |
| 5 to 9 Years | 631 (10.8%) | 290 (4.4%) |
| 10 to 14 Years | 445 (7.6%) | 504 (7.6%) |
| 15 to 19 Years | 276 (4.7%) | 752 (11.3%) |
| 20 to 24 Years | 536 (9.2%) | 420 (6.3%) |
| 25 to 29 Years | 161 (2.8%) | 294 (4.4%) |
| 30 to 34 Years | 467 (8.0%) | 354 (5.3%) |
| 35 to 39 Years | 455 (7.8%) | 503 (7.6%) |
| 40 to 44 Years | 586 (10.0%) | 576 (8.7%) |
| 45 to 49 Years | 301 (5.2%) | 283 (4.3%) |
| 50 to 54 Years | 287 (4.9%) | 264 (4.0%) |
| 55 to 59 Years | 309 (5.3%) | 426 (6.4%) |
| 60 to 64 Years | 151 (2.6%) | 441 (6.6%) |
| 65 to 69 Years | 315 (5.4%) | 279 (4.2%) |
| 70 to 74 Years | 304 (5.2%) | 340 (5.1%) |
| 75 to 79 Years | 124 (2.1%) | 251 (3.8%) |
| 80 to 84 Years | 203 (3.5%) | 89 (1.3%) |
| 85 Years and over | 96 (1.6%) | 173 (2.6%) |
| Total | 5,837 (100.0%) | 6,653 (100.0%) |
Families and Households in Kingsburg
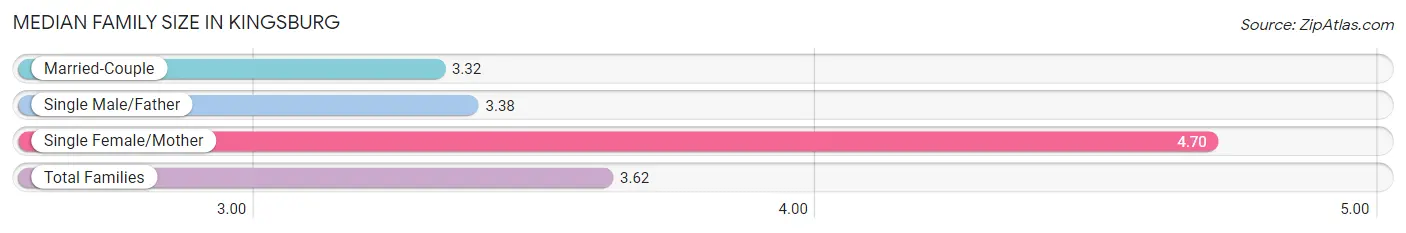
Median Family Size in Kingsburg
The median family size in Kingsburg is 3.62 persons per family, with single female/mother families (628 | 21.4%) accounting for the largest median family size of 4.7 persons per family. On the other hand, married-couple families (2,130 | 72.5%) represent the smallest median family size with 3.32 persons per family.
| Family Type | # Families | Family Size |
| Married-Couple | 2,130 (72.5%) | 3.32 |
| Single Male/Father | 181 (6.2%) | 3.38 |
| Single Female/Mother | 628 (21.4%) | 4.70 |
| Total Families | 2,939 (100.0%) | 3.62 |
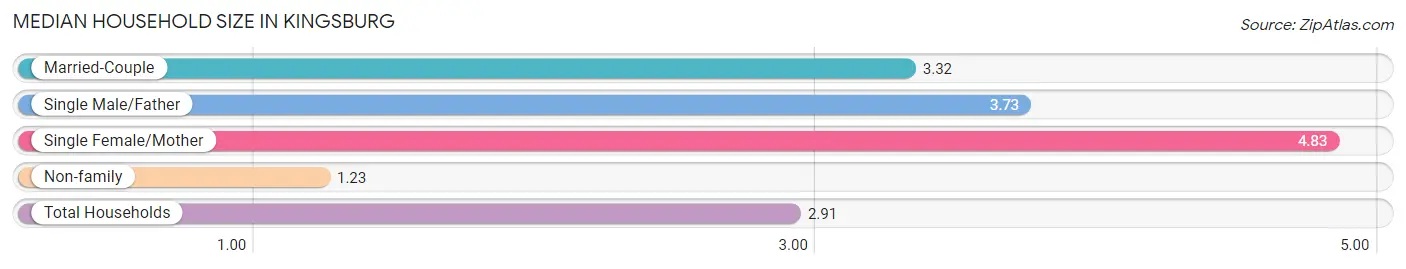
Median Household Size in Kingsburg
The median household size in Kingsburg is 2.91 persons per household, with single female/mother households (628 | 14.7%) accounting for the largest median household size of 4.83 persons per household. non-family households (1,321 | 31.0%) represent the smallest median household size with 1.23 persons per household.
| Household Type | # Households | Household Size |
| Married-Couple | 2,130 (50.0%) | 3.32 |
| Single Male/Father | 181 (4.3%) | 3.73 |
| Single Female/Mother | 628 (14.7%) | 4.83 |
| Non-family | 1,321 (31.0%) | 1.23 |
| Total Households | 4,260 (100.0%) | 2.91 |
Household Size by Marriage Status in Kingsburg
Out of a total of 4,260 households in Kingsburg, 2,939 (69.0%) are family households, while 1,321 (31.0%) are nonfamily households. The most numerous type of family households are 2-person households, comprising 1,256, and the most common type of nonfamily households are 1-person households, comprising 1,173.
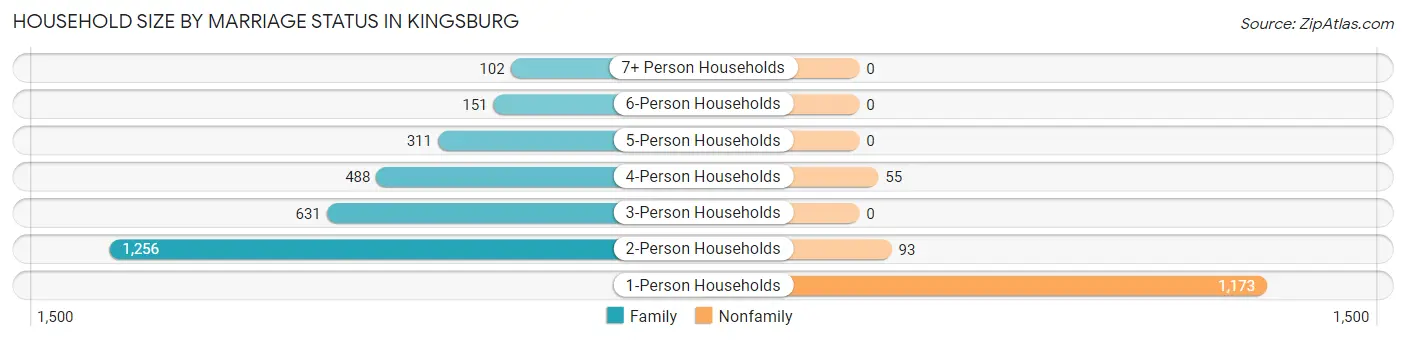
| Household Size | Family Households | Nonfamily Households |
| 1-Person Households | - | 1,173 (27.5%) |
| 2-Person Households | 1,256 (29.5%) | 93 (2.2%) |
| 3-Person Households | 631 (14.8%) | 0 (0.0%) |
| 4-Person Households | 488 (11.5%) | 55 (1.3%) |
| 5-Person Households | 311 (7.3%) | 0 (0.0%) |
| 6-Person Households | 151 (3.5%) | 0 (0.0%) |
| 7+ Person Households | 102 (2.4%) | 0 (0.0%) |
| Total | 2,939 (69.0%) | 1,321 (31.0%) |
Female Fertility in Kingsburg
Fertility by Age in Kingsburg
Average fertility rate in Kingsburg is 23.0 births per 1,000 women. Women in the age bracket of 20 to 34 years have the highest fertility rate with 71.0 births per 1,000 women. Women in the age bracket of 20 to 34 years acount for 100.0% of all women with births.
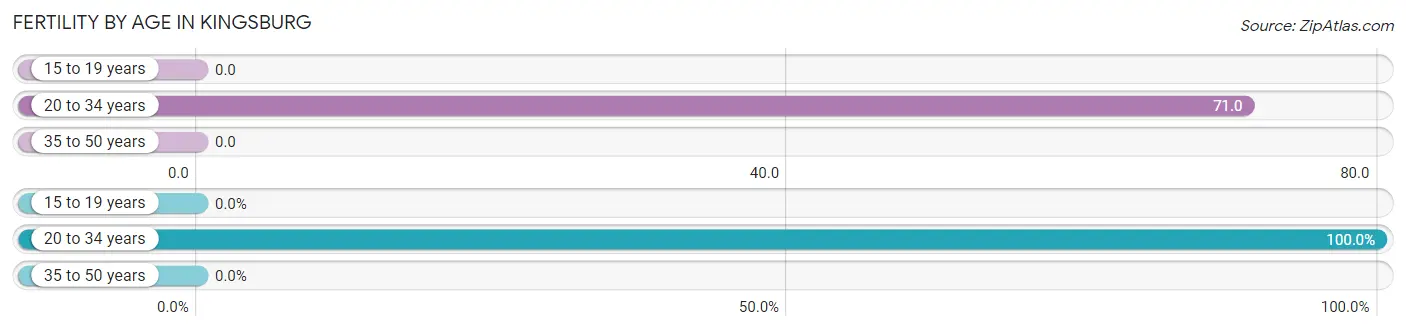
| Age Bracket | Women with Births | Births / 1,000 Women |
| 15 to 19 years | 0 (0.0%) | 0.0 |
| 20 to 34 years | 76 (100.0%) | 71.0 |
| 35 to 50 years | 0 (0.0%) | 0.0 |
| Total | 76 (100.0%) | 23.0 |
Fertility by Age by Marriage Status in Kingsburg
93.4% of women with births (76) in Kingsburg are married. The highest percentage of unmarried women with births falls into 20 to 34 years age bracket with 6.6% of them unmarried at the time of birth, while the lowest percentage of unmarried women with births belong to 20 to 34 years age bracket with 6.6% of them unmarried.
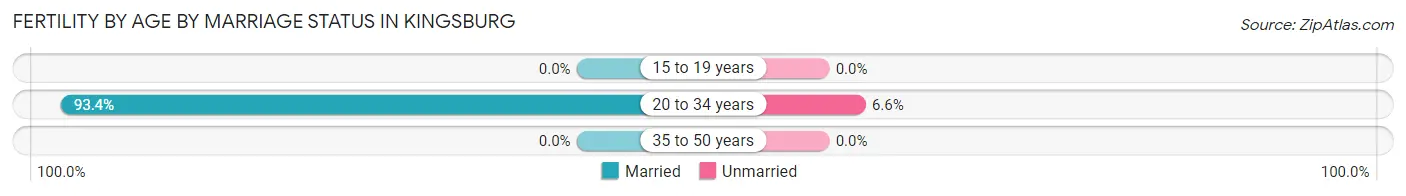
| Age Bracket | Married | Unmarried |
| 15 to 19 years | 0 (0.0%) | 0 (0.0%) |
| 20 to 34 years | 71 (93.4%) | 5 (6.6%) |
| 35 to 50 years | 0 (0.0%) | 0 (0.0%) |
| Total | 71 (93.4%) | 5 (6.6%) |
Fertility by Education in Kingsburg
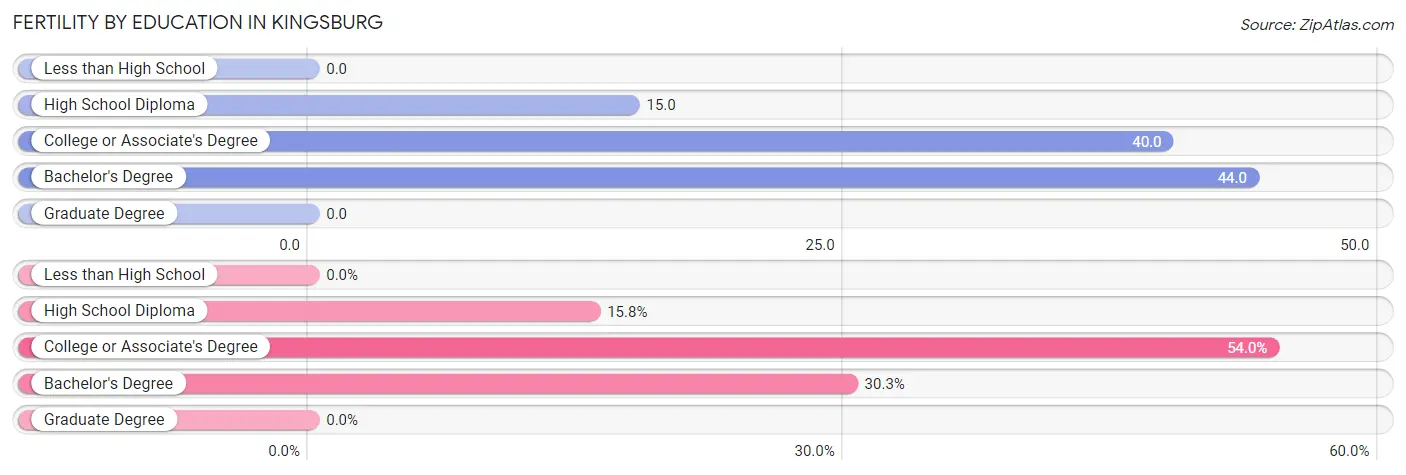
| Educational Attainment | Women with Births | Births / 1,000 Women |
| Less than High School | 0 (0.0%) | 0.0 |
| High School Diploma | 12 (15.8%) | 15.0 |
| College or Associate's Degree | 41 (53.9%) | 40.0 |
| Bachelor's Degree | 23 (30.3%) | 44.0 |
| Graduate Degree | 0 (0.0%) | 0.0 |
| Total | 76 (100.0%) | 23.0 |
Fertility by Education by Marriage Status in Kingsburg
6.6% of women with births in Kingsburg are unmarried. Women with the educational attainment of college or associate's degree are most likely to be married with 100.0% of them married at childbirth, while women with the educational attainment of high school diploma are least likely to be married with 41.7% of them unmarried at childbirth.
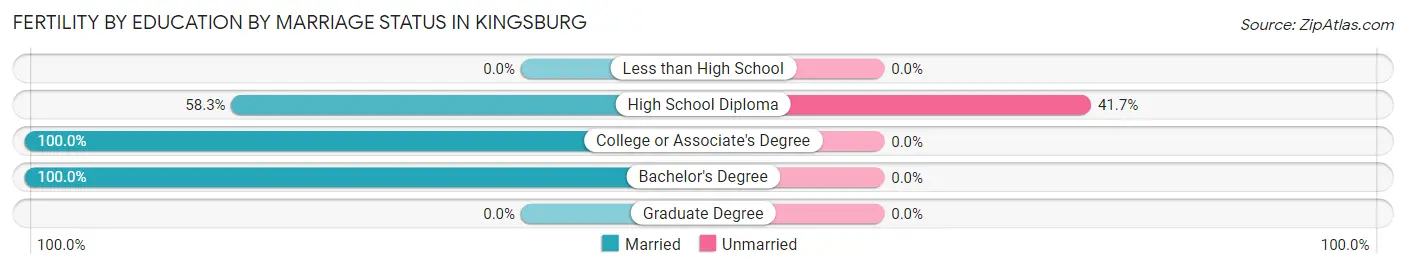
| Educational Attainment | Married | Unmarried |
| Less than High School | 0 (0.0%) | 0 (0.0%) |
| High School Diploma | 7 (58.3%) | 5 (41.7%) |
| College or Associate's Degree | 41 (100.0%) | 0 (0.0%) |
| Bachelor's Degree | 23 (100.0%) | 0 (0.0%) |
| Graduate Degree | 0 (0.0%) | 0 (0.0%) |
| Total | 71 (93.4%) | 5 (6.6%) |
Employment Characteristics in Kingsburg
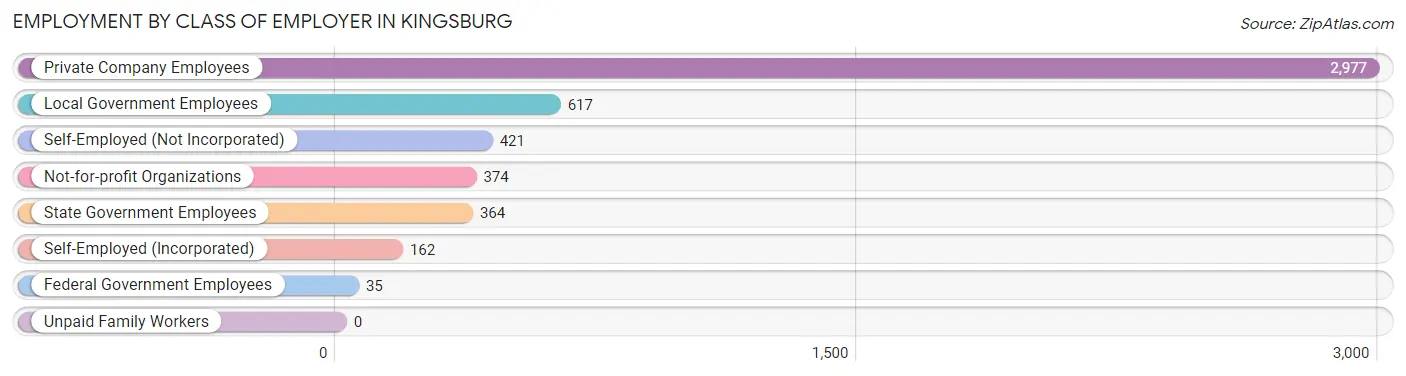
Employment by Class of Employer in Kingsburg
Among the 4,950 employed individuals in Kingsburg, private company employees (2,977 | 60.1%), local government employees (617 | 12.5%), and self-employed (not incorporated) (421 | 8.5%) make up the most common classes of employment.
| Employer Class | # Employees | % Employees |
| Private Company Employees | 2,977 | 60.1% |
| Self-Employed (Incorporated) | 162 | 3.3% |
| Self-Employed (Not Incorporated) | 421 | 8.5% |
| Not-for-profit Organizations | 374 | 7.6% |
| Local Government Employees | 617 | 12.5% |
| State Government Employees | 364 | 7.3% |
| Federal Government Employees | 35 | 0.7% |
| Unpaid Family Workers | 0 | 0.0% |
| Total | 4,950 | 100.0% |
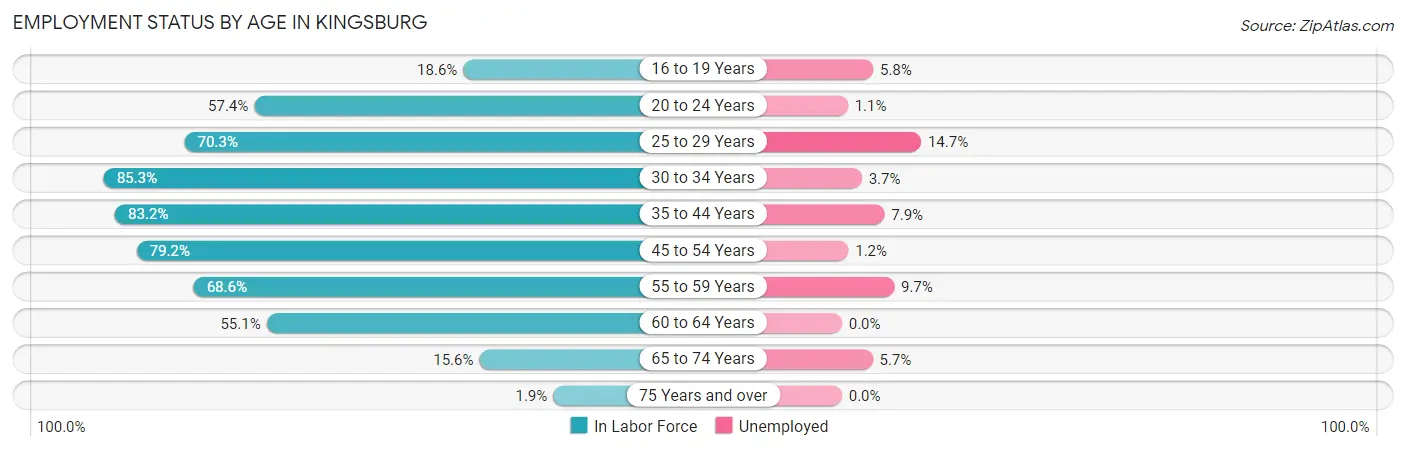
Employment Status by Age in Kingsburg
According to the labor force statistics for Kingsburg, out of the total population over 16 years of age (9,817), 55.3% or 5,429 individuals are in the labor force, with 5.5% or 299 of them unemployed. The age group with the highest labor force participation rate is 30 to 34 years, with 85.3% or 700 individuals in the labor force. Within the labor force, the 25 to 29 years age range has the highest percentage of unemployed individuals, with 14.7% or 47 of them being unemployed.
| Age Bracket | In Labor Force | Unemployed |
| 16 to 19 Years | 154 (18.6%) | 9 (5.8%) |
| 20 to 24 Years | 549 (57.4%) | 6 (1.1%) |
| 25 to 29 Years | 320 (70.3%) | 47 (14.7%) |
| 30 to 34 Years | 700 (85.3%) | 26 (3.7%) |
| 35 to 44 Years | 1,764 (83.2%) | 139 (7.9%) |
| 45 to 54 Years | 899 (79.2%) | 11 (1.2%) |
| 55 to 59 Years | 504 (68.6%) | 49 (9.7%) |
| 60 to 64 Years | 326 (55.1%) | 0 (0.0%) |
| 65 to 74 Years | 193 (15.6%) | 11 (5.7%) |
| 75 Years and over | 18 (1.9%) | 0 (0.0%) |
| Total | 5,429 (55.3%) | 299 (5.5%) |
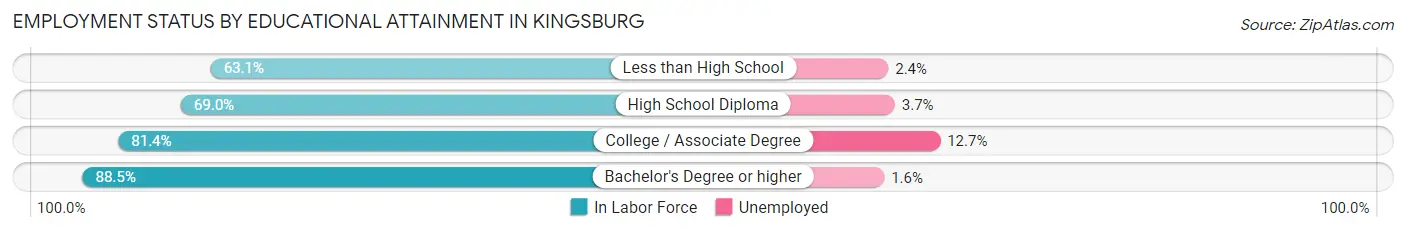
Employment Status by Educational Attainment in Kingsburg
According to labor force statistics for Kingsburg, 77.0% of individuals (4,511) out of the total population between 25 and 64 years of age (5,858) are in the labor force, with 6.0% or 271 of them being unemployed. The group with the highest labor force participation rate are those with the educational attainment of bachelor's degree or higher, with 88.5% or 1,258 individuals in the labor force. Within the labor force, individuals with college / associate degree education have the highest percentage of unemployment, with 12.7% or 193 of them being unemployed.
| Educational Attainment | In Labor Force | Unemployed |
| Less than High School | 412 (63.1%) | 16 (2.4%) |
| High School Diploma | 1,321 (69.0%) | 71 (3.7%) |
| College / Associate Degree | 1,522 (81.4%) | 237 (12.7%) |
| Bachelor's Degree or higher | 1,258 (88.5%) | 23 (1.6%) |
| Total | 4,511 (77.0%) | 351 (6.0%) |
Employment Occupations by Sex in Kingsburg
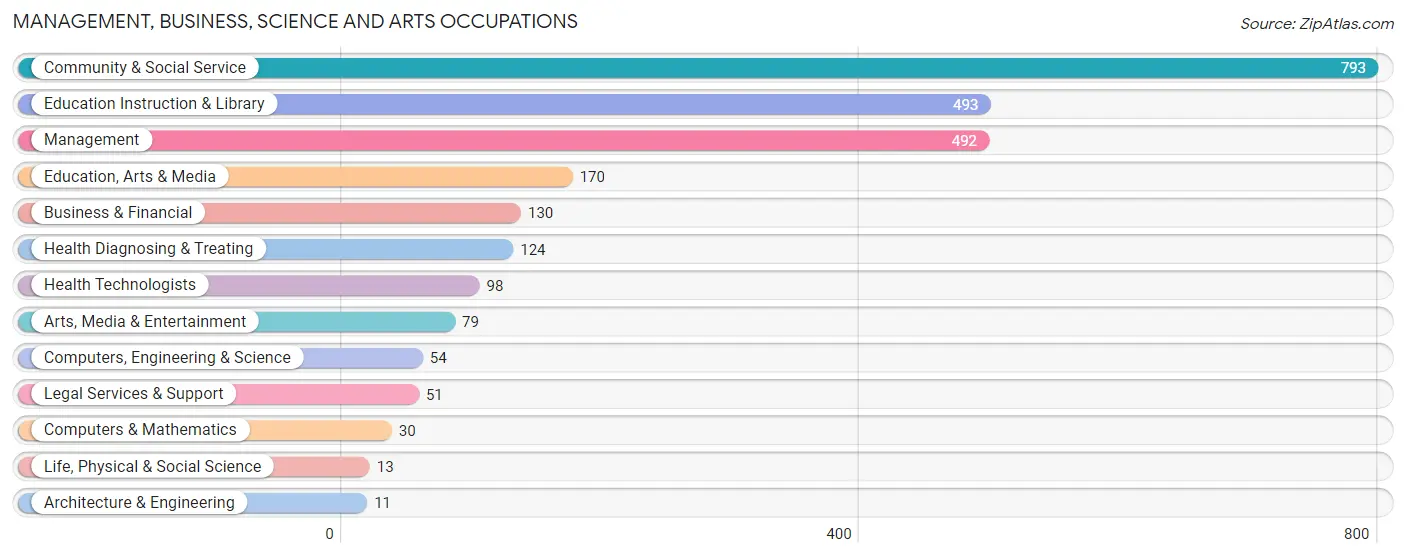
Management, Business, Science and Arts Occupations
The most common Management, Business, Science and Arts occupations in Kingsburg are Community & Social Service (793 | 15.5%), Education Instruction & Library (493 | 9.6%), Management (492 | 9.6%), Education, Arts & Media (170 | 3.3%), and Business & Financial (130 | 2.5%).
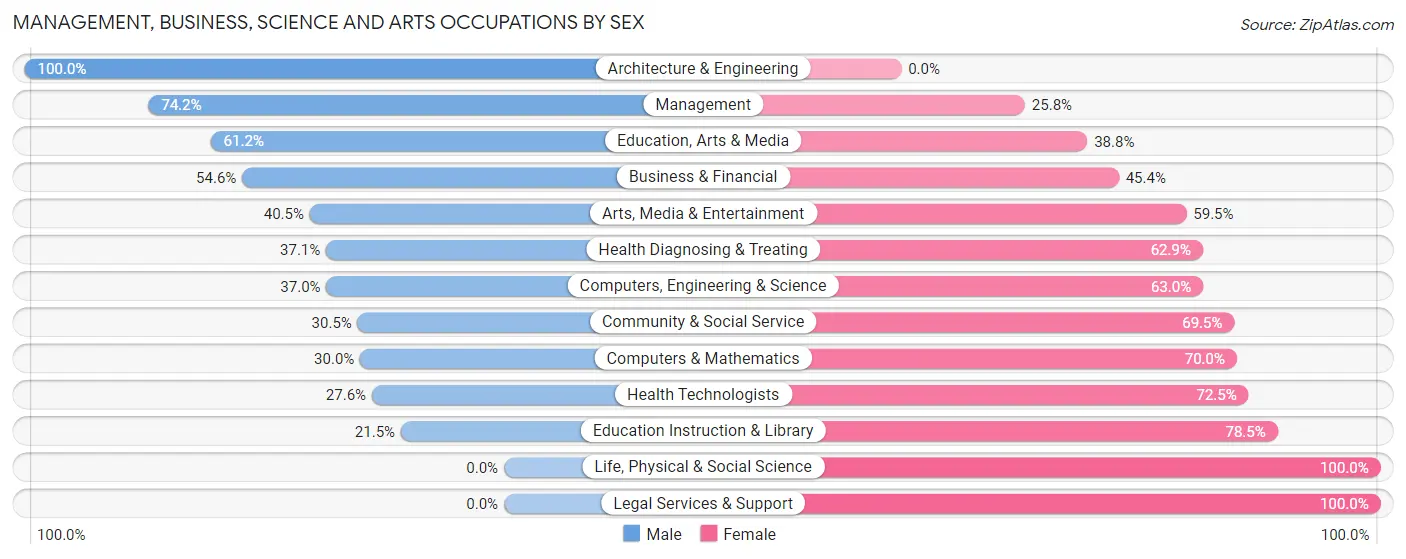
Management, Business, Science and Arts Occupations by Sex
Within the Management, Business, Science and Arts occupations in Kingsburg, the most male-oriented occupations are Architecture & Engineering (100.0%), Management (74.2%), and Education, Arts & Media (61.2%), while the most female-oriented occupations are Life, Physical & Social Science (100.0%), Legal Services & Support (100.0%), and Education Instruction & Library (78.5%).
| Occupation | Male | Female |
| Management | 365 (74.2%) | 127 (25.8%) |
| Business & Financial | 71 (54.6%) | 59 (45.4%) |
| Computers, Engineering & Science | 20 (37.0%) | 34 (63.0%) |
| Computers & Mathematics | 9 (30.0%) | 21 (70.0%) |
| Architecture & Engineering | 11 (100.0%) | 0 (0.0%) |
| Life, Physical & Social Science | 0 (0.0%) | 13 (100.0%) |
| Community & Social Service | 242 (30.5%) | 551 (69.5%) |
| Education, Arts & Media | 104 (61.2%) | 66 (38.8%) |
| Legal Services & Support | 0 (0.0%) | 51 (100.0%) |
| Education Instruction & Library | 106 (21.5%) | 387 (78.5%) |
| Arts, Media & Entertainment | 32 (40.5%) | 47 (59.5%) |
| Health Diagnosing & Treating | 46 (37.1%) | 78 (62.9%) |
| Health Technologists | 27 (27.6%) | 71 (72.5%) |
| Total (Category) | 744 (46.7%) | 849 (53.3%) |
| Total (Overall) | 2,847 (55.5%) | 2,281 (44.5%) |
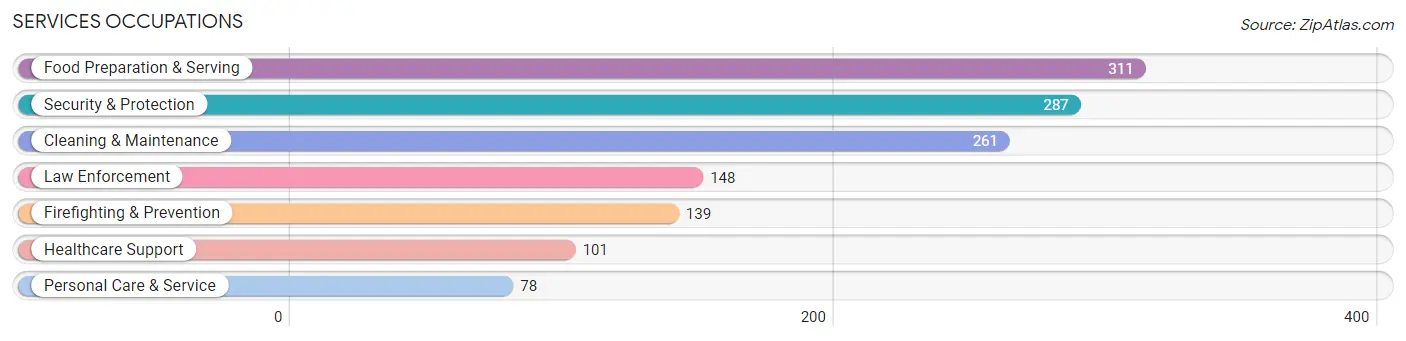
Services Occupations
The most common Services occupations in Kingsburg are Food Preparation & Serving (311 | 6.1%), Security & Protection (287 | 5.6%), Cleaning & Maintenance (261 | 5.1%), Law Enforcement (148 | 2.9%), and Firefighting & Prevention (139 | 2.7%).
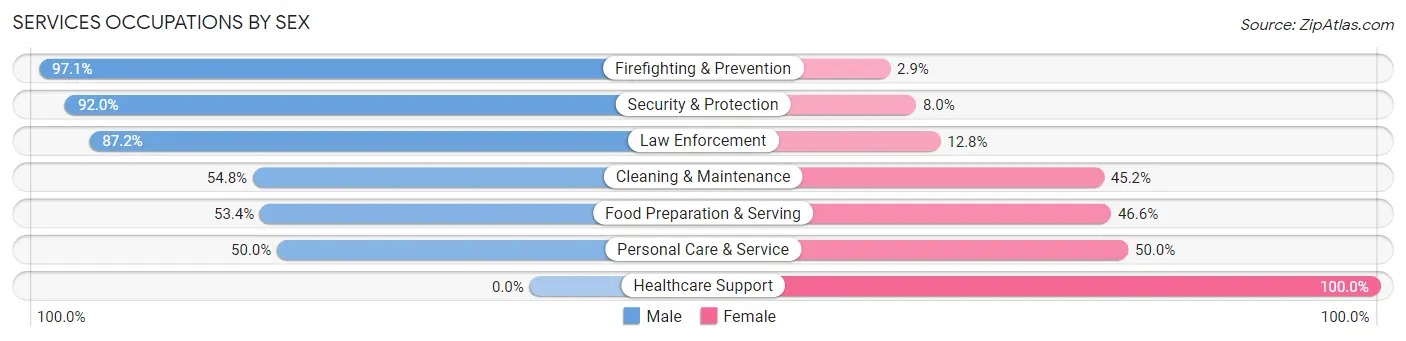
Services Occupations by Sex
Within the Services occupations in Kingsburg, the most male-oriented occupations are Firefighting & Prevention (97.1%), Security & Protection (92.0%), and Law Enforcement (87.2%), while the most female-oriented occupations are Healthcare Support (100.0%), Personal Care & Service (50.0%), and Food Preparation & Serving (46.6%).
| Occupation | Male | Female |
| Healthcare Support | 0 (0.0%) | 101 (100.0%) |
| Security & Protection | 264 (92.0%) | 23 (8.0%) |
| Firefighting & Prevention | 135 (97.1%) | 4 (2.9%) |
| Law Enforcement | 129 (87.2%) | 19 (12.8%) |
| Food Preparation & Serving | 166 (53.4%) | 145 (46.6%) |
| Cleaning & Maintenance | 143 (54.8%) | 118 (45.2%) |
| Personal Care & Service | 39 (50.0%) | 39 (50.0%) |
| Total (Category) | 612 (59.0%) | 426 (41.0%) |
| Total (Overall) | 2,847 (55.5%) | 2,281 (44.5%) |
Sales and Office Occupations
The most common Sales and Office occupations in Kingsburg are Office & Administration (707 | 13.8%), and Sales & Related (543 | 10.6%).
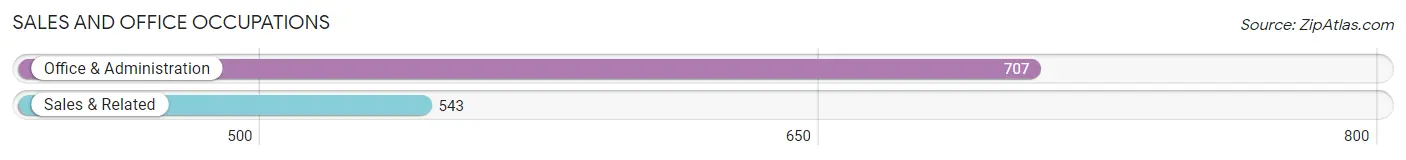
Sales and Office Occupations by Sex
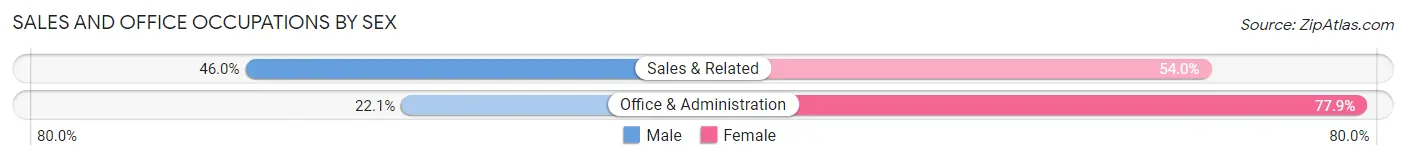
| Occupation | Male | Female |
| Sales & Related | 250 (46.0%) | 293 (54.0%) |
| Office & Administration | 156 (22.1%) | 551 (77.9%) |
| Total (Category) | 406 (32.5%) | 844 (67.5%) |
| Total (Overall) | 2,847 (55.5%) | 2,281 (44.5%) |
Natural Resources, Construction and Maintenance Occupations
The most common Natural Resources, Construction and Maintenance occupations in Kingsburg are Installation, Maintenance & Repair (216 | 4.2%), Construction & Extraction (208 | 4.1%), and Farming, Fishing & Forestry (66 | 1.3%).
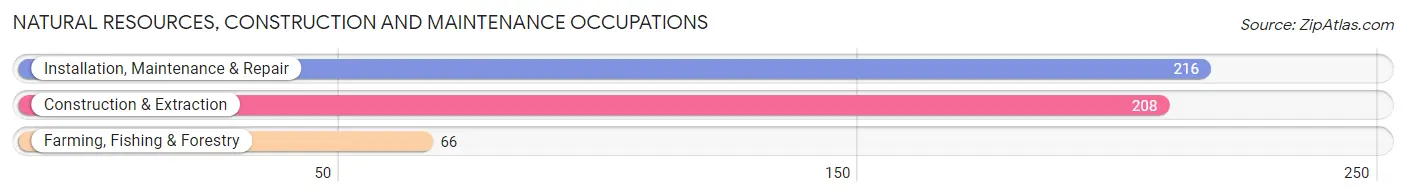
Natural Resources, Construction and Maintenance Occupations by Sex
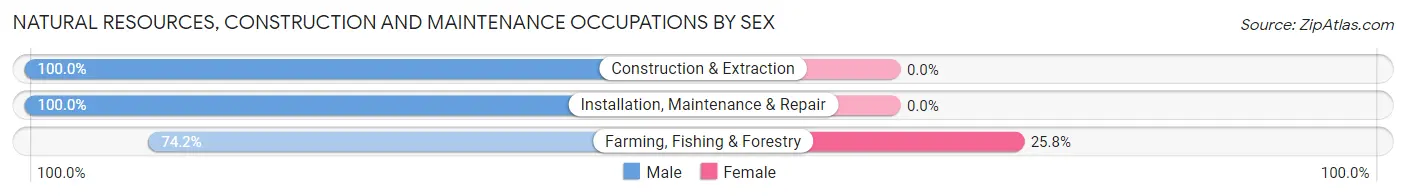
| Occupation | Male | Female |
| Farming, Fishing & Forestry | 49 (74.2%) | 17 (25.8%) |
| Construction & Extraction | 208 (100.0%) | 0 (0.0%) |
| Installation, Maintenance & Repair | 216 (100.0%) | 0 (0.0%) |
| Total (Category) | 473 (96.5%) | 17 (3.5%) |
| Total (Overall) | 2,847 (55.5%) | 2,281 (44.5%) |
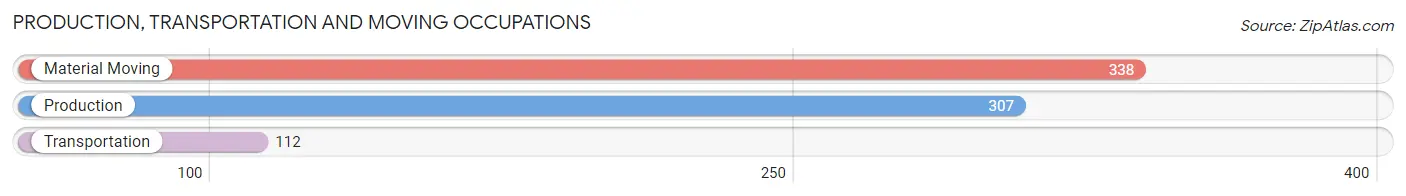
Production, Transportation and Moving Occupations
The most common Production, Transportation and Moving occupations in Kingsburg are Material Moving (338 | 6.6%), Production (307 | 6.0%), and Transportation (112 | 2.2%).
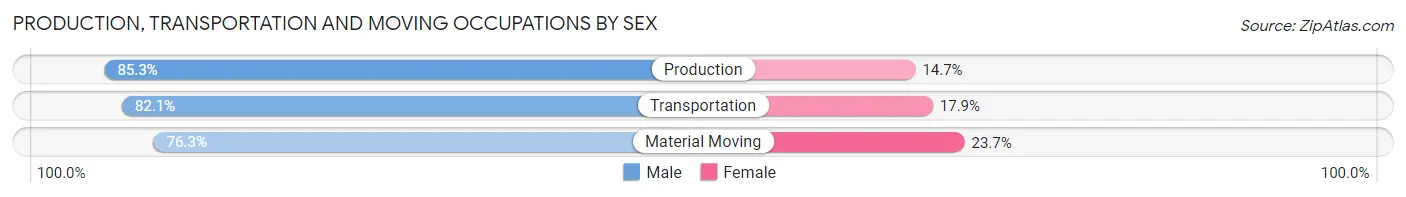
Production, Transportation and Moving Occupations by Sex
| Occupation | Male | Female |
| Production | 262 (85.3%) | 45 (14.7%) |
| Transportation | 92 (82.1%) | 20 (17.9%) |
| Material Moving | 258 (76.3%) | 80 (23.7%) |
| Total (Category) | 612 (80.8%) | 145 (19.2%) |
| Total (Overall) | 2,847 (55.5%) | 2,281 (44.5%) |
Employment Industries by Sex in Kingsburg
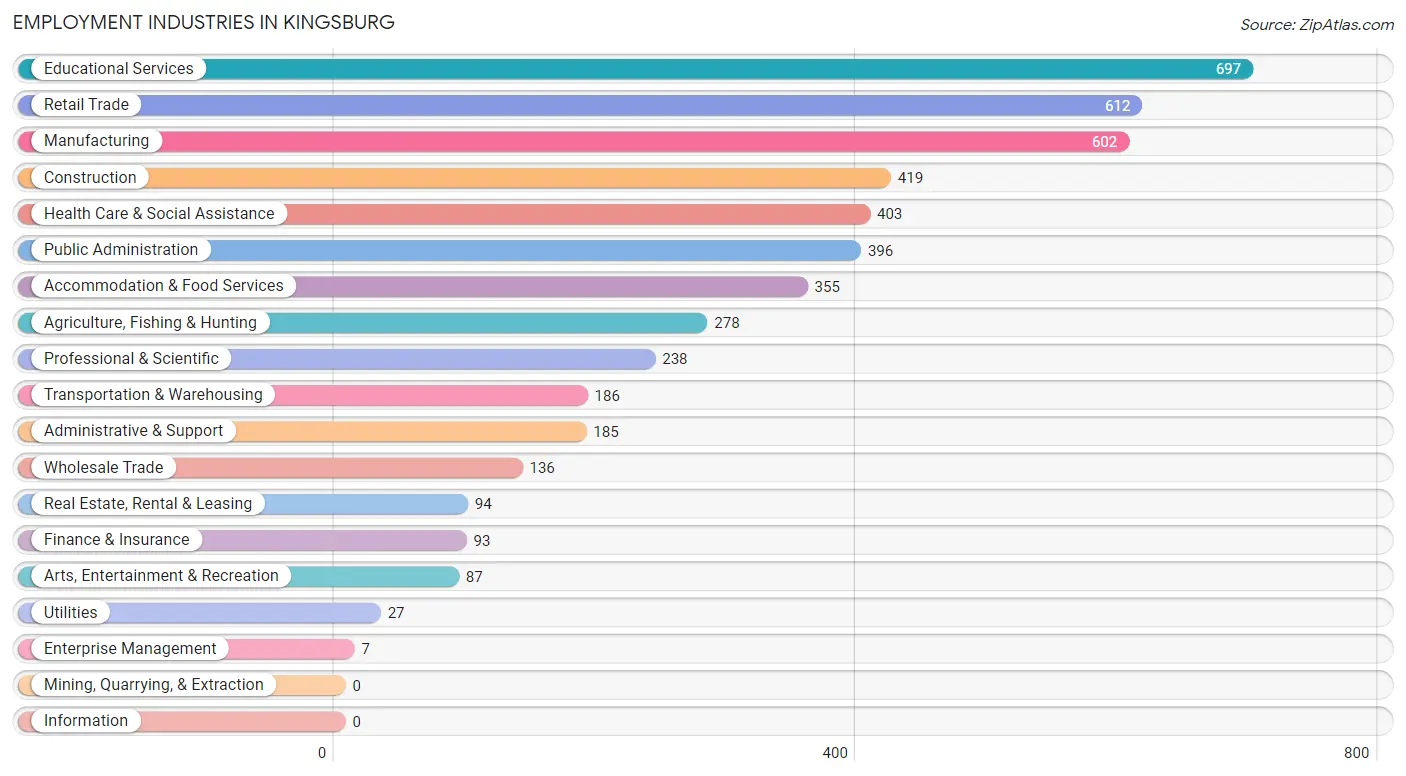
Employment Industries in Kingsburg
The major employment industries in Kingsburg include Educational Services (697 | 13.6%), Retail Trade (612 | 11.9%), Manufacturing (602 | 11.7%), Construction (419 | 8.2%), and Health Care & Social Assistance (403 | 7.9%).
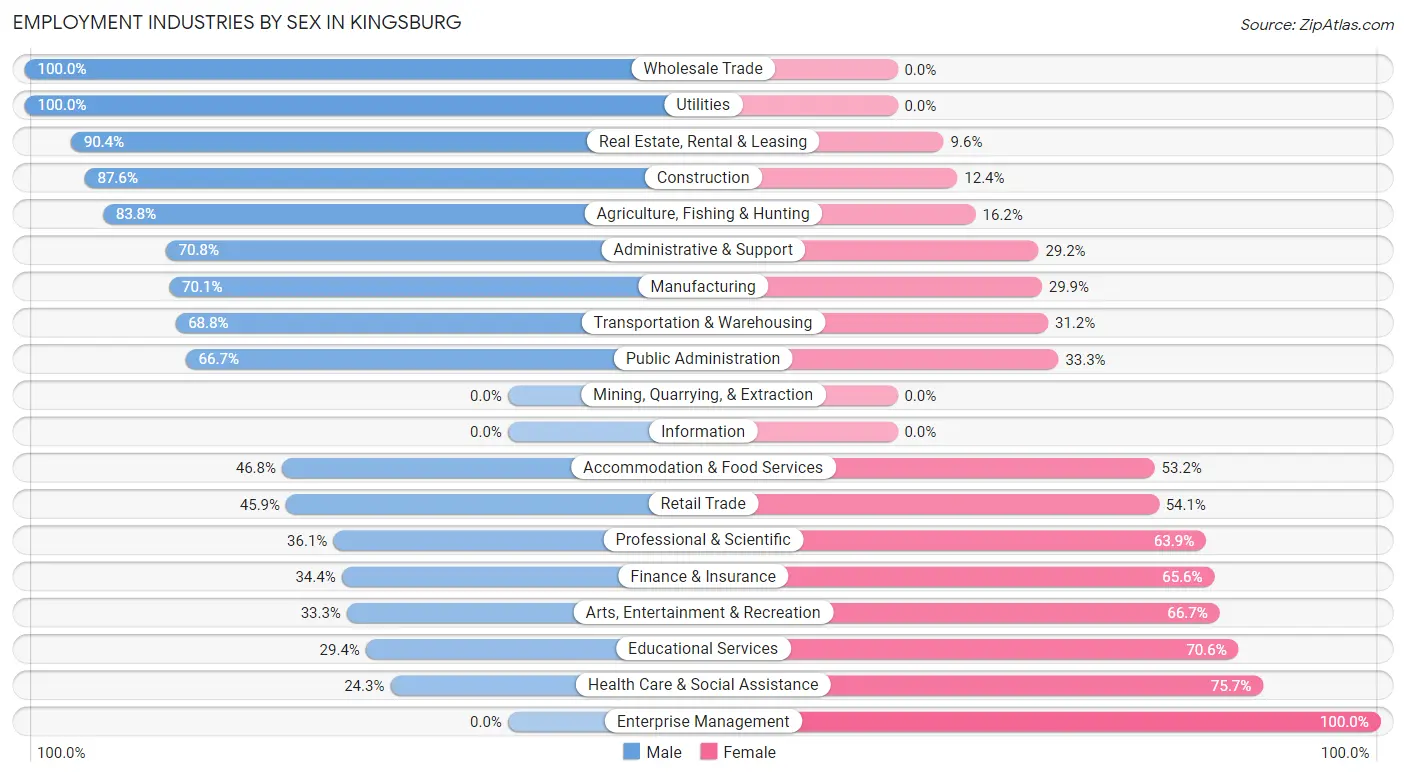
Employment Industries by Sex in Kingsburg
The Kingsburg industries that see more men than women are Wholesale Trade (100.0%), Utilities (100.0%), and Real Estate, Rental & Leasing (90.4%), whereas the industries that tend to have a higher number of women are Enterprise Management (100.0%), Health Care & Social Assistance (75.7%), and Educational Services (70.6%).
| Industry | Male | Female |
| Agriculture, Fishing & Hunting | 233 (83.8%) | 45 (16.2%) |
| Mining, Quarrying, & Extraction | 0 (0.0%) | 0 (0.0%) |
| Construction | 367 (87.6%) | 52 (12.4%) |
| Manufacturing | 422 (70.1%) | 180 (29.9%) |
| Wholesale Trade | 136 (100.0%) | 0 (0.0%) |
| Retail Trade | 281 (45.9%) | 331 (54.1%) |
| Transportation & Warehousing | 128 (68.8%) | 58 (31.2%) |
| Utilities | 27 (100.0%) | 0 (0.0%) |
| Information | 0 (0.0%) | 0 (0.0%) |
| Finance & Insurance | 32 (34.4%) | 61 (65.6%) |
| Real Estate, Rental & Leasing | 85 (90.4%) | 9 (9.6%) |
| Professional & Scientific | 86 (36.1%) | 152 (63.9%) |
| Enterprise Management | 0 (0.0%) | 7 (100.0%) |
| Administrative & Support | 131 (70.8%) | 54 (29.2%) |
| Educational Services | 205 (29.4%) | 492 (70.6%) |
| Health Care & Social Assistance | 98 (24.3%) | 305 (75.7%) |
| Arts, Entertainment & Recreation | 29 (33.3%) | 58 (66.7%) |
| Accommodation & Food Services | 166 (46.8%) | 189 (53.2%) |
| Public Administration | 264 (66.7%) | 132 (33.3%) |
| Total | 2,847 (55.5%) | 2,281 (44.5%) |
Education in Kingsburg
School Enrollment in Kingsburg
The most common levels of schooling among the 3,796 students in Kingsburg are high school (1,049 | 27.6%), elementary school (868 | 22.9%), and middle school (840 | 22.1%).
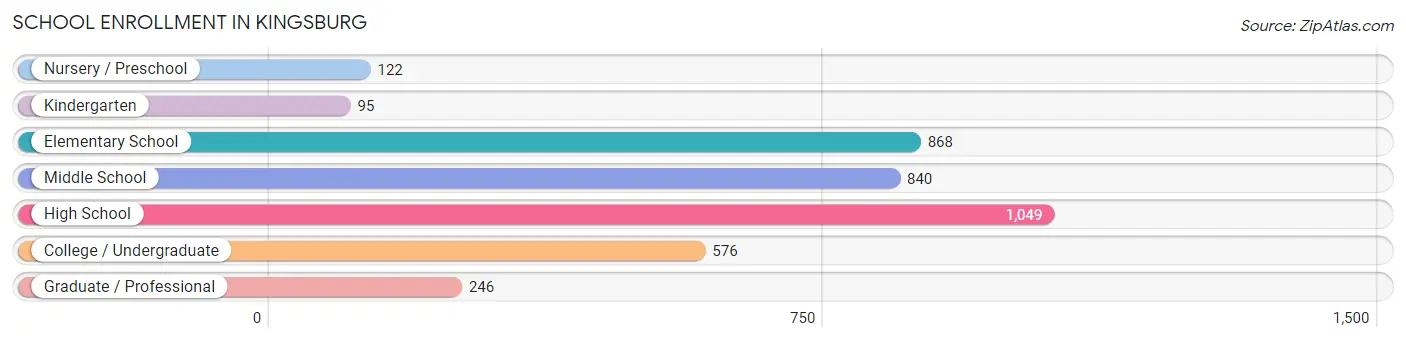
| School Level | # Students | % Students |
| Nursery / Preschool | 122 | 3.2% |
| Kindergarten | 95 | 2.5% |
| Elementary School | 868 | 22.9% |
| Middle School | 840 | 22.1% |
| High School | 1,049 | 27.6% |
| College / Undergraduate | 576 | 15.2% |
| Graduate / Professional | 246 | 6.5% |
| Total | 3,796 | 100.0% |
School Enrollment by Age by Funding Source in Kingsburg
Out of a total of 3,796 students who are enrolled in schools in Kingsburg, 266 (7.0%) attend a private institution, while the remaining 3,530 (93.0%) are enrolled in public schools. The age group of 3 to 4 year olds has the highest likelihood of being enrolled in private schools, with 85 (69.7% in the age bracket) enrolled. Conversely, the age group of 15 to 17 year olds has the lowest likelihood of being enrolled in a private school, with 747 (100.0% in the age bracket) attending a public institution.
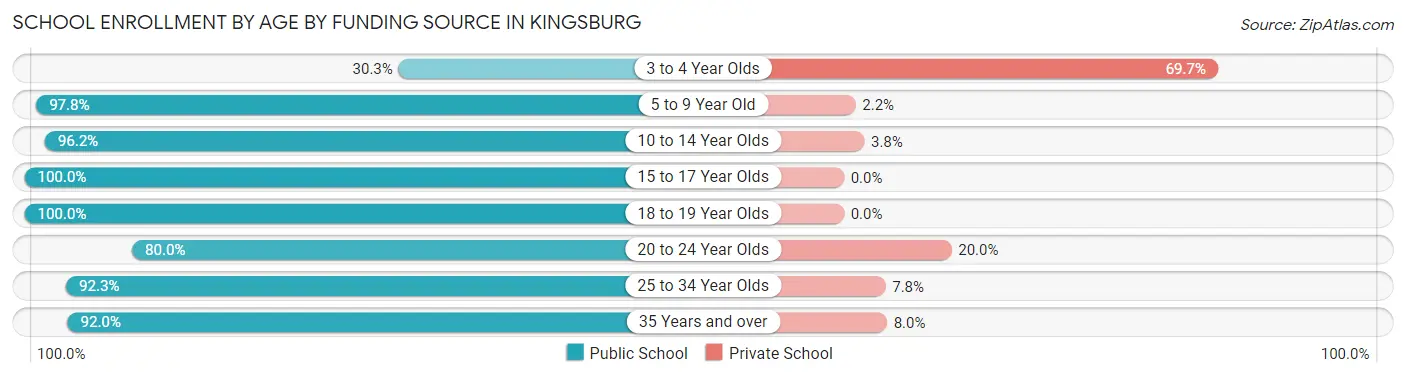
| Age Bracket | Public School | Private School |
| 3 to 4 Year Olds | 37 (30.3%) | 85 (69.7%) |
| 5 to 9 Year Old | 901 (97.8%) | 20 (2.2%) |
| 10 to 14 Year Olds | 913 (96.2%) | 36 (3.8%) |
| 15 to 17 Year Olds | 747 (100.0%) | 0 (0.0%) |
| 18 to 19 Year Olds | 217 (100.0%) | 0 (0.0%) |
| 20 to 24 Year Olds | 379 (80.0%) | 95 (20.0%) |
| 25 to 34 Year Olds | 119 (92.2%) | 10 (7.7%) |
| 35 Years and over | 218 (92.0%) | 19 (8.0%) |
| Total | 3,530 (93.0%) | 266 (7.0%) |
Educational Attainment by Field of Study in Kingsburg
Liberal arts & history (348 | 18.9%), bio, nature & agricultural (192 | 10.4%), education (186 | 10.1%), psychology (174 | 9.5%), and arts & humanities (168 | 9.1%) are the most common fields of study among 1,840 individuals in Kingsburg who have obtained a bachelor's degree or higher.
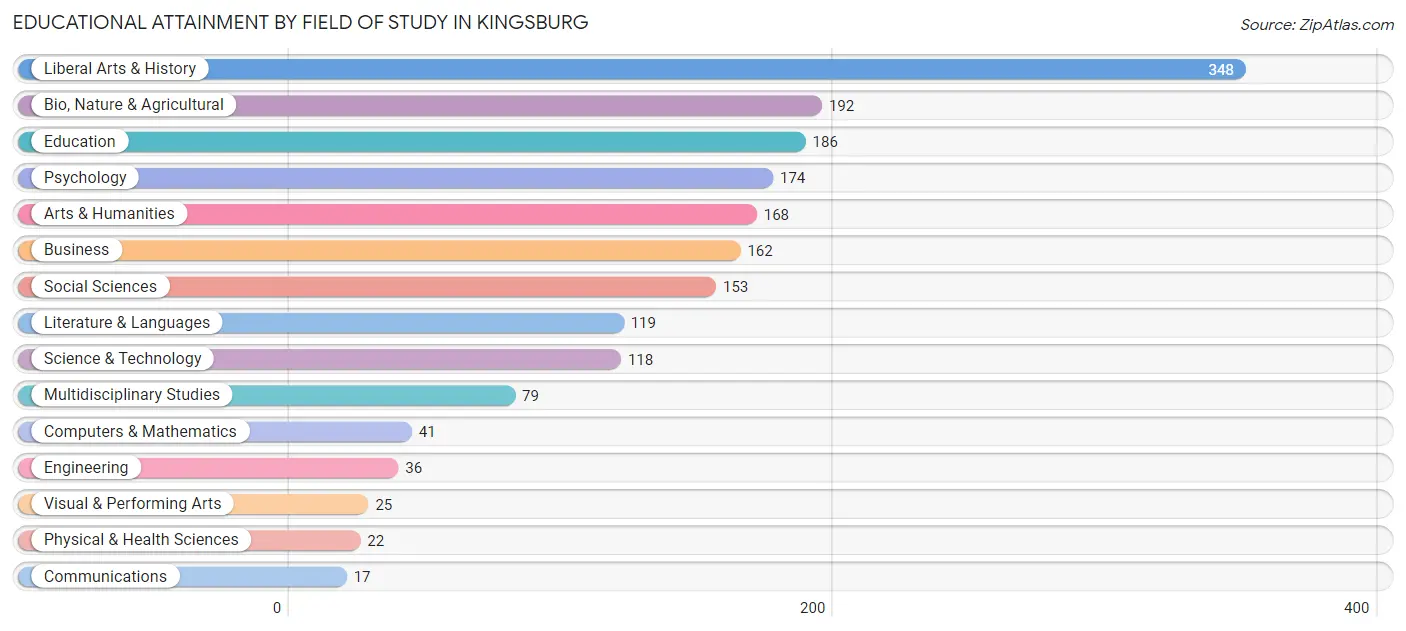
| Field of Study | # Graduates | % Graduates |
| Computers & Mathematics | 41 | 2.2% |
| Bio, Nature & Agricultural | 192 | 10.4% |
| Physical & Health Sciences | 22 | 1.2% |
| Psychology | 174 | 9.5% |
| Social Sciences | 153 | 8.3% |
| Engineering | 36 | 2.0% |
| Multidisciplinary Studies | 79 | 4.3% |
| Science & Technology | 118 | 6.4% |
| Business | 162 | 8.8% |
| Education | 186 | 10.1% |
| Literature & Languages | 119 | 6.5% |
| Liberal Arts & History | 348 | 18.9% |
| Visual & Performing Arts | 25 | 1.4% |
| Communications | 17 | 0.9% |
| Arts & Humanities | 168 | 9.1% |
| Total | 1,840 | 100.0% |
Transportation & Commute in Kingsburg
Vehicle Availability by Sex in Kingsburg
The most prevalent vehicle ownership categories in Kingsburg are males with 2 vehicles (1,118, accounting for 40.7%) and females with 2 vehicles (871, making up 50.8%).
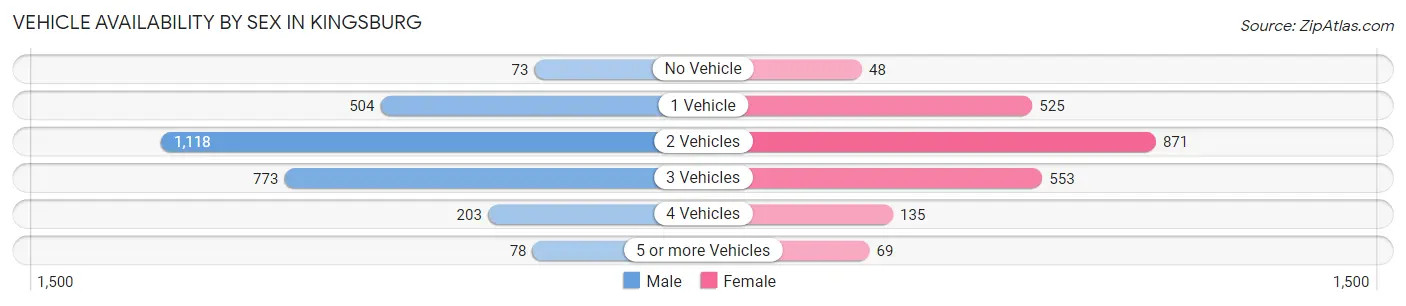
| Vehicles Available | Male | Female |
| No Vehicle | 73 (2.7%) | 48 (2.2%) |
| 1 Vehicle | 504 (18.3%) | 525 (23.8%) |
| 2 Vehicles | 1,118 (40.7%) | 871 (39.6%) |
| 3 Vehicles | 773 (28.1%) | 553 (25.1%) |
| 4 Vehicles | 203 (7.4%) | 135 (6.1%) |
| 5 or more Vehicles | 78 (2.8%) | 69 (3.1%) |
| Total | 2,749 (100.0%) | 2,201 (100.0%) |
Commute Time in Kingsburg
The most frequently occuring commute durations in Kingsburg are 5 to 9 minutes (963 commuters, 20.7%), 30 to 34 minutes (923 commuters, 19.8%), and 20 to 24 minutes (456 commuters, 9.8%).
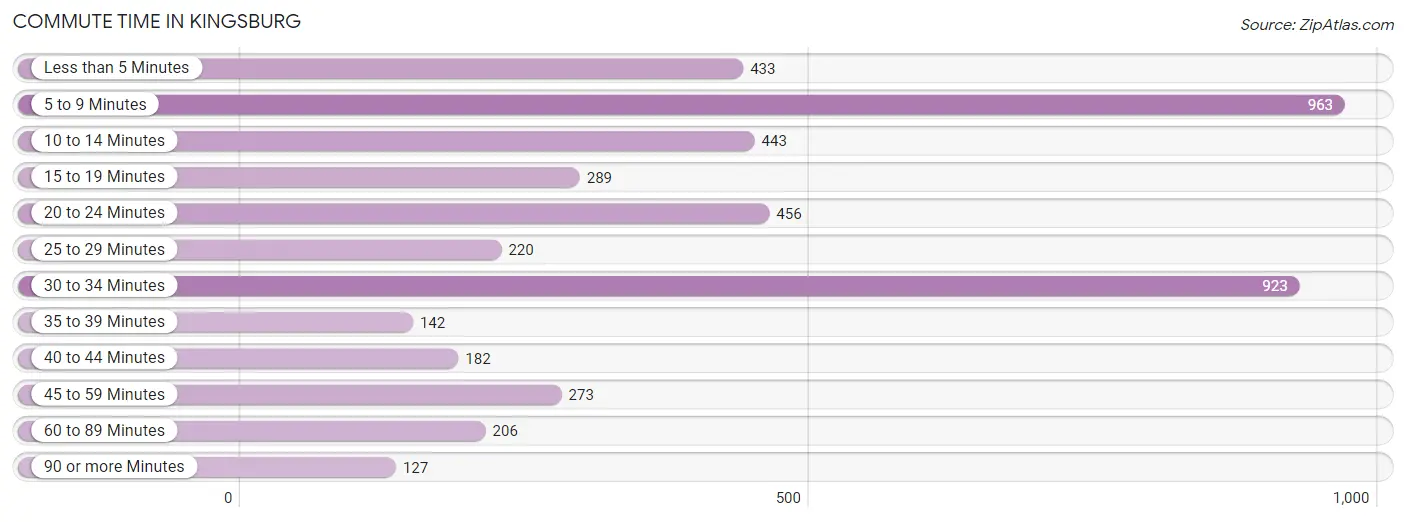
| Commute Time | # Commuters | % Commuters |
| Less than 5 Minutes | 433 | 9.3% |
| 5 to 9 Minutes | 963 | 20.7% |
| 10 to 14 Minutes | 443 | 9.5% |
| 15 to 19 Minutes | 289 | 6.2% |
| 20 to 24 Minutes | 456 | 9.8% |
| 25 to 29 Minutes | 220 | 4.7% |
| 30 to 34 Minutes | 923 | 19.8% |
| 35 to 39 Minutes | 142 | 3.0% |
| 40 to 44 Minutes | 182 | 3.9% |
| 45 to 59 Minutes | 273 | 5.9% |
| 60 to 89 Minutes | 206 | 4.4% |
| 90 or more Minutes | 127 | 2.7% |
Commute Time by Sex in Kingsburg
The most common commute times in Kingsburg are 30 to 34 minutes (625 commuters, 24.0%) for males and 5 to 9 minutes (540 commuters, 26.3%) for females.
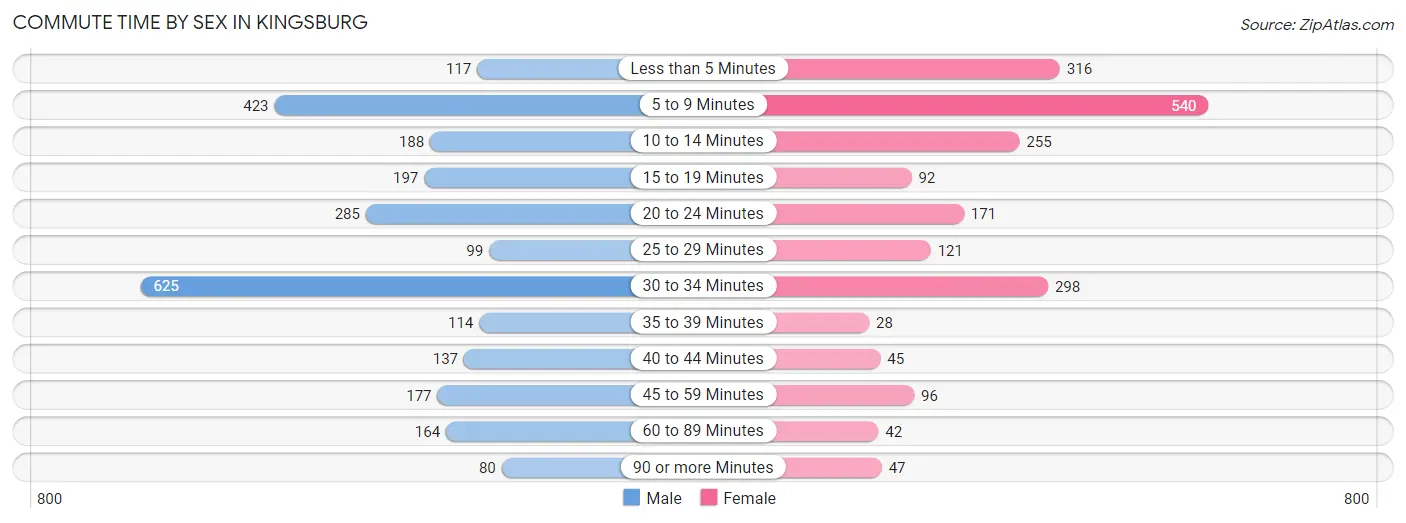
| Commute Time | Male | Female |
| Less than 5 Minutes | 117 (4.5%) | 316 (15.4%) |
| 5 to 9 Minutes | 423 (16.2%) | 540 (26.3%) |
| 10 to 14 Minutes | 188 (7.2%) | 255 (12.4%) |
| 15 to 19 Minutes | 197 (7.6%) | 92 (4.5%) |
| 20 to 24 Minutes | 285 (10.9%) | 171 (8.3%) |
| 25 to 29 Minutes | 99 (3.8%) | 121 (5.9%) |
| 30 to 34 Minutes | 625 (24.0%) | 298 (14.5%) |
| 35 to 39 Minutes | 114 (4.4%) | 28 (1.4%) |
| 40 to 44 Minutes | 137 (5.3%) | 45 (2.2%) |
| 45 to 59 Minutes | 177 (6.8%) | 96 (4.7%) |
| 60 to 89 Minutes | 164 (6.3%) | 42 (2.1%) |
| 90 or more Minutes | 80 (3.1%) | 47 (2.3%) |
Time of Departure to Work by Sex in Kingsburg
The most frequent times of departure to work in Kingsburg are 7:00 AM to 7:29 AM (488, 18.7%) for males and 6:30 AM to 6:59 AM (355, 17.3%) for females.
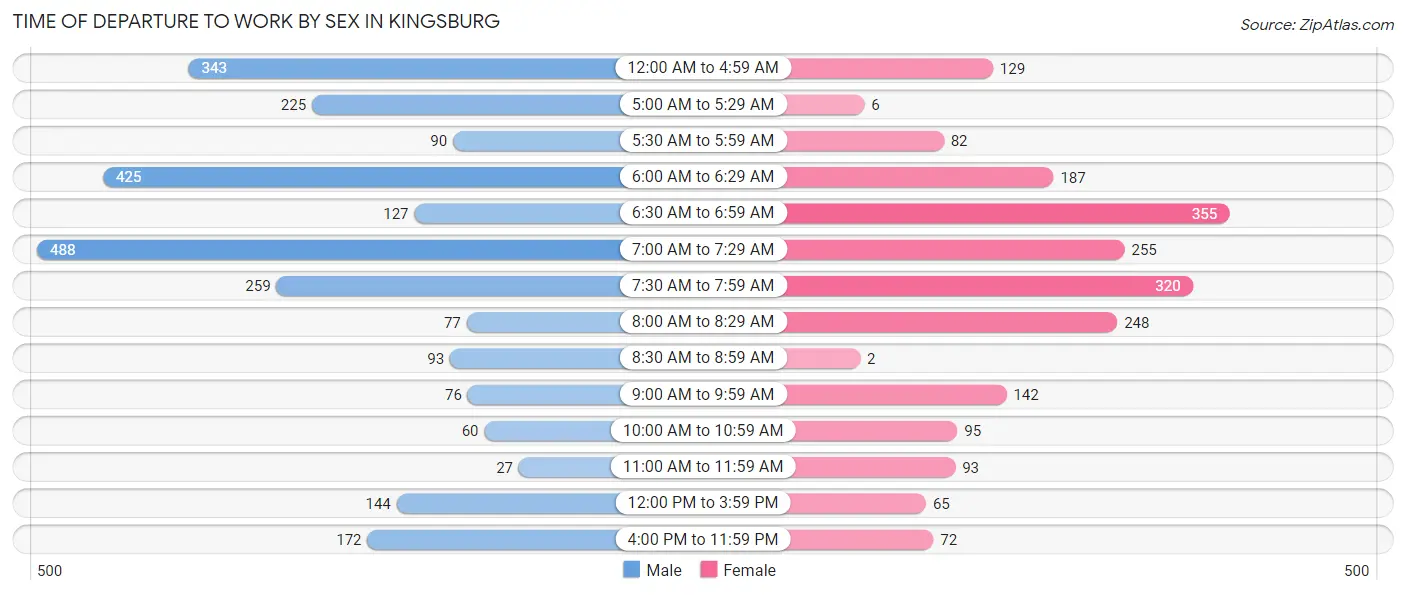
| Time of Departure | Male | Female |
| 12:00 AM to 4:59 AM | 343 (13.2%) | 129 (6.3%) |
| 5:00 AM to 5:29 AM | 225 (8.6%) | 6 (0.3%) |
| 5:30 AM to 5:59 AM | 90 (3.5%) | 82 (4.0%) |
| 6:00 AM to 6:29 AM | 425 (16.3%) | 187 (9.1%) |
| 6:30 AM to 6:59 AM | 127 (4.9%) | 355 (17.3%) |
| 7:00 AM to 7:29 AM | 488 (18.7%) | 255 (12.4%) |
| 7:30 AM to 7:59 AM | 259 (9.9%) | 320 (15.6%) |
| 8:00 AM to 8:29 AM | 77 (2.9%) | 248 (12.1%) |
| 8:30 AM to 8:59 AM | 93 (3.6%) | 2 (0.1%) |
| 9:00 AM to 9:59 AM | 76 (2.9%) | 142 (6.9%) |
| 10:00 AM to 10:59 AM | 60 (2.3%) | 95 (4.6%) |
| 11:00 AM to 11:59 AM | 27 (1.0%) | 93 (4.5%) |
| 12:00 PM to 3:59 PM | 144 (5.5%) | 65 (3.2%) |
| 4:00 PM to 11:59 PM | 172 (6.6%) | 72 (3.5%) |
| Total | 2,606 (100.0%) | 2,051 (100.0%) |
Housing Occupancy in Kingsburg
Occupancy by Ownership in Kingsburg
Of the total 4,260 dwellings in Kingsburg, owner-occupied units account for 3,017 (70.8%), while renter-occupied units make up 1,243 (29.2%).
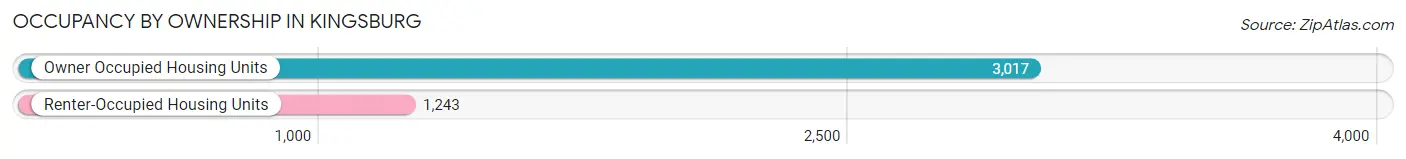
| Occupancy | # Housing Units | % Housing Units |
| Owner Occupied Housing Units | 3,017 | 70.8% |
| Renter-Occupied Housing Units | 1,243 | 29.2% |
| Total Occupied Housing Units | 4,260 | 100.0% |
Occupancy by Household Size in Kingsburg
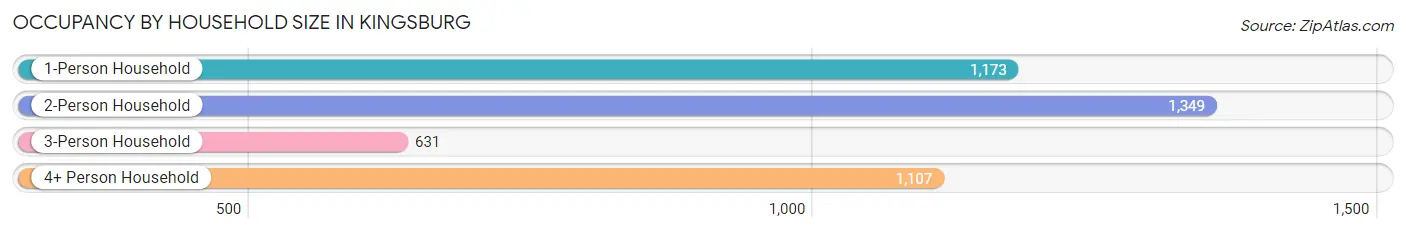
| Household Size | # Housing Units | % Housing Units |
| 1-Person Household | 1,173 | 27.5% |
| 2-Person Household | 1,349 | 31.7% |
| 3-Person Household | 631 | 14.8% |
| 4+ Person Household | 1,107 | 26.0% |
| Total Housing Units | 4,260 | 100.0% |
Occupancy by Ownership by Household Size in Kingsburg
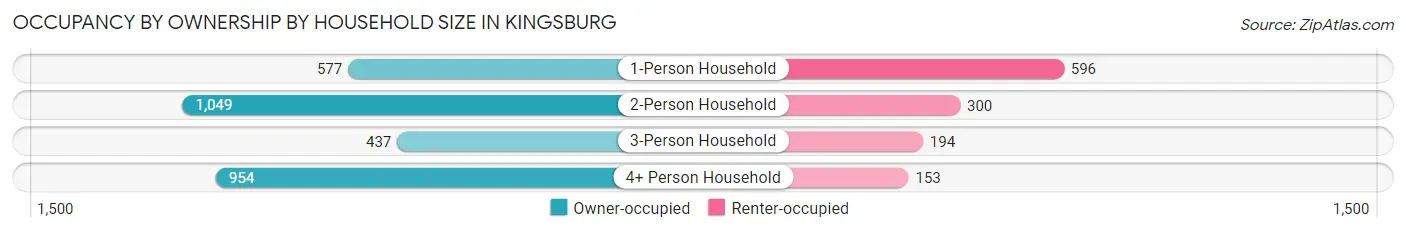
| Household Size | Owner-occupied | Renter-occupied |
| 1-Person Household | 577 (49.2%) | 596 (50.8%) |
| 2-Person Household | 1,049 (77.8%) | 300 (22.2%) |
| 3-Person Household | 437 (69.3%) | 194 (30.7%) |
| 4+ Person Household | 954 (86.2%) | 153 (13.8%) |
| Total Housing Units | 3,017 (70.8%) | 1,243 (29.2%) |
Occupancy by Educational Attainment in Kingsburg
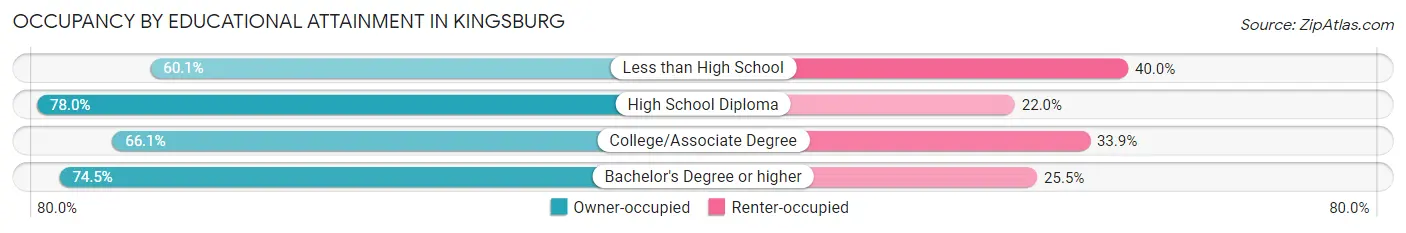
| Household Size | Owner-occupied | Renter-occupied |
| Less than High School | 221 (60.1%) | 147 (40.0%) |
| High School Diploma | 819 (78.0%) | 231 (22.0%) |
| College/Associate Degree | 1,099 (66.1%) | 564 (33.9%) |
| Bachelor's Degree or higher | 878 (74.5%) | 301 (25.5%) |
Occupancy by Age of Householder in Kingsburg
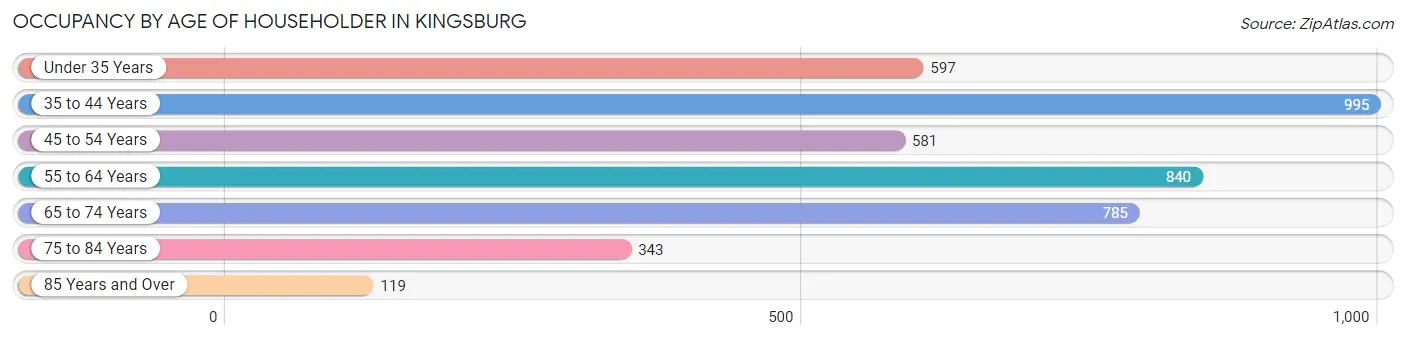
| Age Bracket | # Households | % Households |
| Under 35 Years | 597 | 14.0% |
| 35 to 44 Years | 995 | 23.4% |
| 45 to 54 Years | 581 | 13.6% |
| 55 to 64 Years | 840 | 19.7% |
| 65 to 74 Years | 785 | 18.4% |
| 75 to 84 Years | 343 | 8.1% |
| 85 Years and Over | 119 | 2.8% |
| Total | 4,260 | 100.0% |
Housing Finances in Kingsburg
Median Income by Occupancy in Kingsburg
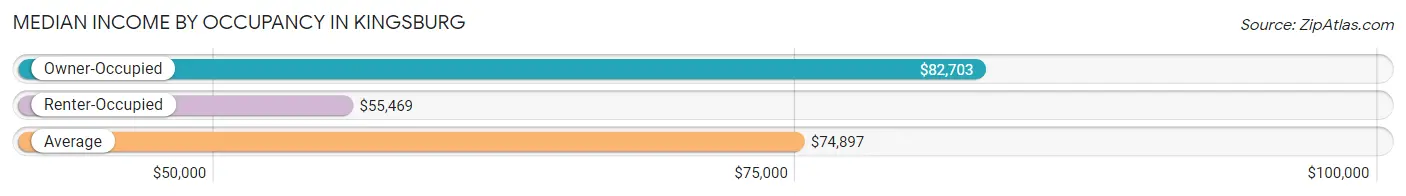
| Occupancy Type | # Households | Median Income |
| Owner-Occupied | 3,017 (70.8%) | $82,703 |
| Renter-Occupied | 1,243 (29.2%) | $55,469 |
| Average | 4,260 (100.0%) | $74,897 |
Occupancy by Householder Income Bracket in Kingsburg
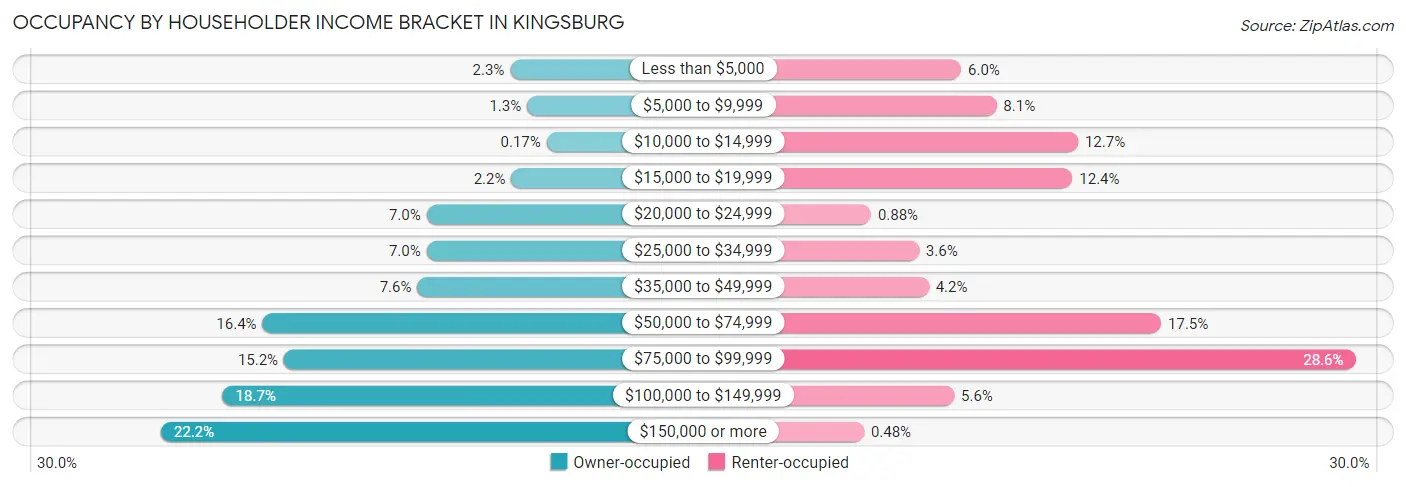
| Income Bracket | Owner-occupied | Renter-occupied |
| Less than $5,000 | 68 (2.2%) | 75 (6.0%) |
| $5,000 to $9,999 | 39 (1.3%) | 100 (8.1%) |
| $10,000 to $14,999 | 5 (0.2%) | 158 (12.7%) |
| $15,000 to $19,999 | 66 (2.2%) | 154 (12.4%) |
| $20,000 to $24,999 | 212 (7.0%) | 11 (0.9%) |
| $25,000 to $34,999 | 212 (7.0%) | 45 (3.6%) |
| $35,000 to $49,999 | 228 (7.6%) | 52 (4.2%) |
| $50,000 to $74,999 | 495 (16.4%) | 217 (17.5%) |
| $75,000 to $99,999 | 458 (15.2%) | 355 (28.6%) |
| $100,000 to $149,999 | 564 (18.7%) | 70 (5.6%) |
| $150,000 or more | 670 (22.2%) | 6 (0.5%) |
| Total | 3,017 (100.0%) | 1,243 (100.0%) |
Monthly Housing Cost Tiers in Kingsburg
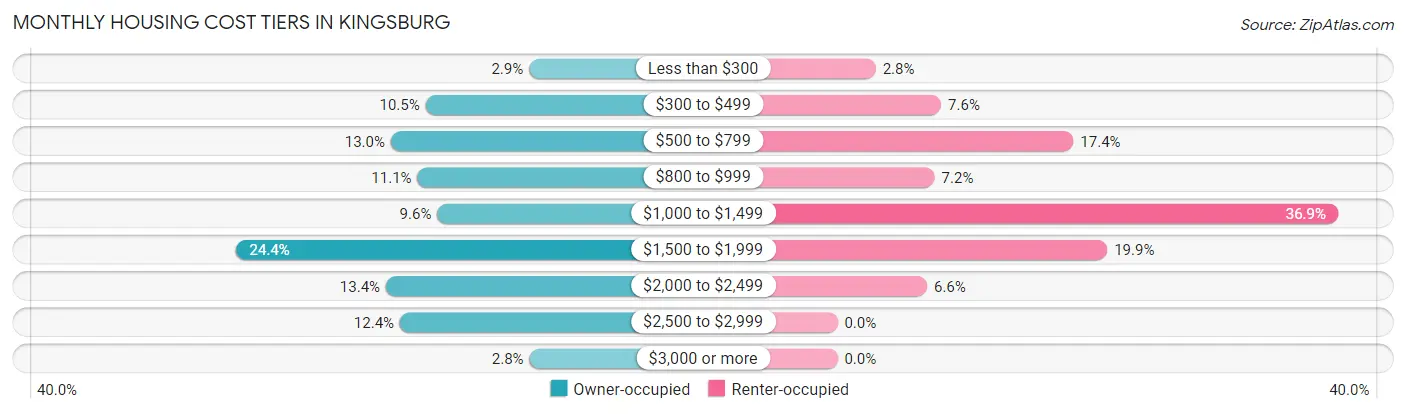
| Monthly Cost | Owner-occupied | Renter-occupied |
| Less than $300 | 86 (2.9%) | 35 (2.8%) |
| $300 to $499 | 316 (10.5%) | 95 (7.6%) |
| $500 to $799 | 393 (13.0%) | 216 (17.4%) |
| $800 to $999 | 334 (11.1%) | 89 (7.2%) |
| $1,000 to $1,499 | 290 (9.6%) | 458 (36.8%) |
| $1,500 to $1,999 | 736 (24.4%) | 247 (19.9%) |
| $2,000 to $2,499 | 404 (13.4%) | 82 (6.6%) |
| $2,500 to $2,999 | 373 (12.4%) | 0 (0.0%) |
| $3,000 or more | 85 (2.8%) | 0 (0.0%) |
| Total | 3,017 (100.0%) | 1,243 (100.0%) |
Physical Housing Characteristics in Kingsburg
Housing Structures in Kingsburg
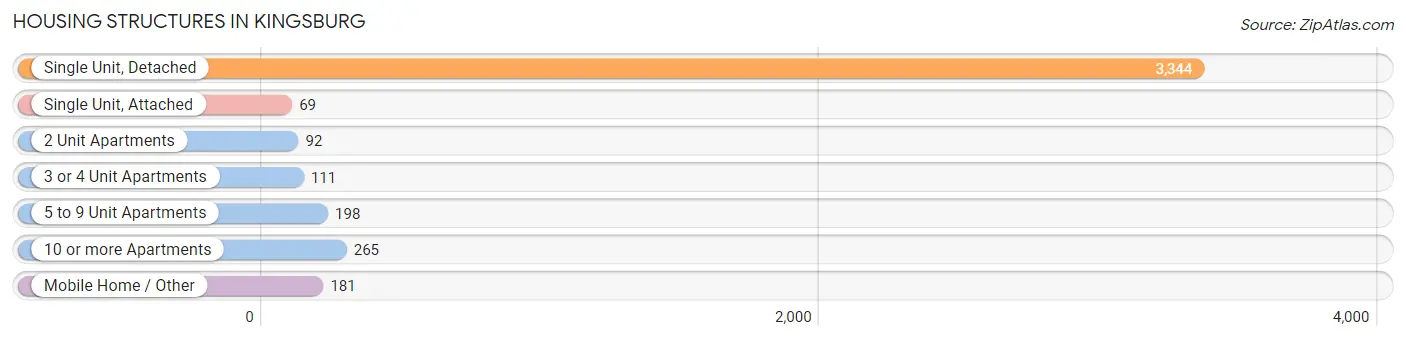
| Structure Type | # Housing Units | % Housing Units |
| Single Unit, Detached | 3,344 | 78.5% |
| Single Unit, Attached | 69 | 1.6% |
| 2 Unit Apartments | 92 | 2.2% |
| 3 or 4 Unit Apartments | 111 | 2.6% |
| 5 to 9 Unit Apartments | 198 | 4.6% |
| 10 or more Apartments | 265 | 6.2% |
| Mobile Home / Other | 181 | 4.3% |
| Total | 4,260 | 100.0% |
Housing Structures by Occupancy in Kingsburg
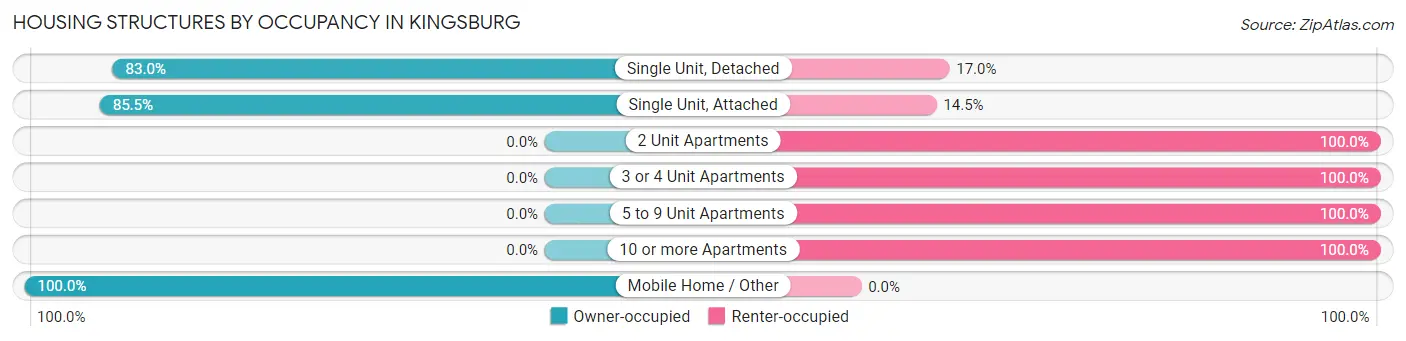
| Structure Type | Owner-occupied | Renter-occupied |
| Single Unit, Detached | 2,777 (83.0%) | 567 (17.0%) |
| Single Unit, Attached | 59 (85.5%) | 10 (14.5%) |
| 2 Unit Apartments | 0 (0.0%) | 92 (100.0%) |
| 3 or 4 Unit Apartments | 0 (0.0%) | 111 (100.0%) |
| 5 to 9 Unit Apartments | 0 (0.0%) | 198 (100.0%) |
| 10 or more Apartments | 0 (0.0%) | 265 (100.0%) |
| Mobile Home / Other | 181 (100.0%) | 0 (0.0%) |
| Total | 3,017 (70.8%) | 1,243 (29.2%) |
Housing Structures by Number of Rooms in Kingsburg
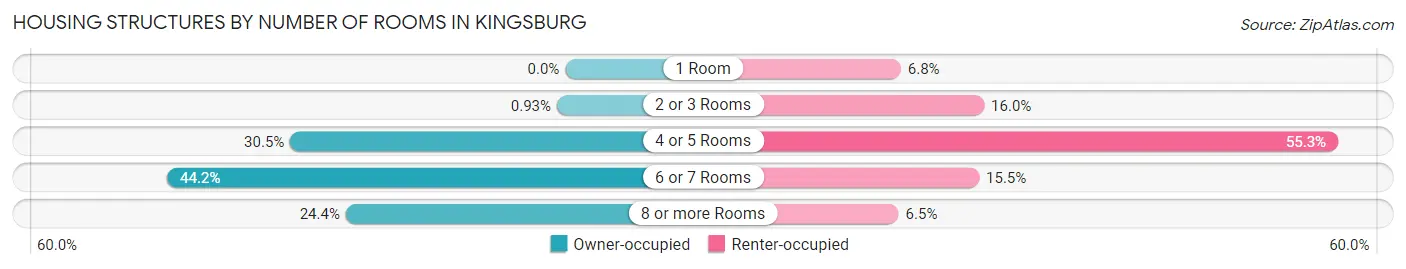
| Number of Rooms | Owner-occupied | Renter-occupied |
| 1 Room | 0 (0.0%) | 84 (6.8%) |
| 2 or 3 Rooms | 28 (0.9%) | 199 (16.0%) |
| 4 or 5 Rooms | 921 (30.5%) | 687 (55.3%) |
| 6 or 7 Rooms | 1,333 (44.2%) | 192 (15.4%) |
| 8 or more Rooms | 735 (24.4%) | 81 (6.5%) |
| Total | 3,017 (100.0%) | 1,243 (100.0%) |
Housing Structure by Heating Type in Kingsburg
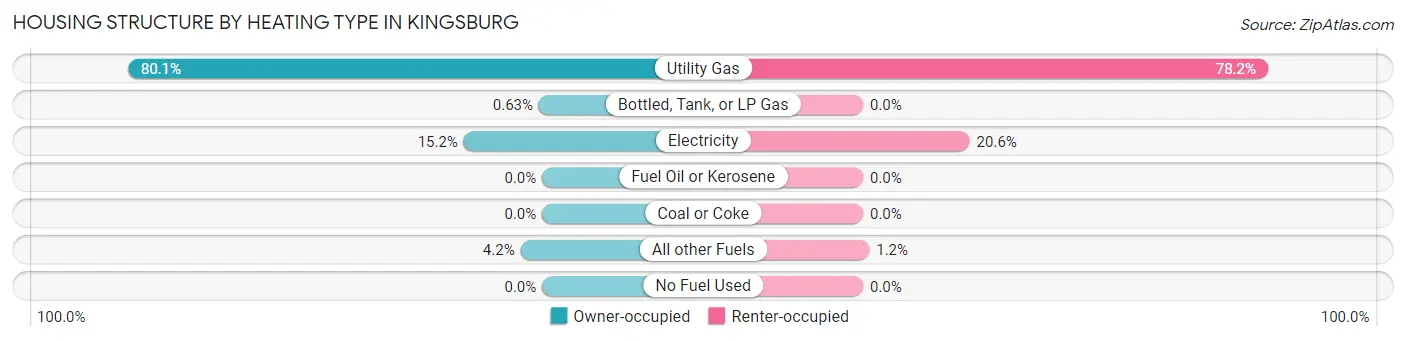
| Heating Type | Owner-occupied | Renter-occupied |
| Utility Gas | 2,415 (80.0%) | 972 (78.2%) |
| Bottled, Tank, or LP Gas | 19 (0.6%) | 0 (0.0%) |
| Electricity | 457 (15.1%) | 256 (20.6%) |
| Fuel Oil or Kerosene | 0 (0.0%) | 0 (0.0%) |
| Coal or Coke | 0 (0.0%) | 0 (0.0%) |
| All other Fuels | 126 (4.2%) | 15 (1.2%) |
| No Fuel Used | 0 (0.0%) | 0 (0.0%) |
| Total | 3,017 (100.0%) | 1,243 (100.0%) |
Household Vehicle Usage in Kingsburg
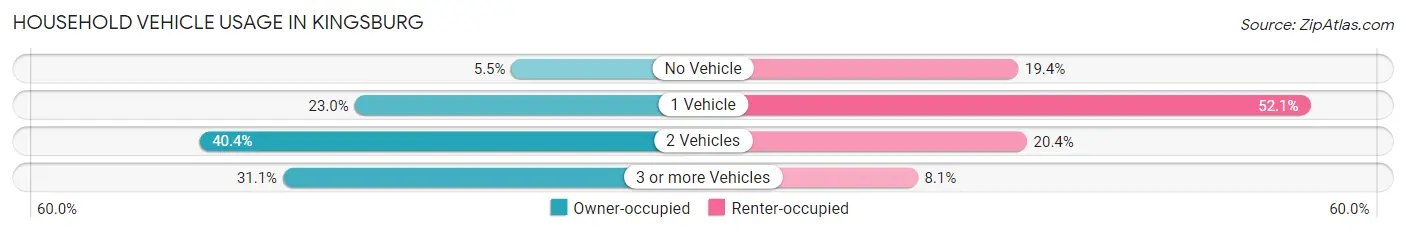
| Vehicles per Household | Owner-occupied | Renter-occupied |
| No Vehicle | 165 (5.5%) | 241 (19.4%) |
| 1 Vehicle | 695 (23.0%) | 648 (52.1%) |
| 2 Vehicles | 1,220 (40.4%) | 253 (20.3%) |
| 3 or more Vehicles | 937 (31.1%) | 101 (8.1%) |
| Total | 3,017 (100.0%) | 1,243 (100.0%) |
Real Estate & Mortgages in Kingsburg
Real Estate and Mortgage Overview in Kingsburg
| Characteristic | Without Mortgage | With Mortgage |
| Housing Units | 1,081 | 1,936 |
| Median Property Value | $338,300 | $333,700 |
| Median Household Income | $53,884 | $568 |
| Monthly Housing Costs | $622 | $85 |
| Real Estate Taxes | $2,547 | $0 |
Property Value by Mortgage Status in Kingsburg
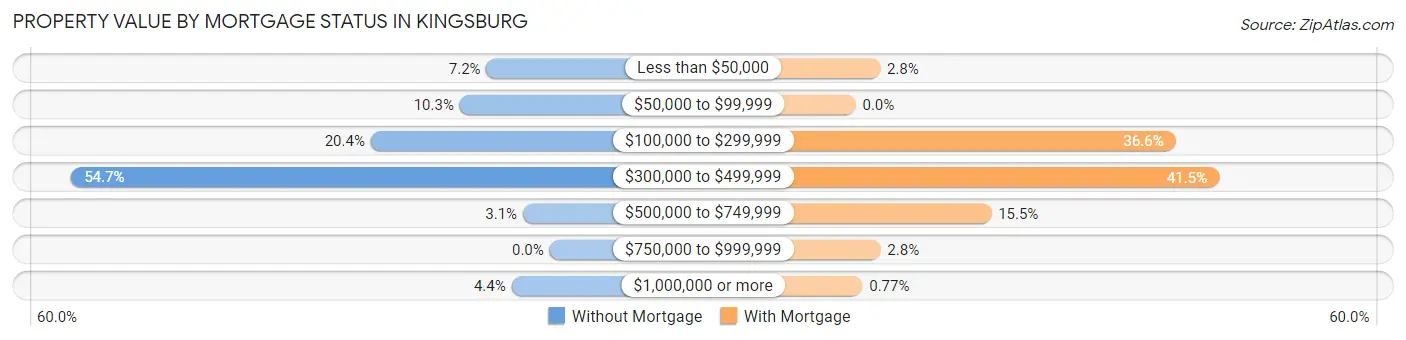
| Property Value | Without Mortgage | With Mortgage |
| Less than $50,000 | 78 (7.2%) | 54 (2.8%) |
| $50,000 to $99,999 | 111 (10.3%) | 0 (0.0%) |
| $100,000 to $299,999 | 221 (20.4%) | 708 (36.6%) |
| $300,000 to $499,999 | 591 (54.7%) | 804 (41.5%) |
| $500,000 to $749,999 | 33 (3.0%) | 300 (15.5%) |
| $750,000 to $999,999 | 0 (0.0%) | 55 (2.8%) |
| $1,000,000 or more | 47 (4.3%) | 15 (0.8%) |
| Total | 1,081 (100.0%) | 1,936 (100.0%) |
Household Income by Mortgage Status in Kingsburg
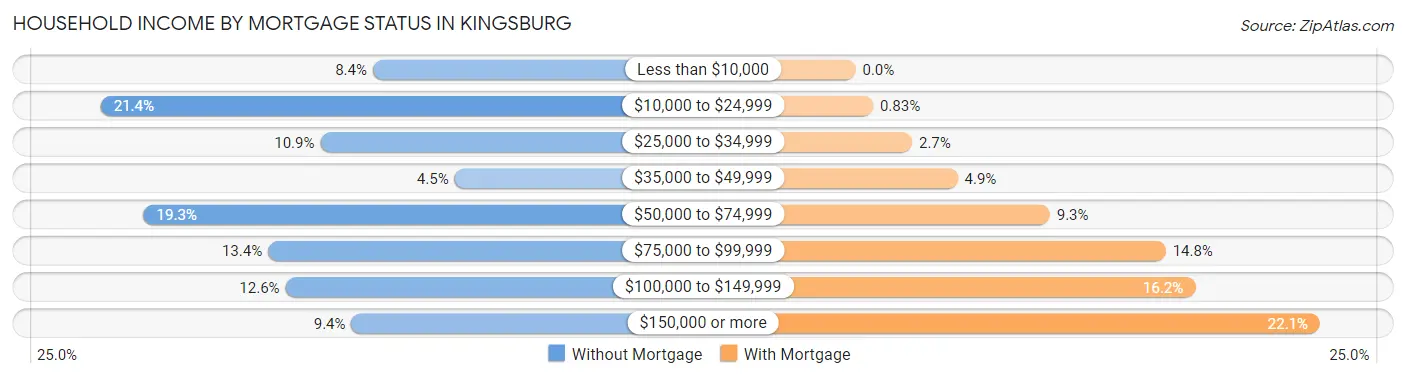
| Household Income | Without Mortgage | With Mortgage |
| Less than $10,000 | 91 (8.4%) | 0 (0.0%) |
| $10,000 to $24,999 | 231 (21.4%) | 16 (0.8%) |
| $25,000 to $34,999 | 118 (10.9%) | 52 (2.7%) |
| $35,000 to $49,999 | 49 (4.5%) | 94 (4.9%) |
| $50,000 to $74,999 | 209 (19.3%) | 179 (9.2%) |
| $75,000 to $99,999 | 145 (13.4%) | 286 (14.8%) |
| $100,000 to $149,999 | 136 (12.6%) | 313 (16.2%) |
| $150,000 or more | 102 (9.4%) | 428 (22.1%) |
| Total | 1,081 (100.0%) | 1,936 (100.0%) |
Property Value to Household Income Ratio in Kingsburg
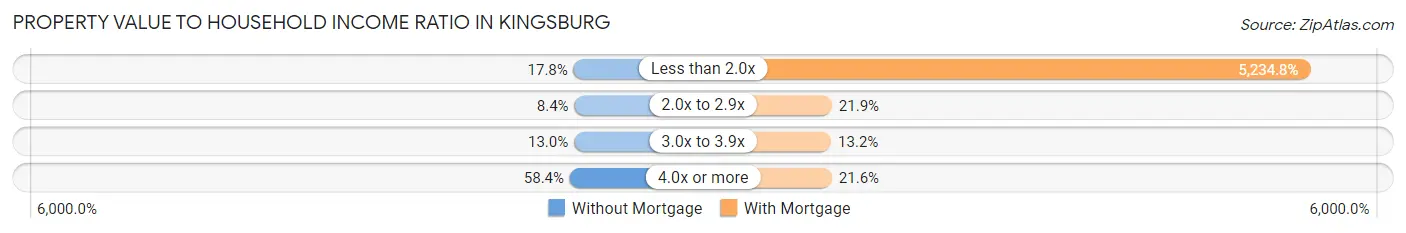
| Value-to-Income Ratio | Without Mortgage | With Mortgage |
| Less than 2.0x | 192 (17.8%) | 101,346 (5,234.8%) |
| 2.0x to 2.9x | 91 (8.4%) | 423 (21.8%) |
| 3.0x to 3.9x | 140 (13.0%) | 256 (13.2%) |
| 4.0x or more | 631 (58.4%) | 419 (21.6%) |
| Total | 1,081 (100.0%) | 1,936 (100.0%) |
Real Estate Taxes by Mortgage Status in Kingsburg
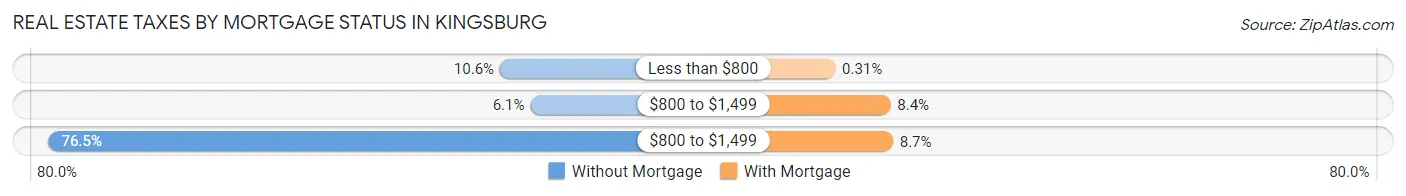
| Property Taxes | Without Mortgage | With Mortgage |
| Less than $800 | 114 (10.5%) | 6 (0.3%) |
| $800 to $1,499 | 66 (6.1%) | 162 (8.4%) |
| $800 to $1,499 | 827 (76.5%) | 169 (8.7%) |
| Total | 1,081 (100.0%) | 1,936 (100.0%) |
Health & Disability in Kingsburg
Health Insurance Coverage by Age in Kingsburg
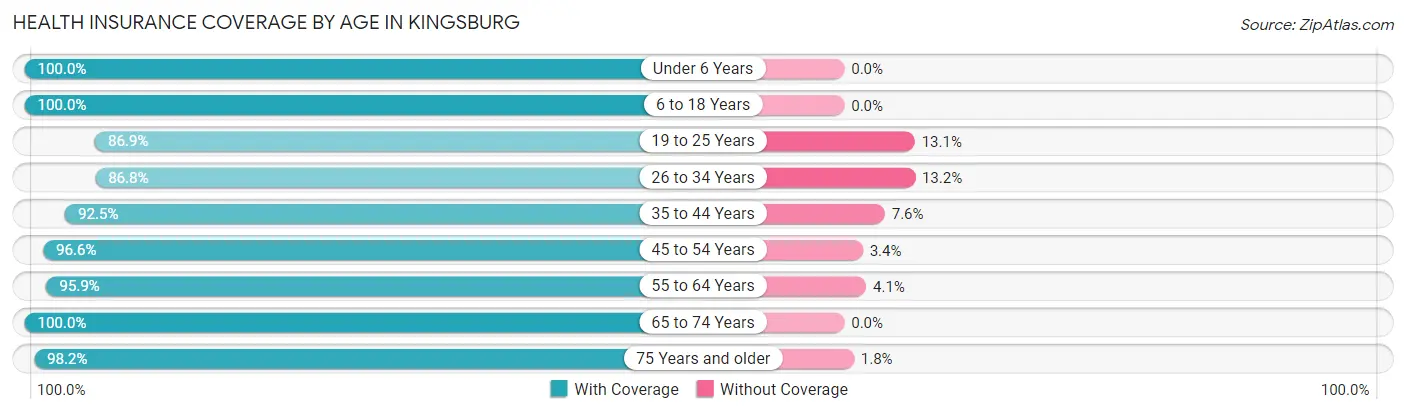
| Age Bracket | With Coverage | Without Coverage |
| Under 6 Years | 656 (100.0%) | 0 (0.0%) |
| 6 to 18 Years | 2,806 (100.0%) | 0 (0.0%) |
| 19 to 25 Years | 906 (86.9%) | 137 (13.1%) |
| 26 to 34 Years | 1,067 (86.8%) | 162 (13.2%) |
| 35 to 44 Years | 1,960 (92.4%) | 160 (7.5%) |
| 45 to 54 Years | 1,096 (96.6%) | 39 (3.4%) |
| 55 to 64 Years | 1,273 (95.9%) | 54 (4.1%) |
| 65 to 74 Years | 1,238 (100.0%) | 0 (0.0%) |
| 75 Years and older | 830 (98.2%) | 15 (1.8%) |
| Total | 11,832 (95.4%) | 567 (4.6%) |
Health Insurance Coverage by Citizenship Status in Kingsburg
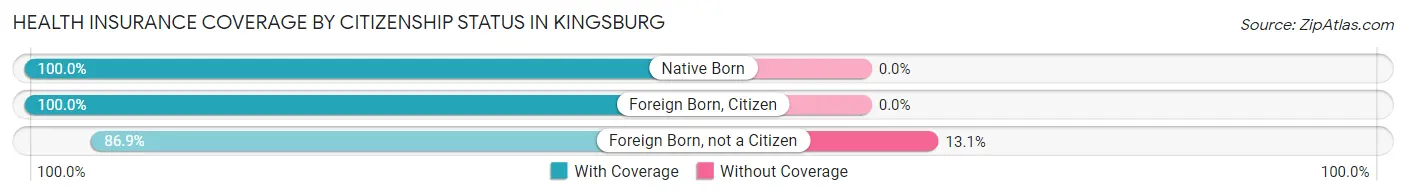
| Citizenship Status | With Coverage | Without Coverage |
| Native Born | 656 (100.0%) | 0 (0.0%) |
| Foreign Born, Citizen | 2,806 (100.0%) | 0 (0.0%) |
| Foreign Born, not a Citizen | 906 (86.9%) | 137 (13.1%) |
Health Insurance Coverage by Household Income in Kingsburg
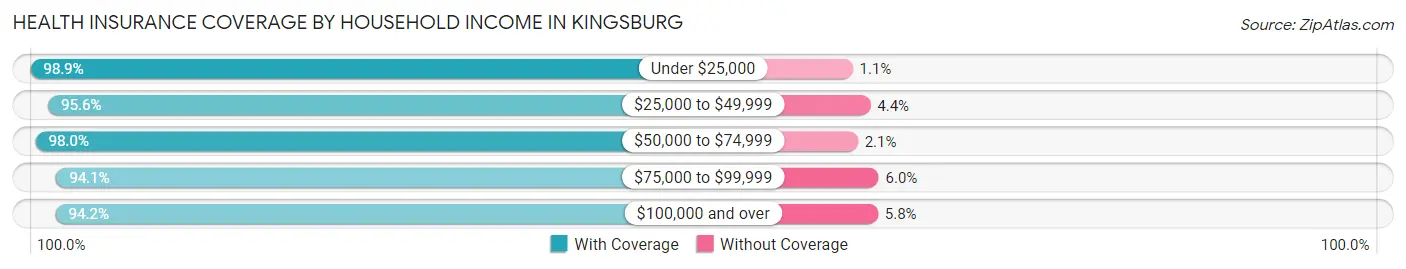
| Household Income | With Coverage | Without Coverage |
| Under $25,000 | 1,177 (98.9%) | 13 (1.1%) |
| $25,000 to $49,999 | 1,233 (95.6%) | 57 (4.4%) |
| $50,000 to $74,999 | 2,154 (98.0%) | 45 (2.1%) |
| $75,000 to $99,999 | 2,055 (94.1%) | 130 (5.9%) |
| $100,000 and over | 5,213 (94.2%) | 322 (5.8%) |
Public vs Private Health Insurance Coverage by Age in Kingsburg
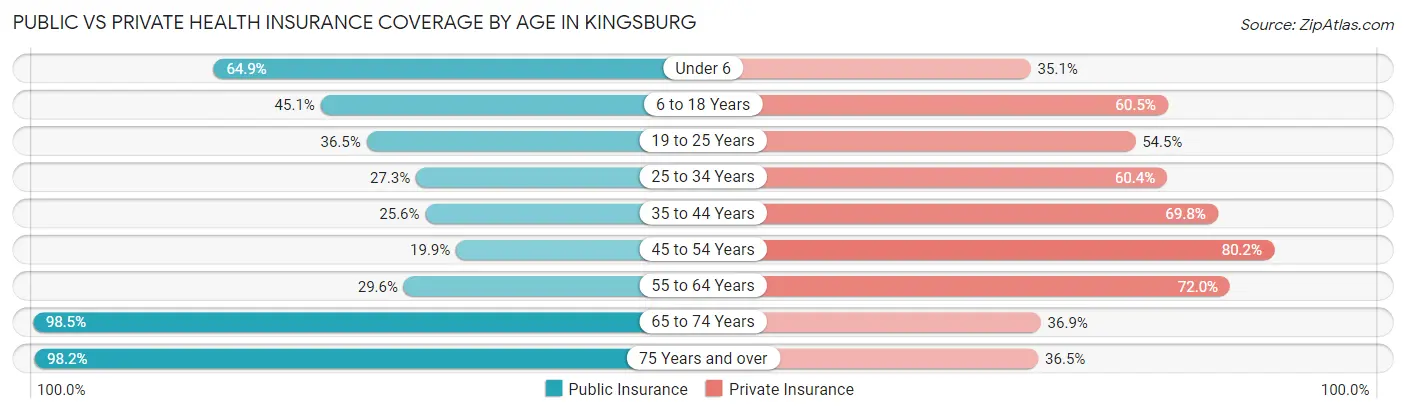
| Age Bracket | Public Insurance | Private Insurance |
| Under 6 | 426 (64.9%) | 230 (35.1%) |
| 6 to 18 Years | 1,264 (45.1%) | 1,697 (60.5%) |
| 19 to 25 Years | 381 (36.5%) | 568 (54.5%) |
| 25 to 34 Years | 336 (27.3%) | 742 (60.4%) |
| 35 to 44 Years | 543 (25.6%) | 1,479 (69.8%) |
| 45 to 54 Years | 226 (19.9%) | 910 (80.2%) |
| 55 to 64 Years | 393 (29.6%) | 956 (72.0%) |
| 65 to 74 Years | 1,219 (98.5%) | 457 (36.9%) |
| 75 Years and over | 830 (98.2%) | 308 (36.4%) |
| Total | 5,618 (45.3%) | 7,347 (59.3%) |
Disability Status by Sex by Age in Kingsburg
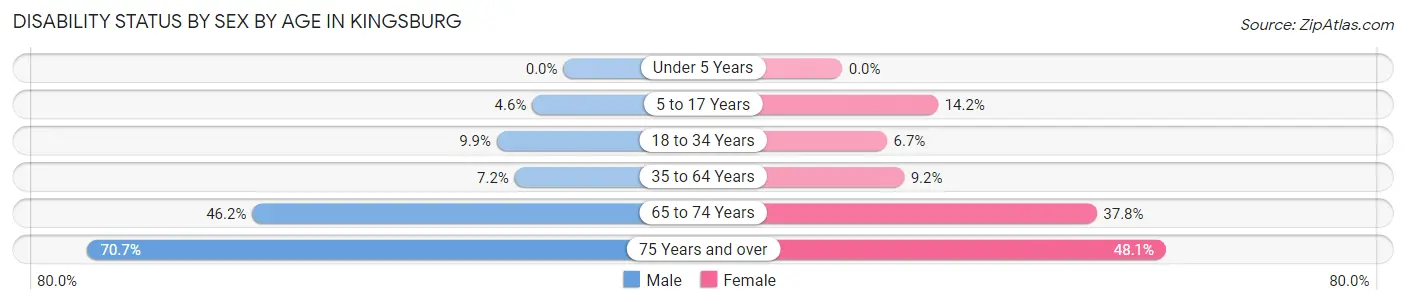
| Age Bracket | Male | Female |
| Under 5 Years | 0 (0.0%) | 0 (0.0%) |
| 5 to 17 Years | 61 (4.6%) | 186 (14.2%) |
| 18 to 34 Years | 118 (9.9%) | 87 (6.7%) |
| 35 to 64 Years | 151 (7.2%) | 229 (9.2%) |
| 65 to 74 Years | 286 (46.2%) | 234 (37.8%) |
| 75 Years and over | 277 (70.7%) | 218 (48.1%) |
Disability Class by Sex by Age in Kingsburg
Disability Class: Hearing Difficulty
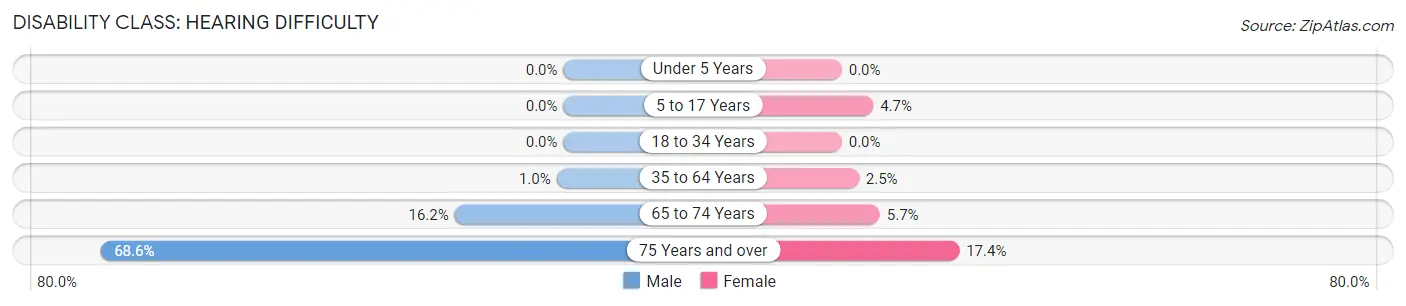
| Age Bracket | Male | Female |
| Under 5 Years | 0 (0.0%) | 0 (0.0%) |
| 5 to 17 Years | 0 (0.0%) | 61 (4.7%) |
| 18 to 34 Years | 0 (0.0%) | 0 (0.0%) |
| 35 to 64 Years | 21 (1.0%) | 63 (2.5%) |
| 65 to 74 Years | 100 (16.2%) | 35 (5.7%) |
| 75 Years and over | 269 (68.6%) | 79 (17.4%) |
Disability Class: Vision Difficulty
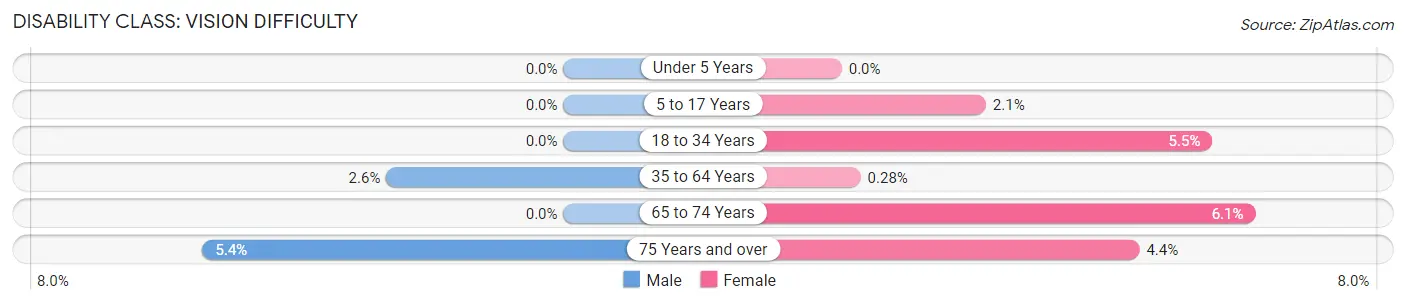
| Age Bracket | Male | Female |
| Under 5 Years | 0 (0.0%) | 0 (0.0%) |
| 5 to 17 Years | 0 (0.0%) | 28 (2.1%) |
| 18 to 34 Years | 0 (0.0%) | 72 (5.5%) |
| 35 to 64 Years | 55 (2.6%) | 7 (0.3%) |
| 65 to 74 Years | 0 (0.0%) | 38 (6.1%) |
| 75 Years and over | 21 (5.4%) | 20 (4.4%) |
Disability Class: Cognitive Difficulty
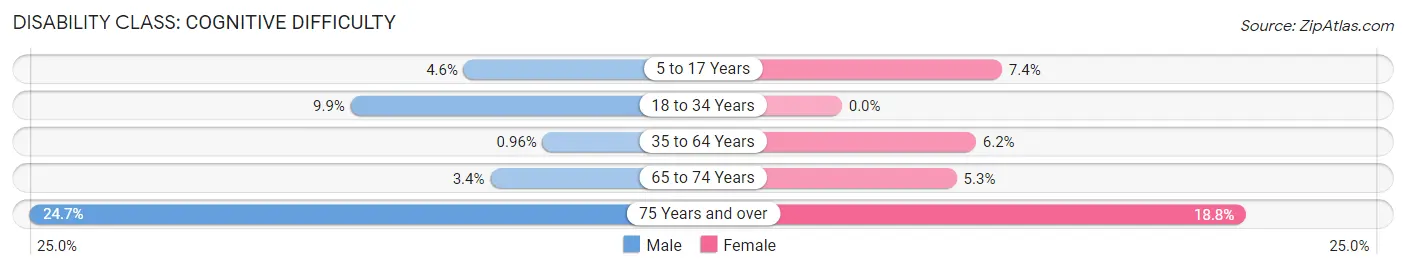
| Age Bracket | Male | Female |
| 5 to 17 Years | 61 (4.6%) | 97 (7.4%) |
| 18 to 34 Years | 118 (9.9%) | 0 (0.0%) |
| 35 to 64 Years | 20 (1.0%) | 155 (6.2%) |
| 65 to 74 Years | 21 (3.4%) | 33 (5.3%) |
| 75 Years and over | 97 (24.7%) | 85 (18.8%) |
Disability Class: Ambulatory Difficulty
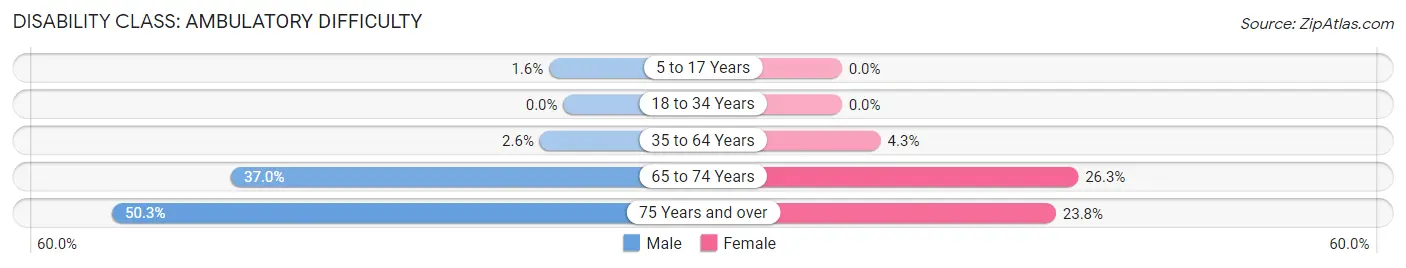
| Age Bracket | Male | Female |
| 5 to 17 Years | 21 (1.6%) | 0 (0.0%) |
| 18 to 34 Years | 0 (0.0%) | 0 (0.0%) |
| 35 to 64 Years | 55 (2.6%) | 108 (4.3%) |
| 65 to 74 Years | 229 (37.0%) | 163 (26.3%) |
| 75 Years and over | 197 (50.3%) | 108 (23.8%) |
Disability Class: Self-Care Difficulty
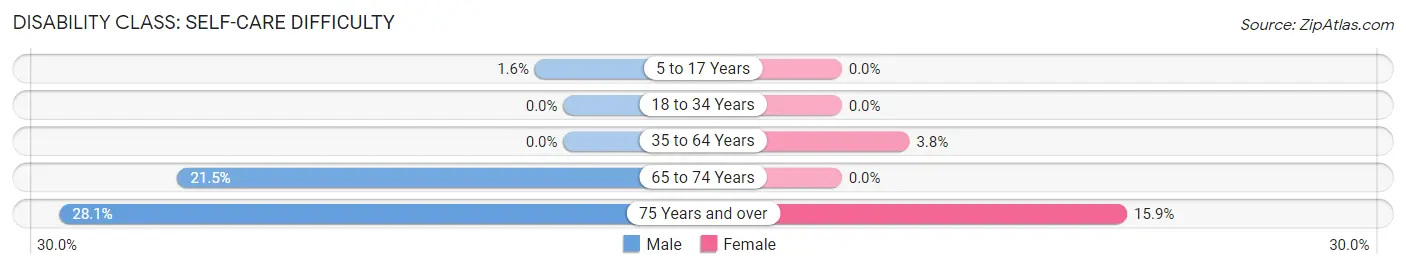
| Age Bracket | Male | Female |
| 5 to 17 Years | 21 (1.6%) | 0 (0.0%) |
| 18 to 34 Years | 0 (0.0%) | 0 (0.0%) |
| 35 to 64 Years | 0 (0.0%) | 94 (3.8%) |
| 65 to 74 Years | 133 (21.5%) | 0 (0.0%) |
| 75 Years and over | 110 (28.1%) | 72 (15.9%) |
Technology Access in Kingsburg
Computing Device Access in Kingsburg
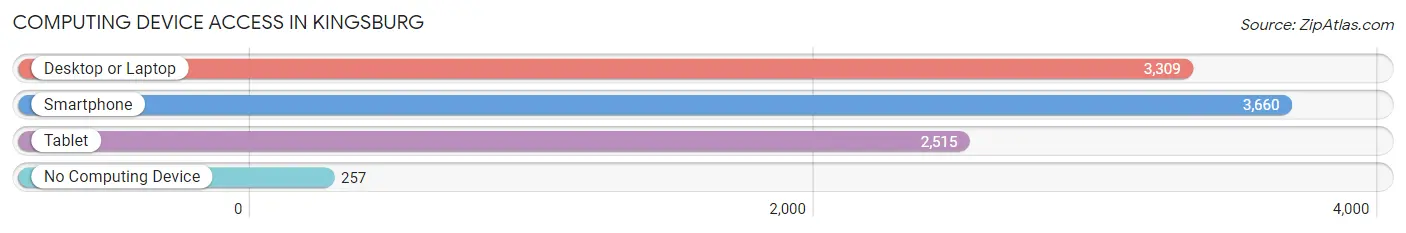
| Device Type | # Households | % Households |
| Desktop or Laptop | 3,309 | 77.7% |
| Smartphone | 3,660 | 85.9% |
| Tablet | 2,515 | 59.0% |
| No Computing Device | 257 | 6.0% |
| Total | 4,260 | 100.0% |
Internet Access in Kingsburg
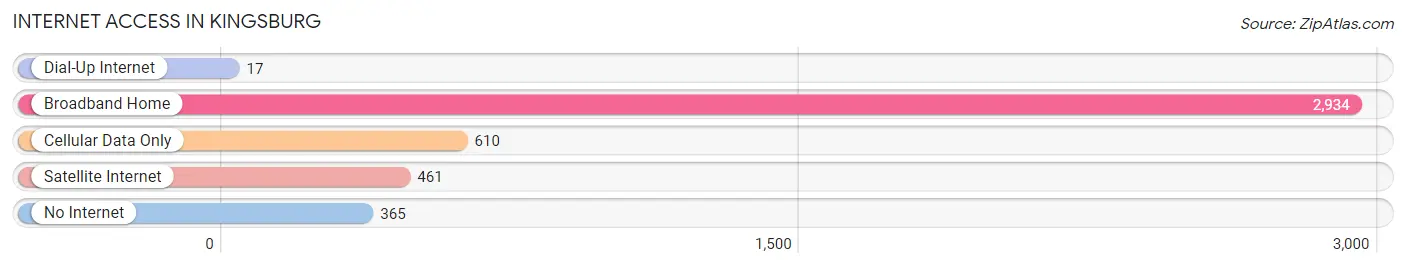
| Internet Type | # Households | % Households |
| Dial-Up Internet | 17 | 0.4% |
| Broadband Home | 2,934 | 68.9% |
| Cellular Data Only | 610 | 14.3% |
| Satellite Internet | 461 | 10.8% |
| No Internet | 365 | 8.6% |
| Total | 4,260 | 100.0% |
Kingsburg Summary
History
Kingsburg is a small city located in Fresno County, California. It is situated in the San Joaquin Valley, about 15 miles south of Fresno. The city was founded in 1874 by Swedish immigrants who were looking for a place to settle and start a new life. The city was named after the Swedish King, Gustav Vasa, and was originally called Kingsburgh.
The city was initially a farming community, with the main crops being wheat, barley, and oats. The city also had a thriving dairy industry, with many of the local farmers raising cows for milk and cheese. As the years passed, the city began to grow and expand, and by the early 1900s, it had become a bustling small town.
In the 1920s, the city began to attract more people, and the population began to grow. The city was incorporated in 1929, and the population continued to grow throughout the 1930s and 1940s. By the 1950s, the city had become a popular destination for tourists, and the population had grown to over 3,000 people.
Today, Kingsburg is a thriving small city with a population of over 11,000 people. The city is known for its Swedish heritage, and many of the local businesses and restaurants still reflect this heritage. The city is also home to a number of parks and recreational areas, as well as a number of historic buildings and sites.
Geography
Kingsburg is located in the San Joaquin Valley of California, about 15 miles south of Fresno. The city is situated on the Kings River, which flows through the city and provides a source of water for the local area. The city is surrounded by rolling hills and farmland, and is located at an elevation of about 300 feet.
The climate in Kingsburg is generally mild, with temperatures ranging from the mid-50s in the winter to the mid-90s in the summer. The city receives an average of about 10 inches of rain per year, and the area is known for its sunny days and mild temperatures.
Economy
The economy of Kingsburg is largely based on agriculture, with the main crops being wheat, barley, and oats. The city is also home to a number of food processing plants, as well as a number of other businesses. The city is also home to a number of retail stores, restaurants, and other businesses.
The city is also home to a number of educational institutions, including Kingsburg High School, Kingsburg Elementary School, and Kingsburg Community College. The city is also home to a number of medical facilities, including a hospital and a number of clinics.
Demographics
As of the 2010 census, the population of Kingsburg was 11,382. The racial makeup of the city was 75.3% White, 0.7% African American, 0.7% Native American, 0.7% Asian, 0.2% Pacific Islander, 19.3% from other races, and 3.2% from two or more races. Hispanic or Latino of any race were 33.2% of the population.
The median income for a household in the city was $41,945, and the median income for a family was $48,945. The per capita income for the city was $18,945. About 17.2% of families and 21.2% of the population were below the poverty line, including 28.2% of those under age 18 and 8.2% of those age 65 or over.
Common Questions
What is Per Capita Income in Kingsburg?
Per Capita income in Kingsburg is $32,155.
What is the Median Family Income in Kingsburg?
Median Family Income in Kingsburg is $83,242.
What is the Median Household income in Kingsburg?
Median Household Income in Kingsburg is $74,897.
What is Income or Wage Gap in Kingsburg?
Income or Wage Gap in Kingsburg is 42.0%.
Women in Kingsburg earn 58.0 cents for every dollar earned by a man.
What is Family Income Deficit in Kingsburg?
Family Income Deficit in Kingsburg is $10,545.
Families that are below poverty line in Kingsburg earn $10,545 less on average than the poverty threshold level.
What is Inequality or Gini Index in Kingsburg?
Inequality or Gini Index in Kingsburg is 0.44.
What is the Total Population of Kingsburg?
Total Population of Kingsburg is 12,490.
What is the Total Male Population of Kingsburg?
Total Male Population of Kingsburg is 5,837.
What is the Total Female Population of Kingsburg?
Total Female Population of Kingsburg is 6,653.
What is the Ratio of Males per 100 Females in Kingsburg?
There are 87.73 Males per 100 Females in Kingsburg.
What is the Ratio of Females per 100 Males in Kingsburg?
There are 113.98 Females per 100 Males in Kingsburg.
What is the Median Population Age in Kingsburg?
Median Population Age in Kingsburg is 37.6 Years.
What is the Average Family Size in Kingsburg
Average Family Size in Kingsburg is 3.6 People.
What is the Average Household Size in Kingsburg
Average Household Size in Kingsburg is 2.9 People.
How Large is the Labor Force in Kingsburg?
There are 5,429 People in the Labor Forcein in Kingsburg.
What is the Percentage of People in the Labor Force in Kingsburg?
55.3% of People are in the Labor Force in Kingsburg.
What is the Unemployment Rate in Kingsburg?
Unemployment Rate in Kingsburg is 5.5%.