Cities with the Largest Ghanaian Community in Maryland
RELATED REPORTS & OPTIONS
Ghanaian
Maryland
Compare Cities
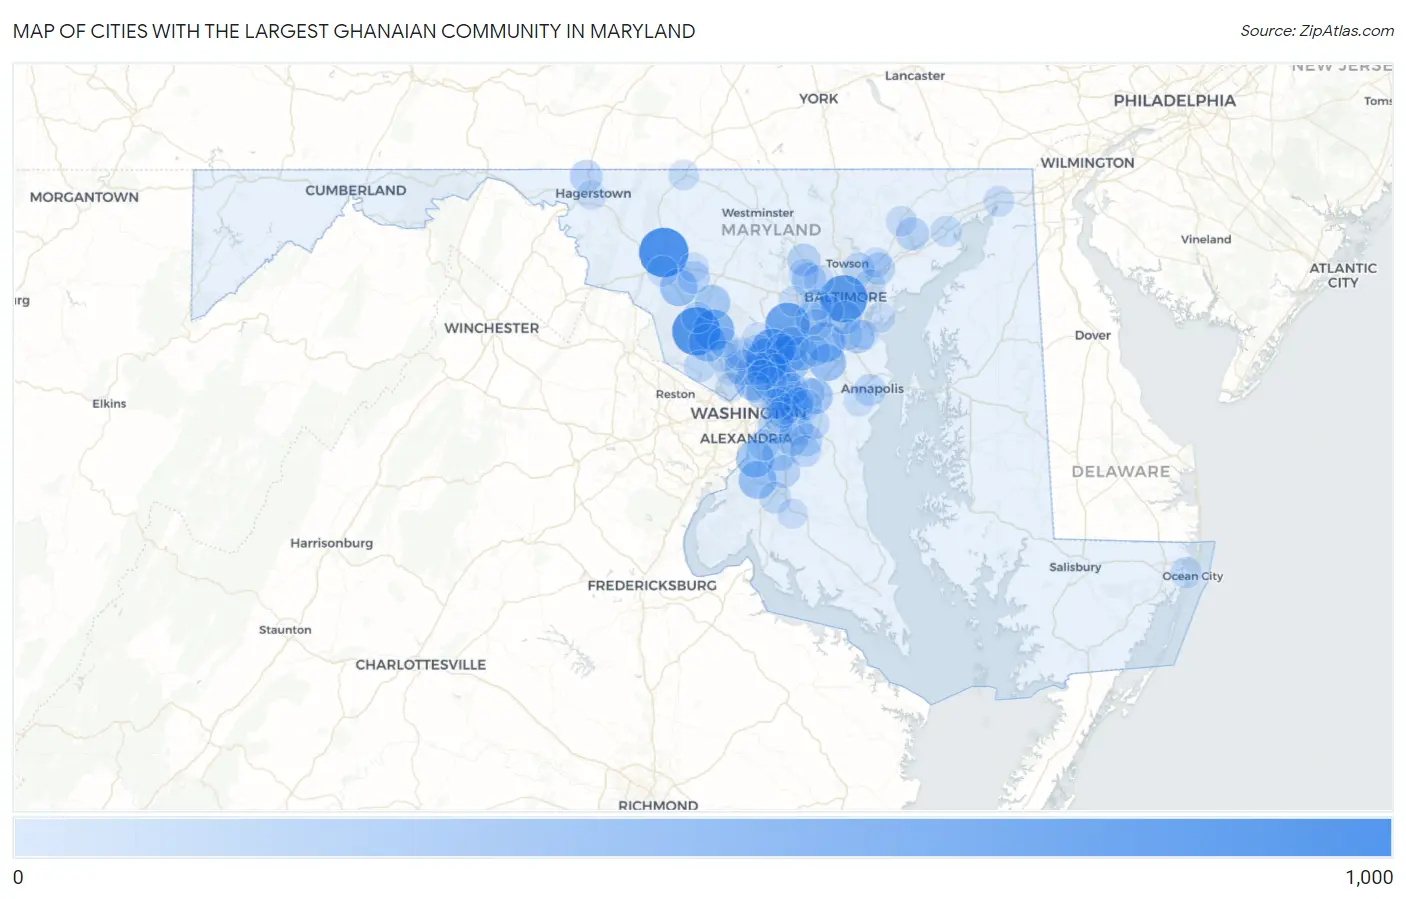
Map of Cities with the Largest Ghanaian Community in Maryland
0
1,000
Cities with the Largest Ghanaian Community in Maryland
| City | Ghanaian | vs State | vs National | |
| 1. | Frederick | 840 | 15,933(5.27%)#1 | 185,371(0.45%)#19 |
| 2. | Germantown | 780 | 15,933(4.90%)#2 | 185,371(0.42%)#27 |
| 3. | Baltimore | 733 | 15,933(4.60%)#3 | 185,371(0.40%)#30 |
| 4. | Columbia | 620 | 15,933(3.89%)#4 | 185,371(0.33%)#39 |
| 5. | Fairland | 544 | 15,933(3.41%)#5 | 185,371(0.29%)#45 |
| 6. | Burtonsville | 540 | 15,933(3.39%)#6 | 185,371(0.29%)#46 |
| 7. | Montgomery Village | 471 | 15,933(2.96%)#7 | 185,371(0.25%)#50 |
| 8. | Severn | 415 | 15,933(2.60%)#8 | 185,371(0.22%)#54 |
| 9. | Gaithersburg | 332 | 15,933(2.08%)#9 | 185,371(0.18%)#72 |
| 10. | Accokeek | 332 | 15,933(2.08%)#10 | 185,371(0.18%)#73 |
| 11. | Fort Washington | 331 | 15,933(2.08%)#11 | 185,371(0.18%)#74 |
| 12. | Urbana | 317 | 15,933(1.99%)#12 | 185,371(0.17%)#80 |
| 13. | Odenton | 306 | 15,933(1.92%)#13 | 185,371(0.17%)#84 |
| 14. | Laurel | 306 | 15,933(1.92%)#14 | 185,371(0.17%)#85 |
| 15. | New Carrollton | 289 | 15,933(1.81%)#15 | 185,371(0.16%)#89 |
| 16. | Greenbelt | 245 | 15,933(1.54%)#16 | 185,371(0.13%)#109 |
| 17. | Silver Spring | 244 | 15,933(1.53%)#17 | 185,371(0.13%)#110 |
| 18. | Bowie | 243 | 15,933(1.53%)#18 | 185,371(0.13%)#112 |
| 19. | Wheaton | 240 | 15,933(1.51%)#19 | 185,371(0.13%)#114 |
| 20. | South Laurel | 235 | 15,933(1.47%)#20 | 185,371(0.13%)#118 |
| 21. | Damascus | 223 | 15,933(1.40%)#21 | 185,371(0.12%)#128 |
| 22. | Calverton | 215 | 15,933(1.35%)#22 | 185,371(0.12%)#131 |
| 23. | Suitland | 202 | 15,933(1.27%)#23 | 185,371(0.11%)#141 |
| 24. | Honeygo | 194 | 15,933(1.22%)#24 | 185,371(0.10%)#147 |
| 25. | Pasadena | 192 | 15,933(1.21%)#25 | 185,371(0.10%)#149 |
| 26. | Milford Mill | 180 | 15,933(1.13%)#26 | 185,371(0.10%)#163 |
| 27. | Lake Arbor | 177 | 15,933(1.11%)#27 | 185,371(0.10%)#167 |
| 28. | Maryland City | 172 | 15,933(1.08%)#28 | 185,371(0.09%)#172 |
| 29. | Landover | 167 | 15,933(1.05%)#29 | 185,371(0.09%)#178 |
| 30. | North Laurel | 167 | 15,933(1.05%)#30 | 185,371(0.09%)#179 |
| 31. | Clinton | 160 | 15,933(1.00%)#31 | 185,371(0.09%)#182 |
| 32. | Chillum | 157 | 15,933(0.99%)#32 | 185,371(0.08%)#188 |
| 33. | Westphalia | 147 | 15,933(0.92%)#33 | 185,371(0.08%)#204 |
| 34. | Woodlawn Cdp Baltimore County | 143 | 15,933(0.90%)#34 | 185,371(0.08%)#208 |
| 35. | Brooklyn Park | 142 | 15,933(0.89%)#35 | 185,371(0.08%)#212 |
| 36. | Bel Air South | 139 | 15,933(0.87%)#36 | 185,371(0.07%)#217 |
| 37. | Owings Mills | 135 | 15,933(0.85%)#37 | 185,371(0.07%)#222 |
| 38. | Brandywine | 130 | 15,933(0.82%)#38 | 185,371(0.07%)#242 |
| 39. | Maugansville | 128 | 15,933(0.80%)#39 | 185,371(0.07%)#246 |
| 40. | Queensland | 127 | 15,933(0.80%)#40 | 185,371(0.07%)#250 |
| 41. | Springdale | 125 | 15,933(0.78%)#41 | 185,371(0.07%)#255 |
| 42. | Monrovia | 125 | 15,933(0.78%)#42 | 185,371(0.07%)#256 |
| 43. | Beltsville | 112 | 15,933(0.70%)#43 | 185,371(0.06%)#276 |
| 44. | White Marsh | 105 | 15,933(0.66%)#44 | 185,371(0.06%)#302 |
| 45. | Annapolis | 99 | 15,933(0.62%)#45 | 185,371(0.05%)#316 |
| 46. | Fairwood | 99 | 15,933(0.62%)#46 | 185,371(0.05%)#318 |
| 47. | White Oak | 98 | 15,933(0.62%)#47 | 185,371(0.05%)#322 |
| 48. | Arbutus | 96 | 15,933(0.60%)#48 | 185,371(0.05%)#324 |
| 49. | Parkville | 93 | 15,933(0.58%)#49 | 185,371(0.05%)#333 |
| 50. | Ilchester | 90 | 15,933(0.56%)#50 | 185,371(0.05%)#340 |
| 51. | Melwood | 90 | 15,933(0.56%)#51 | 185,371(0.05%)#342 |
| 52. | Waldorf | 83 | 15,933(0.52%)#52 | 185,371(0.04%)#369 |
| 53. | Elkridge | 83 | 15,933(0.52%)#53 | 185,371(0.04%)#370 |
| 54. | Summerfield | 83 | 15,933(0.52%)#54 | 185,371(0.04%)#371 |
| 55. | Travilah | 80 | 15,933(0.50%)#55 | 185,371(0.04%)#382 |
| 56. | Marlton | 76 | 15,933(0.48%)#56 | 185,371(0.04%)#393 |
| 57. | Peppermill Village | 76 | 15,933(0.48%)#57 | 185,371(0.04%)#394 |
| 58. | Seabrook | 75 | 15,933(0.47%)#58 | 185,371(0.04%)#397 |
| 59. | Oxon Hill | 75 | 15,933(0.47%)#59 | 185,371(0.04%)#398 |
| 60. | Clarksburg | 73 | 15,933(0.46%)#60 | 185,371(0.04%)#402 |
| 61. | Catonsville | 70 | 15,933(0.44%)#61 | 185,371(0.04%)#420 |
| 62. | Brock Hall | 68 | 15,933(0.43%)#62 | 185,371(0.04%)#436 |
| 63. | Kemp Mill | 66 | 15,933(0.41%)#63 | 185,371(0.04%)#443 |
| 64. | College Park | 64 | 15,933(0.40%)#64 | 185,371(0.03%)#457 |
| 65. | Aberdeen | 61 | 15,933(0.38%)#65 | 185,371(0.03%)#477 |
| 66. | Rockville | 60 | 15,933(0.38%)#66 | 185,371(0.03%)#479 |
| 67. | Glen Burnie | 58 | 15,933(0.36%)#67 | 185,371(0.03%)#491 |
| 68. | Rosedale | 58 | 15,933(0.36%)#68 | 185,371(0.03%)#493 |
| 69. | Woodmore | 57 | 15,933(0.36%)#69 | 185,371(0.03%)#502 |
| 70. | West Ocean City | 56 | 15,933(0.35%)#70 | 185,371(0.03%)#506 |
| 71. | Ballenger Creek | 52 | 15,933(0.33%)#71 | 185,371(0.03%)#530 |
| 72. | Fort Meade | 48 | 15,933(0.30%)#72 | 185,371(0.03%)#554 |
| 73. | Capitol Heights | 47 | 15,933(0.29%)#73 | 185,371(0.03%)#565 |
| 74. | North Bethesda | 46 | 15,933(0.29%)#74 | 185,371(0.02%)#568 |
| 75. | North East | 45 | 15,933(0.28%)#75 | 185,371(0.02%)#576 |
| 76. | Leisure World | 44 | 15,933(0.28%)#76 | 185,371(0.02%)#585 |
| 77. | Aspen Hill | 42 | 15,933(0.26%)#77 | 185,371(0.02%)#600 |
| 78. | Randallstown | 42 | 15,933(0.26%)#78 | 185,371(0.02%)#604 |
| 79. | Emmitsburg | 42 | 15,933(0.26%)#79 | 185,371(0.02%)#606 |
| 80. | Bel Air North | 39 | 15,933(0.24%)#80 | 185,371(0.02%)#621 |
| 81. | Cloverly | 39 | 15,933(0.24%)#81 | 185,371(0.02%)#625 |
| 82. | Takoma Park | 37 | 15,933(0.23%)#82 | 185,371(0.02%)#644 |
| 83. | Ellicott City | 34 | 15,933(0.21%)#83 | 185,371(0.02%)#661 |
| 84. | Mitchellville | 34 | 15,933(0.21%)#84 | 185,371(0.02%)#665 |
| 85. | Burnt Mills | 31 | 15,933(0.19%)#85 | 185,371(0.02%)#691 |
| 86. | Lochearn | 29 | 15,933(0.18%)#86 | 185,371(0.02%)#706 |
| 87. | Bryantown | 29 | 15,933(0.18%)#87 | 185,371(0.02%)#713 |
| 88. | Wildewood | 28 | 15,933(0.18%)#88 | 185,371(0.02%)#719 |
| 89. | Ashton Sandy Spring | 28 | 15,933(0.18%)#89 | 185,371(0.02%)#721 |
| 90. | Hillandale | 28 | 15,933(0.18%)#90 | 185,371(0.02%)#722 |
| 91. | West Laurel | 26 | 15,933(0.16%)#91 | 185,371(0.01%)#747 |
| 92. | Perry Hall | 24 | 15,933(0.15%)#92 | 185,371(0.01%)#780 |
| 93. | Cheverly | 23 | 15,933(0.14%)#93 | 185,371(0.01%)#799 |
| 94. | Edgewater | 22 | 15,933(0.14%)#94 | 185,371(0.01%)#813 |
| 95. | New Market | 21 | 15,933(0.13%)#95 | 185,371(0.01%)#826 |
| 96. | Edgemere | 20 | 15,933(0.13%)#96 | 185,371(0.01%)#841 |
| 97. | Hagerstown | 18 | 15,933(0.11%)#97 | 185,371(0.01%)#867 |
| 98. | Redland | 16 | 15,933(0.10%)#98 | 185,371(0.01%)#911 |
| 99. | Riviera Beach | 16 | 15,933(0.10%)#99 | 185,371(0.01%)#917 |
| 100. | Bethesda | 13 | 15,933(0.08%)#100 | 185,371(0.01%)#963 |
Common Questions
What are the Top 10 Cities with the Largest Ghanaian Community in Maryland?
Top 10 Cities with the Largest Ghanaian Community in Maryland are:
#1
840
#2
780
#3
733
#4
620
#5
544
#6
540
#7
471
#8
415
#9
332
#10
332
What city has the Largest Ghanaian Community in Maryland?
Frederick has the Largest Ghanaian Community in Maryland with 840.
What is the Total Ghanaian Population in the State of Maryland?
Total Ghanaian Population in Maryland is 15,933.
What is the Total Ghanaian Population in the United States?
Total Ghanaian Population in the United States is 185,371.