Cities with the Fewest Births per 1,000 Women Below Poverty Level in Maryland
RELATED REPORTS & OPTIONS
Lowest Birth Rate | Below Poverty
Maryland
Compare Cities
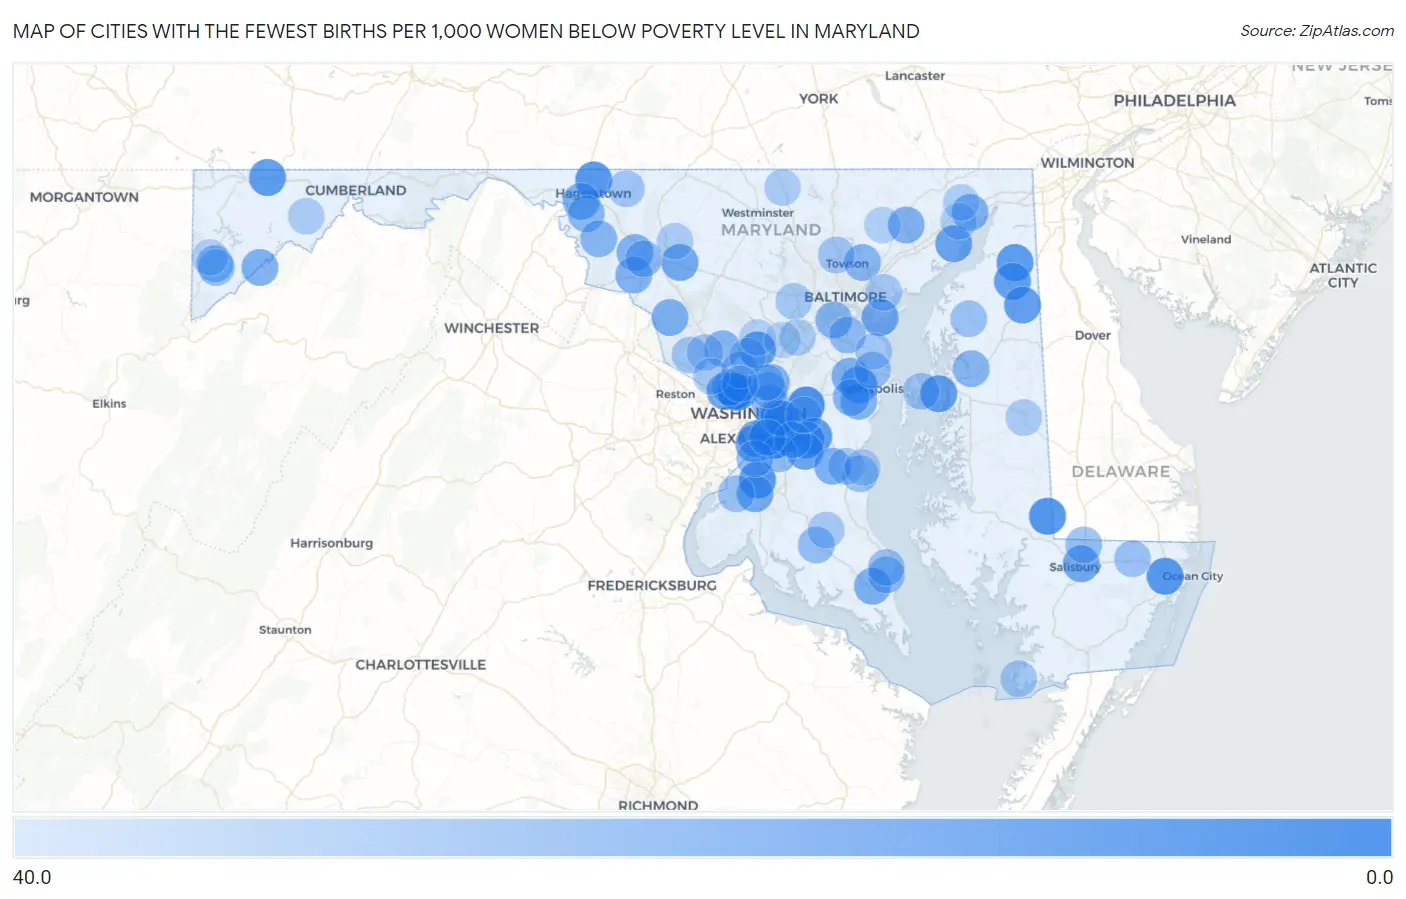
Map of Cities with the Fewest Births per 1,000 Women Below Poverty Level in Maryland
40.0
0.0
Cities with the Fewest Births per 1,000 Women Below Poverty Level in Maryland
| City | Births / 1,000 Women | vs State | vs National | |
| 1. | Camp Springs | 2.0 | 52.0(-50.0)#1 | 53.0(-51.0)#6 |
| 2. | Chevy Chase Village | 7.0 | 52.0(-45.0)#2 | 53.0(-46.0)#194 |
| 3. | Marlow Heights | 8.0 | 52.0(-44.0)#3 | 53.0(-45.0)#259 |
| 4. | Woodmore | 8.0 | 52.0(-44.0)#4 | 53.0(-45.0)#270 |
| 5. | Friendship Heights Village | 10.0 | 52.0(-42.0)#5 | 53.0(-43.0)#454 |
| 6. | Sharptown | 10.0 | 52.0(-42.0)#6 | 53.0(-43.0)#525 |
| 7. | Accokeek | 11.0 | 52.0(-41.0)#7 | 53.0(-42.0)#549 |
| 8. | Fountainhead Orchard Hills | 11.0 | 52.0(-41.0)#8 | 53.0(-42.0)#564 |
| 9. | Berlin | 11.0 | 52.0(-41.0)#9 | 53.0(-42.0)#570 |
| 10. | Morningside | 12.0 | 52.0(-40.0)#10 | 53.0(-41.0)#730 |
| 11. | Grantsville | 12.0 | 52.0(-40.0)#11 | 53.0(-41.0)#739 |
| 12. | Cecilton | 12.0 | 52.0(-40.0)#12 | 53.0(-41.0)#744 |
| 13. | Upper Marlboro | 13.0 | 52.0(-39.0)#13 | 53.0(-40.0)#882 |
| 14. | Cloverly | 14.0 | 52.0(-38.0)#14 | 53.0(-39.0)#924 |
| 15. | Grasonville | 14.0 | 52.0(-38.0)#15 | 53.0(-39.0)#962 |
| 16. | Queensland | 14.0 | 52.0(-38.0)#16 | 53.0(-39.0)#982 |
| 17. | Galena | 14.0 | 52.0(-38.0)#17 | 53.0(-39.0)#1,031 |
| 18. | Millington | 14.0 | 52.0(-38.0)#18 | 53.0(-39.0)#1,034 |
| 19. | Parole | 15.0 | 52.0(-37.0)#19 | 53.0(-38.0)#1,069 |
| 20. | Marlton | 16.0 | 52.0(-36.0)#20 | 53.0(-37.0)#1,236 |
| 21. | Aberdeen Proving Ground | 16.0 | 52.0(-36.0)#21 | 53.0(-37.0)#1,293 |
| 22. | Glen Echo | 16.0 | 52.0(-36.0)#22 | 53.0(-37.0)#1,392 |
| 23. | National Harbor | 17.0 | 52.0(-35.0)#23 | 53.0(-36.0)#1,442 |
| 24. | Salisbury | 18.0 | 52.0(-34.0)#24 | 53.0(-35.0)#1,560 |
| 25. | Coral Hills | 18.0 | 52.0(-34.0)#25 | 53.0(-35.0)#1,578 |
| 26. | Edgemere | 18.0 | 52.0(-34.0)#26 | 53.0(-35.0)#1,581 |
| 27. | Forest Heights | 18.0 | 52.0(-34.0)#27 | 53.0(-35.0)#1,628 |
| 28. | Spring Ridge | 19.0 | 52.0(-33.0)#28 | 53.0(-34.0)#1,782 |
| 29. | Bensville | 20.0 | 52.0(-32.0)#29 | 53.0(-33.0)#1,920 |
| 30. | California | 21.0 | 52.0(-31.0)#30 | 53.0(-32.0)#2,089 |
| 31. | Halfway | 21.0 | 52.0(-31.0)#31 | 53.0(-32.0)#2,099 |
| 32. | Dunkirk | 21.0 | 52.0(-31.0)#32 | 53.0(-32.0)#2,142 |
| 33. | Crownsville | 21.0 | 52.0(-31.0)#33 | 53.0(-32.0)#2,171 |
| 34. | College Park | 22.0 | 52.0(-30.0)#34 | 53.0(-31.0)#2,251 |
| 35. | Kitzmiller | 22.0 | 52.0(-30.0)#35 | 53.0(-31.0)#2,441 |
| 36. | Barnesville | 22.0 | 52.0(-30.0)#36 | 53.0(-31.0)#2,445 |
| 37. | Bel Air | 23.0 | 52.0(-29.0)#37 | 53.0(-30.0)#2,488 |
| 38. | Edgewater | 23.0 | 52.0(-29.0)#38 | 53.0(-30.0)#2,497 |
| 39. | Middletown | 23.0 | 52.0(-29.0)#39 | 53.0(-30.0)#2,515 |
| 40. | Perryville | 23.0 | 52.0(-29.0)#40 | 53.0(-30.0)#2,520 |
| 41. | Jefferson | 23.0 | 52.0(-29.0)#41 | 53.0(-30.0)#2,539 |
| 42. | Linthicum | 24.0 | 52.0(-28.0)#42 | 53.0(-29.0)#2,654 |
| 43. | Riva | 24.0 | 52.0(-28.0)#43 | 53.0(-29.0)#2,681 |
| 44. | Carney | 25.0 | 52.0(-27.0)#44 | 53.0(-28.0)#2,850 |
| 45. | Centreville | 25.0 | 52.0(-27.0)#45 | 53.0(-28.0)#2,891 |
| 46. | St James | 25.0 | 52.0(-27.0)#46 | 53.0(-28.0)#2,902 |
| 47. | Derwood | 25.0 | 52.0(-27.0)#47 | 53.0(-28.0)#2,939 |
| 48. | Colmar Manor | 25.0 | 52.0(-27.0)#48 | 53.0(-28.0)#2,954 |
| 49. | Keedysville | 25.0 | 52.0(-27.0)#49 | 53.0(-28.0)#2,970 |
| 50. | Mountain Lake Park | 26.0 | 52.0(-26.0)#50 | 53.0(-27.0)#3,151 |
| 51. | Glen Burnie | 27.0 | 52.0(-25.0)#51 | 53.0(-26.0)#3,247 |
| 52. | Capitol Heights | 27.0 | 52.0(-25.0)#52 | 53.0(-26.0)#3,311 |
| 53. | Drum Point | 27.0 | 52.0(-25.0)#53 | 53.0(-26.0)#3,327 |
| 54. | Braddock Heights | 27.0 | 52.0(-25.0)#54 | 53.0(-26.0)#3,329 |
| 55. | Somerset | 27.0 | 52.0(-25.0)#55 | 53.0(-26.0)#3,379 |
| 56. | Clinton | 28.0 | 52.0(-24.0)#56 | 53.0(-25.0)#3,440 |
| 57. | Fort Washington | 28.0 | 52.0(-24.0)#57 | 53.0(-25.0)#3,451 |
| 58. | Arnold | 28.0 | 52.0(-24.0)#58 | 53.0(-25.0)#3,454 |
| 59. | Mechanicsville | 28.0 | 52.0(-24.0)#59 | 53.0(-25.0)#3,561 |
| 60. | Bethesda | 29.0 | 52.0(-23.0)#60 | 53.0(-24.0)#3,635 |
| 61. | Walker Mill | 29.0 | 52.0(-23.0)#61 | 53.0(-24.0)#3,680 |
| 62. | North Kensington | 29.0 | 52.0(-23.0)#62 | 53.0(-24.0)#3,687 |
| 63. | Delmar | 29.0 | 52.0(-23.0)#63 | 53.0(-24.0)#3,728 |
| 64. | Bryans Road | 30.0 | 52.0(-22.0)#64 | 53.0(-23.0)#3,921 |
| 65. | Chesapeake Beach | 30.0 | 52.0(-22.0)#65 | 53.0(-23.0)#3,934 |
| 66. | Chestertown | 30.0 | 52.0(-22.0)#66 | 53.0(-23.0)#3,939 |
| 67. | Lusby | 30.0 | 52.0(-22.0)#67 | 53.0(-23.0)#3,997 |
| 68. | Willards | 30.0 | 52.0(-22.0)#68 | 53.0(-23.0)#4,033 |
| 69. | Loch Lynn Heights | 30.0 | 52.0(-22.0)#69 | 53.0(-23.0)#4,070 |
| 70. | Chester | 31.0 | 52.0(-21.0)#70 | 53.0(-22.0)#4,187 |
| 71. | Mays Chapel | 32.0 | 52.0(-20.0)#71 | 53.0(-21.0)#4,377 |
| 72. | Darnestown | 32.0 | 52.0(-20.0)#72 | 53.0(-21.0)#4,409 |
| 73. | Smithsburg | 32.0 | 52.0(-20.0)#73 | 53.0(-21.0)#4,439 |
| 74. | University Park | 32.0 | 52.0(-20.0)#74 | 53.0(-21.0)#4,448 |
| 75. | Ellicott City | 33.0 | 52.0(-19.0)#75 | 53.0(-20.0)#4,544 |
| 76. | Essex | 33.0 | 52.0(-19.0)#76 | 53.0(-20.0)#4,553 |
| 77. | North Potomac | 33.0 | 52.0(-19.0)#77 | 53.0(-20.0)#4,564 |
| 78. | Adelphi | 33.0 | 52.0(-19.0)#78 | 53.0(-20.0)#4,574 |
| 79. | Crisfield | 33.0 | 52.0(-19.0)#79 | 53.0(-20.0)#4,659 |
| 80. | Lake Shore | 34.0 | 52.0(-18.0)#80 | 53.0(-19.0)#4,814 |
| 81. | Layhill | 34.0 | 52.0(-18.0)#81 | 53.0(-19.0)#4,884 |
| 82. | Golden Beach | 34.0 | 52.0(-18.0)#82 | 53.0(-19.0)#4,904 |
| 83. | Melwood | 34.0 | 52.0(-18.0)#83 | 53.0(-19.0)#4,911 |
| 84. | Owings | 34.0 | 52.0(-18.0)#84 | 53.0(-19.0)#4,936 |
| 85. | Potomac | 35.0 | 52.0(-17.0)#85 | 53.0(-18.0)#5,045 |
| 86. | Chevy Chase | 35.0 | 52.0(-17.0)#86 | 53.0(-18.0)#5,092 |
| 87. | Temple Hills | 35.0 | 52.0(-17.0)#87 | 53.0(-18.0)#5,103 |
| 88. | Savage | 35.0 | 52.0(-17.0)#88 | 53.0(-18.0)#5,106 |
| 89. | Walkersville | 35.0 | 52.0(-17.0)#89 | 53.0(-18.0)#5,115 |
| 90. | Manchester | 35.0 | 52.0(-17.0)#90 | 53.0(-18.0)#5,124 |
| 91. | Denton | 35.0 | 52.0(-17.0)#91 | 53.0(-18.0)#5,131 |
| 92. | Lonaconing | 35.0 | 52.0(-17.0)#92 | 53.0(-18.0)#5,204 |
| 93. | Havre De Grace | 36.0 | 52.0(-16.0)#93 | 53.0(-17.0)#5,291 |
| 94. | Kettering | 36.0 | 52.0(-16.0)#94 | 53.0(-17.0)#5,297 |
| 95. | Oakland | 36.0 | 52.0(-16.0)#95 | 53.0(-17.0)#5,394 |
| 96. | Port Deposit | 36.0 | 52.0(-16.0)#96 | 53.0(-17.0)#5,461 |
| 97. | Fallston | 37.0 | 52.0(-15.0)#97 | 53.0(-16.0)#5,569 |
| 98. | Ashton Sandy Spring | 37.0 | 52.0(-15.0)#98 | 53.0(-16.0)#5,602 |
| 99. | North Beach | 37.0 | 52.0(-15.0)#99 | 53.0(-16.0)#5,637 |
| 100. | Scaggsville | 38.0 | 52.0(-14.0)#100 | 53.0(-15.0)#5,795 |
Common Questions
What are the Top 10 Cities with the Fewest Births per 1,000 Women Below Poverty Level in Maryland?
Top 10 Cities with the Fewest Births per 1,000 Women Below Poverty Level in Maryland are:
#1
2.0
#2
7.0
#3
8.0
#4
8.0
#5
10.0
#6
10.0
#7
11.0
#8
11.0
#9
11.0
#10
12.0
What city has the Fewest Births per 1,000 Women Below Poverty Level in Maryland?
Camp Springs has the Fewest Births per 1,000 Women Below Poverty Level in Maryland with 2.0.
What is the Number of Births per 1,000 Women Below Poverty Level in the State of Maryland?
Number of Births per 1,000 Women Below Poverty Level in Maryland is 52.0.
What is the Number of Births per 1,000 Women Below Poverty Level in the United States?
Number of Births per 1,000 Women Below Poverty Level in the United States is 53.0.