Cities with the Fewest Births per 1,000 Women Below Poverty Level in Wisconsin
RELATED REPORTS & OPTIONS
Lowest Birth Rate | Below Poverty
Wisconsin
Compare Cities
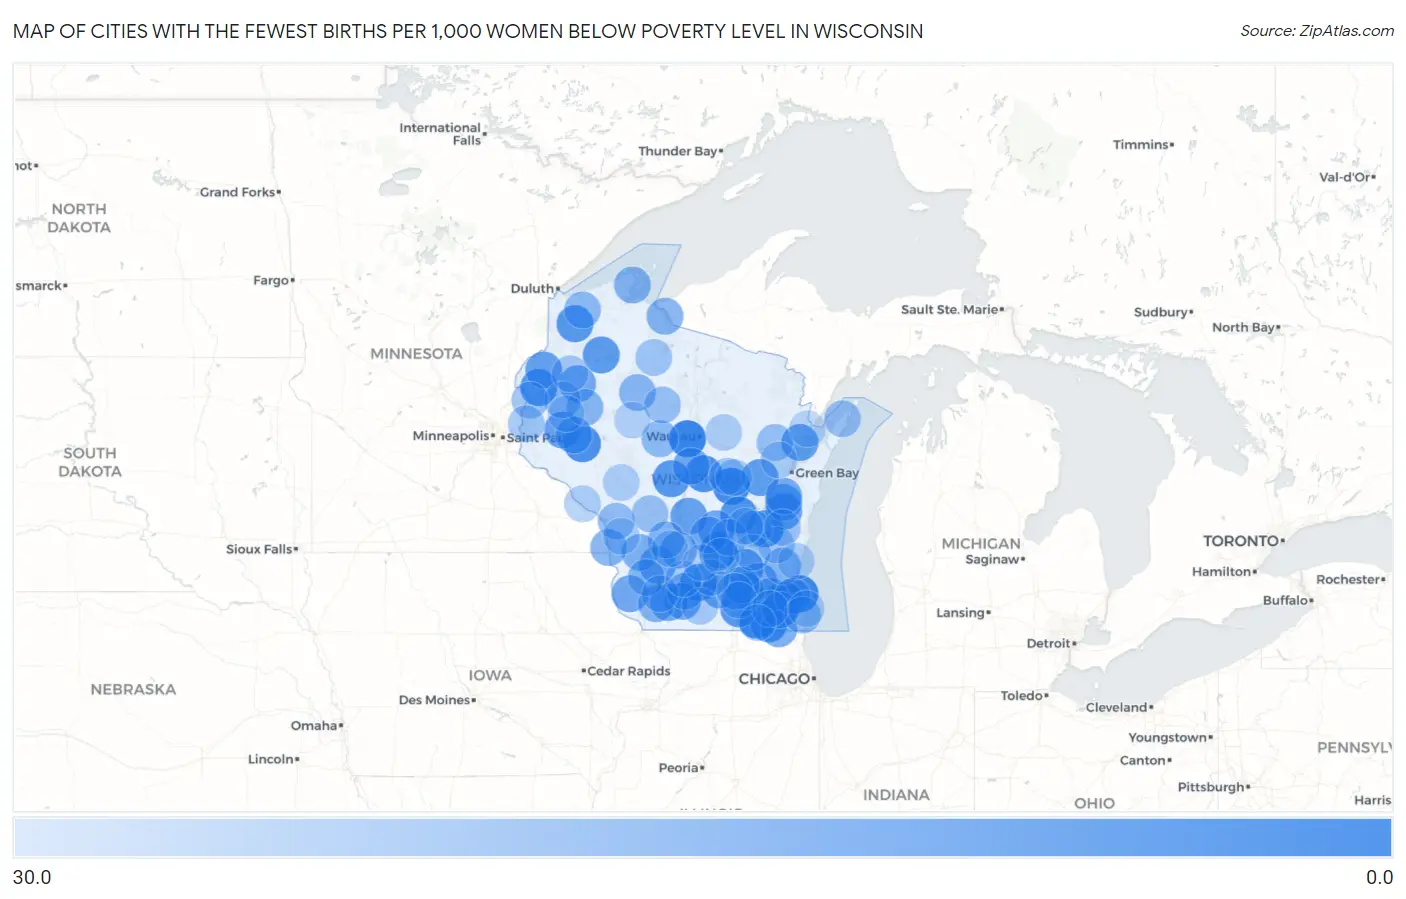
Map of Cities with the Fewest Births per 1,000 Women Below Poverty Level in Wisconsin
30.0
0.0
Cities with the Fewest Births per 1,000 Women Below Poverty Level in Wisconsin
| City | Births / 1,000 Women | vs State | vs National | |
| 1. | Marathon City | 3.0 | 52.0(-49.0)#1 | 53.0(-50.0)#32 |
| 2. | St Francis | 4.0 | 52.0(-48.0)#2 | 53.0(-49.0)#38 |
| 3. | Waupaca | 5.0 | 52.0(-47.0)#3 | 53.0(-48.0)#74 |
| 4. | Delavan | 6.0 | 52.0(-46.0)#4 | 53.0(-47.0)#114 |
| 5. | North Fond Du Lac | 6.0 | 52.0(-46.0)#5 | 53.0(-47.0)#121 |
| 6. | Cross Plains | 7.0 | 52.0(-45.0)#6 | 53.0(-46.0)#173 |
| 7. | Whiting | 7.0 | 52.0(-45.0)#7 | 53.0(-46.0)#205 |
| 8. | Elk Mound | 7.0 | 52.0(-45.0)#8 | 53.0(-46.0)#215 |
| 9. | Lake Geneva | 8.0 | 52.0(-44.0)#9 | 53.0(-45.0)#250 |
| 10. | Berlin | 8.0 | 52.0(-44.0)#10 | 53.0(-45.0)#264 |
| 11. | Luck | 8.0 | 52.0(-44.0)#11 | 53.0(-45.0)#311 |
| 12. | Milton | 9.0 | 52.0(-43.0)#12 | 53.0(-44.0)#345 |
| 13. | Tichigan | 9.0 | 52.0(-43.0)#13 | 53.0(-44.0)#351 |
| 14. | Pittsville | 9.0 | 52.0(-43.0)#14 | 53.0(-44.0)#408 |
| 15. | Solon Springs | 9.0 | 52.0(-43.0)#15 | 53.0(-44.0)#412 |
| 16. | Little Round Lake | 10.0 | 52.0(-42.0)#16 | 53.0(-43.0)#510 |
| 17. | Shiocton | 10.0 | 52.0(-42.0)#17 | 53.0(-43.0)#521 |
| 18. | Oconto | 11.0 | 52.0(-41.0)#18 | 53.0(-42.0)#575 |
| 19. | Reeseville | 11.0 | 52.0(-41.0)#19 | 53.0(-42.0)#623 |
| 20. | Richland Center | 12.0 | 52.0(-40.0)#20 | 53.0(-41.0)#675 |
| 21. | Chilton | 12.0 | 52.0(-40.0)#21 | 53.0(-41.0)#689 |
| 22. | Adams | 12.0 | 52.0(-40.0)#22 | 53.0(-41.0)#710 |
| 23. | Boyceville | 12.0 | 52.0(-40.0)#23 | 53.0(-41.0)#726 |
| 24. | Siren | 12.0 | 52.0(-40.0)#24 | 53.0(-41.0)#756 |
| 25. | Wyocena | 12.0 | 52.0(-40.0)#25 | 53.0(-41.0)#760 |
| 26. | Muskego | 13.0 | 52.0(-39.0)#26 | 53.0(-40.0)#782 |
| 27. | Mineral Point | 13.0 | 52.0(-39.0)#27 | 53.0(-40.0)#832 |
| 28. | Ixonia | 13.0 | 52.0(-39.0)#28 | 53.0(-40.0)#841 |
| 29. | Pardeeville | 13.0 | 52.0(-39.0)#29 | 53.0(-40.0)#846 |
| 30. | Hilbert | 13.0 | 52.0(-39.0)#30 | 53.0(-40.0)#866 |
| 31. | Hollandale | 13.0 | 52.0(-39.0)#31 | 53.0(-40.0)#905 |
| 32. | Mcfarland | 14.0 | 52.0(-38.0)#32 | 53.0(-39.0)#932 |
| 33. | North Prairie | 14.0 | 52.0(-38.0)#33 | 53.0(-39.0)#971 |
| 34. | Montello | 14.0 | 52.0(-38.0)#34 | 53.0(-39.0)#997 |
| 35. | Endeavor | 14.0 | 52.0(-38.0)#35 | 53.0(-39.0)#1,042 |
| 36. | Junction City | 14.0 | 52.0(-38.0)#36 | 53.0(-39.0)#1,061 |
| 37. | Haugen | 14.0 | 52.0(-38.0)#37 | 53.0(-39.0)#1,062 |
| 38. | Mount Hope | 14.0 | 52.0(-38.0)#38 | 53.0(-39.0)#1,065 |
| 39. | Reedsburg | 15.0 | 52.0(-37.0)#39 | 53.0(-38.0)#1,083 |
| 40. | Twin Lakes | 15.0 | 52.0(-37.0)#40 | 53.0(-38.0)#1,098 |
| 41. | Waterford | 15.0 | 52.0(-37.0)#41 | 53.0(-38.0)#1,104 |
| 42. | Tainter Lake | 15.0 | 52.0(-37.0)#42 | 53.0(-38.0)#1,140 |
| 43. | Forest Junction | 15.0 | 52.0(-37.0)#43 | 53.0(-38.0)#1,193 |
| 44. | Jefferson | 16.0 | 52.0(-36.0)#44 | 53.0(-37.0)#1,247 |
| 45. | Lake Mills | 16.0 | 52.0(-36.0)#45 | 53.0(-37.0)#1,256 |
| 46. | Wonewoc | 16.0 | 52.0(-36.0)#46 | 53.0(-37.0)#1,353 |
| 47. | Viola | 16.0 | 52.0(-36.0)#47 | 53.0(-37.0)#1,362 |
| 48. | Jackson | 17.0 | 52.0(-35.0)#48 | 53.0(-36.0)#1,418 |
| 49. | Montreal | 17.0 | 52.0(-35.0)#49 | 53.0(-36.0)#1,509 |
| 50. | Bayfield | 17.0 | 52.0(-35.0)#50 | 53.0(-36.0)#1,520 |
| 51. | Genoa | 17.0 | 52.0(-35.0)#51 | 53.0(-36.0)#1,551 |
| 52. | Rewey | 17.0 | 52.0(-35.0)#52 | 53.0(-36.0)#1,552 |
| 53. | Chetek | 18.0 | 52.0(-34.0)#53 | 53.0(-35.0)#1,637 |
| 54. | Barneveld | 18.0 | 52.0(-34.0)#54 | 53.0(-35.0)#1,666 |
| 55. | Cambridge | 18.0 | 52.0(-34.0)#55 | 53.0(-35.0)#1,668 |
| 56. | Almena | 18.0 | 52.0(-34.0)#56 | 53.0(-35.0)#1,703 |
| 57. | Blue River | 18.0 | 52.0(-34.0)#57 | 53.0(-35.0)#1,720 |
| 58. | Hawkins | 18.0 | 52.0(-34.0)#58 | 53.0(-35.0)#1,728 |
| 59. | Abbotsford | 19.0 | 52.0(-33.0)#59 | 53.0(-34.0)#1,815 |
| 60. | Lake Nebagamon | 19.0 | 52.0(-33.0)#60 | 53.0(-34.0)#1,848 |
| 61. | Kingston | 19.0 | 52.0(-33.0)#61 | 53.0(-34.0)#1,894 |
| 62. | Greendale | 20.0 | 52.0(-32.0)#62 | 53.0(-33.0)#1,919 |
| 63. | West Salem | 20.0 | 52.0(-32.0)#63 | 53.0(-33.0)#1,951 |
| 64. | Elmwood Park | 20.0 | 52.0(-32.0)#64 | 53.0(-33.0)#2,050 |
| 65. | Tomah | 21.0 | 52.0(-31.0)#65 | 53.0(-32.0)#2,103 |
| 66. | St Croix Falls | 21.0 | 52.0(-31.0)#66 | 53.0(-32.0)#2,143 |
| 67. | Gillett | 21.0 | 52.0(-31.0)#67 | 53.0(-32.0)#2,176 |
| 68. | Sister Bay | 21.0 | 52.0(-31.0)#68 | 53.0(-32.0)#2,195 |
| 69. | Cobb | 21.0 | 52.0(-31.0)#69 | 53.0(-32.0)#2,232 |
| 70. | Westboro | 21.0 | 52.0(-31.0)#70 | 53.0(-32.0)#2,242 |
| 71. | Somerset | 22.0 | 52.0(-30.0)#71 | 53.0(-31.0)#2,319 |
| 72. | Park Falls | 22.0 | 52.0(-30.0)#72 | 53.0(-31.0)#2,335 |
| 73. | Campbellsport | 22.0 | 52.0(-30.0)#73 | 53.0(-31.0)#2,348 |
| 74. | Rosendale | 22.0 | 52.0(-30.0)#74 | 53.0(-31.0)#2,384 |
| 75. | Lake Koshkonong | 22.0 | 52.0(-30.0)#75 | 53.0(-31.0)#2,385 |
| 76. | St Cloud | 22.0 | 52.0(-30.0)#76 | 53.0(-31.0)#2,417 |
| 77. | Scandinavia | 22.0 | 52.0(-30.0)#77 | 53.0(-31.0)#2,425 |
| 78. | East Troy | 23.0 | 52.0(-29.0)#78 | 53.0(-30.0)#2,519 |
| 79. | Shell Lake | 23.0 | 52.0(-29.0)#79 | 53.0(-30.0)#2,562 |
| 80. | Delavan Lake | 24.0 | 52.0(-28.0)#80 | 53.0(-29.0)#2,701 |
| 81. | New Glarus | 24.0 | 52.0(-28.0)#81 | 53.0(-29.0)#2,712 |
| 82. | Burnett | 24.0 | 52.0(-28.0)#82 | 53.0(-29.0)#2,823 |
| 83. | Ogdensburg | 24.0 | 52.0(-28.0)#83 | 53.0(-29.0)#2,835 |
| 84. | Waunakee | 25.0 | 52.0(-27.0)#84 | 53.0(-28.0)#2,861 |
| 85. | Ripon | 25.0 | 52.0(-27.0)#85 | 53.0(-28.0)#2,877 |
| 86. | Saukville | 25.0 | 52.0(-27.0)#86 | 53.0(-28.0)#2,898 |
| 87. | Raymond | 25.0 | 52.0(-27.0)#87 | 53.0(-28.0)#2,904 |
| 88. | Pulaski | 25.0 | 52.0(-27.0)#88 | 53.0(-28.0)#2,905 |
| 89. | Wind Point | 25.0 | 52.0(-27.0)#89 | 53.0(-28.0)#2,948 |
| 90. | Coon Valley | 25.0 | 52.0(-27.0)#90 | 53.0(-28.0)#2,986 |
| 91. | Arena | 25.0 | 52.0(-27.0)#91 | 53.0(-28.0)#2,991 |
| 92. | Fountain City | 25.0 | 52.0(-27.0)#92 | 53.0(-28.0)#2,999 |
| 93. | Hixton | 25.0 | 52.0(-27.0)#93 | 53.0(-28.0)#3,022 |
| 94. | Aniwa | 25.0 | 52.0(-27.0)#94 | 53.0(-28.0)#3,038 |
| 95. | Prairie Farm | 26.0 | 52.0(-26.0)#95 | 53.0(-27.0)#3,204 |
| 96. | Gilman | 26.0 | 52.0(-26.0)#96 | 53.0(-27.0)#3,207 |
| 97. | Ironton | 26.0 | 52.0(-26.0)#97 | 53.0(-27.0)#3,230 |
| 98. | Lake Wisconsin | 27.0 | 52.0(-25.0)#98 | 53.0(-26.0)#3,303 |
| 99. | Peshtigo | 27.0 | 52.0(-25.0)#99 | 53.0(-26.0)#3,319 |
| 100. | Rio | 27.0 | 52.0(-25.0)#100 | 53.0(-26.0)#3,381 |
Common Questions
What are the Top 10 Cities with the Fewest Births per 1,000 Women Below Poverty Level in Wisconsin?
Top 10 Cities with the Fewest Births per 1,000 Women Below Poverty Level in Wisconsin are:
#1
3.0
#2
4.0
#3
5.0
#4
6.0
#5
6.0
#6
7.0
#7
7.0
#8
7.0
#9
8.0
#10
8.0
What city has the Fewest Births per 1,000 Women Below Poverty Level in Wisconsin?
Marathon City has the Fewest Births per 1,000 Women Below Poverty Level in Wisconsin with 3.0.
What is the Number of Births per 1,000 Women Below Poverty Level in the State of Wisconsin?
Number of Births per 1,000 Women Below Poverty Level in Wisconsin is 52.0.
What is the Number of Births per 1,000 Women Below Poverty Level in the United States?
Number of Births per 1,000 Women Below Poverty Level in the United States is 53.0.