Cities with the Fewest Births per 1,000 Women Below Poverty Level in Massachusetts
RELATED REPORTS & OPTIONS
Lowest Birth Rate | Below Poverty
Massachusetts
Compare Cities
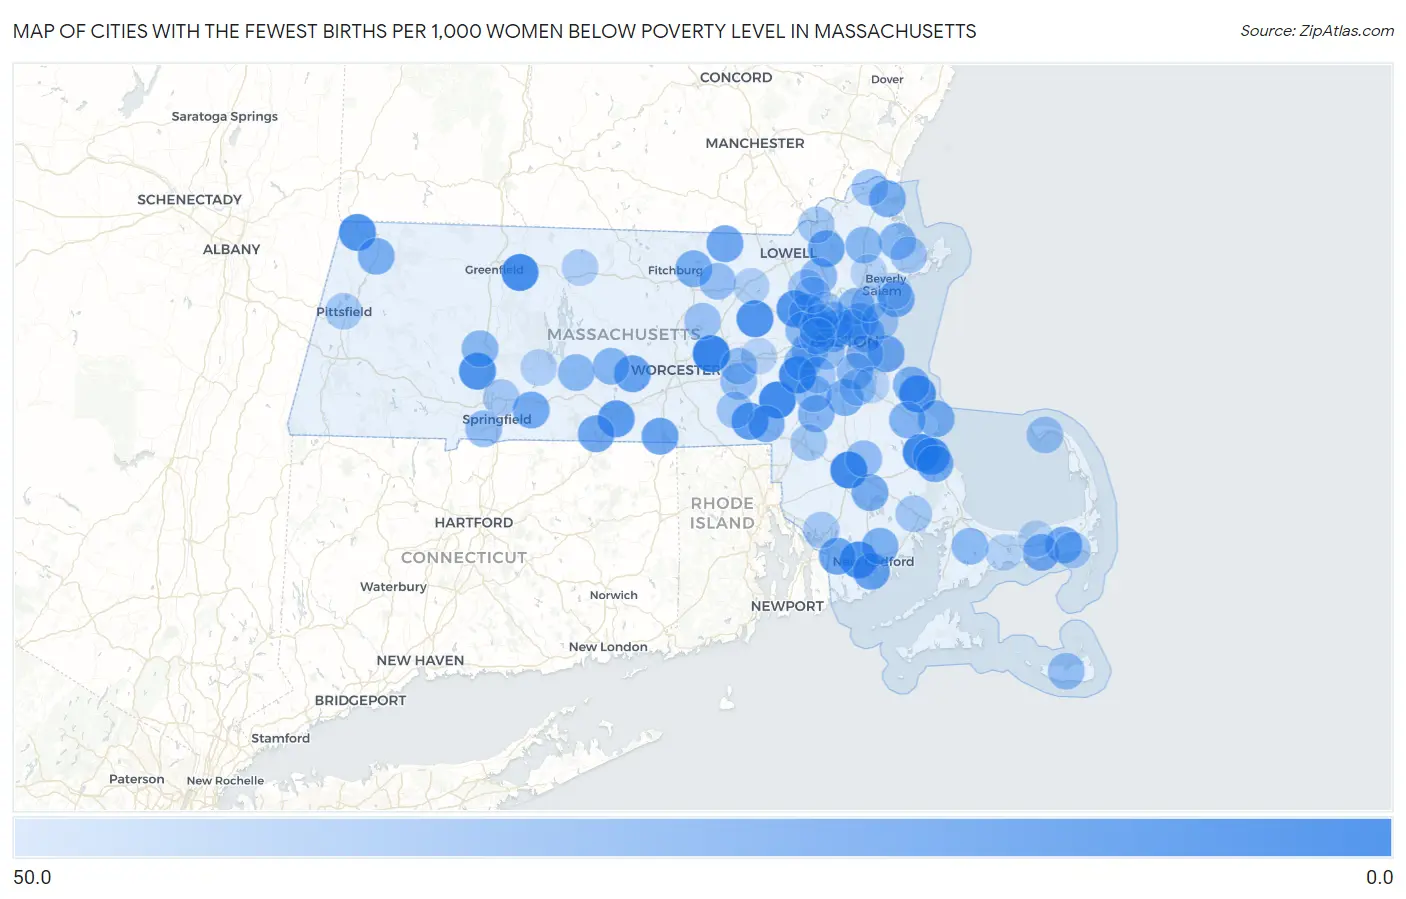
Map of Cities with the Fewest Births per 1,000 Women Below Poverty Level in Massachusetts
50.0
0.0
Cities with the Fewest Births per 1,000 Women Below Poverty Level in Massachusetts
| City | Births / 1,000 Women | vs State | vs National | |
| 1. | Northborough | 5.0 | 46.0(-41.0)#1 | 53.0(-48.0)#72 |
| 2. | Kingston | 8.0 | 46.0(-38.0)#2 | 53.0(-45.0)#260 |
| 3. | Raynham Center | 9.0 | 46.0(-37.0)#3 | 53.0(-44.0)#350 |
| 4. | Millis Clicquot | 9.0 | 46.0(-37.0)#4 | 53.0(-44.0)#354 |
| 5. | Dover | 9.0 | 46.0(-37.0)#5 | 53.0(-44.0)#373 |
| 6. | Millers Falls | 10.0 | 46.0(-36.0)#6 | 53.0(-43.0)#509 |
| 7. | Smith Mills | 11.0 | 46.0(-35.0)#7 | 53.0(-42.0)#576 |
| 8. | Maynard | 13.0 | 46.0(-33.0)#8 | 53.0(-40.0)#788 |
| 9. | Scituate | 13.0 | 46.0(-33.0)#9 | 53.0(-40.0)#804 |
| 10. | Easthampton Town | 14.0 | 46.0(-32.0)#10 | 53.0(-39.0)#925 |
| 11. | North Plymouth | 14.0 | 46.0(-32.0)#11 | 53.0(-39.0)#948 |
| 12. | Williamstown | 15.0 | 46.0(-31.0)#12 | 53.0(-38.0)#1,116 |
| 13. | Hanscom Afb | 15.0 | 46.0(-31.0)#13 | 53.0(-38.0)#1,156 |
| 14. | North Attleborough | 18.0 | 46.0(-28.0)#14 | 53.0(-35.0)#1,561 |
| 15. | Bellingham | 18.0 | 46.0(-28.0)#15 | 53.0(-35.0)#1,603 |
| 16. | Sturbridge | 18.0 | 46.0(-28.0)#16 | 53.0(-35.0)#1,638 |
| 17. | Spencer | 22.0 | 46.0(-24.0)#17 | 53.0(-31.0)#2,290 |
| 18. | Bliss Corner | 22.0 | 46.0(-24.0)#18 | 53.0(-31.0)#2,291 |
| 19. | Webster | 23.0 | 46.0(-23.0)#19 | 53.0(-30.0)#2,481 |
| 20. | Andover | 24.0 | 46.0(-22.0)#20 | 53.0(-29.0)#2,658 |
| 21. | North Westport | 24.0 | 46.0(-22.0)#21 | 53.0(-29.0)#2,684 |
| 22. | Marblehead | 25.0 | 46.0(-21.0)#22 | 53.0(-28.0)#2,854 |
| 23. | Hull | 25.0 | 46.0(-21.0)#23 | 53.0(-28.0)#2,870 |
| 24. | Pepperell | 25.0 | 46.0(-21.0)#24 | 53.0(-28.0)#2,931 |
| 25. | Holland | 25.0 | 46.0(-21.0)#25 | 53.0(-28.0)#2,957 |
| 26. | Plymouth | 26.0 | 46.0(-20.0)#26 | 53.0(-27.0)#3,095 |
| 27. | Northwest Harwich | 26.0 | 46.0(-20.0)#27 | 53.0(-27.0)#3,126 |
| 28. | Wilbraham | 27.0 | 46.0(-19.0)#28 | 53.0(-26.0)#3,313 |
| 29. | Amherst | 28.0 | 46.0(-18.0)#29 | 53.0(-25.0)#3,444 |
| 30. | Franklin Town | 28.0 | 46.0(-18.0)#30 | 53.0(-25.0)#3,445 |
| 31. | South Yarmouth | 28.0 | 46.0(-18.0)#31 | 53.0(-25.0)#3,469 |
| 32. | North Lakeville | 28.0 | 46.0(-18.0)#32 | 53.0(-25.0)#3,524 |
| 33. | Adams | 29.0 | 46.0(-17.0)#33 | 53.0(-24.0)#3,698 |
| 34. | Ocean Bluff Brant Rock | 29.0 | 46.0(-17.0)#34 | 53.0(-24.0)#3,713 |
| 35. | Lunenburg | 29.0 | 46.0(-17.0)#35 | 53.0(-24.0)#3,751 |
| 36. | Randolph Town | 30.0 | 46.0(-16.0)#36 | 53.0(-23.0)#3,870 |
| 37. | Lexington | 30.0 | 46.0(-16.0)#37 | 53.0(-23.0)#3,871 |
| 38. | Newburyport | 30.0 | 46.0(-16.0)#38 | 53.0(-23.0)#3,883 |
| 39. | Acushnet Center | 30.0 | 46.0(-16.0)#39 | 53.0(-23.0)#3,972 |
| 40. | Cambridge | 31.0 | 46.0(-15.0)#40 | 53.0(-22.0)#4,098 |
| 41. | Revere | 31.0 | 46.0(-15.0)#41 | 53.0(-22.0)#4,101 |
| 42. | Winthrop Town | 32.0 | 46.0(-14.0)#42 | 53.0(-21.0)#4,361 |
| 43. | North Scituate | 32.0 | 46.0(-14.0)#43 | 53.0(-21.0)#4,415 |
| 44. | North Pembroke | 32.0 | 46.0(-14.0)#44 | 53.0(-21.0)#4,433 |
| 45. | Somerville | 33.0 | 46.0(-13.0)#45 | 53.0(-20.0)#4,543 |
| 46. | Saugus | 33.0 | 46.0(-13.0)#46 | 53.0(-20.0)#4,562 |
| 47. | Sharon | 33.0 | 46.0(-13.0)#47 | 53.0(-20.0)#4,622 |
| 48. | North Brookfield | 33.0 | 46.0(-13.0)#48 | 53.0(-20.0)#4,660 |
| 49. | Newton | 34.0 | 46.0(-12.0)#49 | 53.0(-19.0)#4,791 |
| 50. | Northampton | 34.0 | 46.0(-12.0)#50 | 53.0(-19.0)#4,807 |
| 51. | Ware | 34.0 | 46.0(-12.0)#51 | 53.0(-19.0)#4,872 |
| 52. | Ipswich | 34.0 | 46.0(-12.0)#52 | 53.0(-19.0)#4,887 |
| 53. | Boxford | 34.0 | 46.0(-12.0)#53 | 53.0(-19.0)#4,923 |
| 54. | Needham | 35.0 | 46.0(-11.0)#54 | 53.0(-18.0)#5,053 |
| 55. | Forestdale | 35.0 | 46.0(-11.0)#55 | 53.0(-18.0)#5,138 |
| 56. | Boston | 36.0 | 46.0(-10.00)#56 | 53.0(-17.0)#5,251 |
| 57. | Quincy | 36.0 | 46.0(-10.00)#57 | 53.0(-17.0)#5,255 |
| 58. | Waltham | 36.0 | 46.0(-10.00)#58 | 53.0(-17.0)#5,261 |
| 59. | Wilmington | 36.0 | 46.0(-10.00)#59 | 53.0(-17.0)#5,275 |
| 60. | Norwood | 37.0 | 46.0(-9.00)#60 | 53.0(-16.0)#5,518 |
| 61. | Agawam Town | 37.0 | 46.0(-9.00)#61 | 53.0(-16.0)#5,521 |
| 62. | Bridgewater Town | 38.0 | 46.0(-8.00)#62 | 53.0(-15.0)#5,762 |
| 63. | Belmont | 38.0 | 46.0(-8.00)#63 | 53.0(-15.0)#5,765 |
| 64. | Hopkinton | 38.0 | 46.0(-8.00)#64 | 53.0(-15.0)#5,856 |
| 65. | Devens | 38.0 | 46.0(-8.00)#65 | 53.0(-15.0)#5,901 |
| 66. | Brookline | 39.0 | 46.0(-7.00)#66 | 53.0(-14.0)#6,013 |
| 67. | Medford | 39.0 | 46.0(-7.00)#67 | 53.0(-14.0)#6,014 |
| 68. | Chelsea | 39.0 | 46.0(-7.00)#68 | 53.0(-14.0)#6,021 |
| 69. | Nantucket | 39.0 | 46.0(-7.00)#69 | 53.0(-14.0)#6,070 |
| 70. | Cordaville | 39.0 | 46.0(-7.00)#70 | 53.0(-14.0)#6,119 |
| 71. | Clinton | 40.0 | 46.0(-6.00)#71 | 53.0(-13.0)#6,298 |
| 72. | Provincetown | 40.0 | 46.0(-6.00)#72 | 53.0(-13.0)#6,332 |
| 73. | Amesbury Town | 41.0 | 46.0(-5.00)#73 | 53.0(-12.0)#6,521 |
| 74. | Hopedale | 41.0 | 46.0(-5.00)#74 | 53.0(-12.0)#6,593 |
| 75. | Essex | 42.0 | 46.0(-4.00)#75 | 53.0(-11.0)#6,864 |
| 76. | Methuen Town | 43.0 | 46.0(-3.00)#76 | 53.0(-10.00)#6,970 |
| 77. | Mansfield Center | 43.0 | 46.0(-3.00)#77 | 53.0(-10.00)#7,036 |
| 78. | Pinehurst | 43.0 | 46.0(-3.00)#78 | 53.0(-10.00)#7,047 |
| 79. | Nahant | 43.0 | 46.0(-3.00)#79 | 53.0(-10.00)#7,075 |
| 80. | West Wareham | 43.0 | 46.0(-3.00)#80 | 53.0(-10.00)#7,092 |
| 81. | Chicopee | 44.0 | 46.0(-2.00)#81 | 53.0(-9.00)#7,241 |
| 82. | Braintree Town | 44.0 | 46.0(-2.00)#82 | 53.0(-9.00)#7,250 |
| 83. | Dedham | 44.0 | 46.0(-2.00)#83 | 53.0(-9.00)#7,269 |
| 84. | Winchester | 44.0 | 46.0(-2.00)#84 | 53.0(-9.00)#7,273 |
| 85. | Pittsfield | 45.0 | 46.0(-1.000)#85 | 53.0(-8.00)#7,481 |
| 86. | Somerset | 45.0 | 46.0(-1.000)#86 | 53.0(-8.00)#7,513 |
| 87. | Harwich Port | 45.0 | 46.0(-1.000)#87 | 53.0(-8.00)#7,607 |
| 88. | Arlington | 47.0 | 46.0(+1.000)#88 | 53.0(-6.00)#7,957 |
| 89. | Athol | 47.0 | 46.0(+1.000)#89 | 53.0(-6.00)#8,013 |
| 90. | Burlington | 48.0 | 46.0(+2.00)#90 | 53.0(-5.00)#8,199 |
| 91. | Littleton Common | 48.0 | 46.0(+2.00)#91 | 53.0(-5.00)#8,312 |
| 92. | Belchertown | 48.0 | 46.0(+2.00)#92 | 53.0(-5.00)#8,316 |
| 93. | Barnstable Town | 49.0 | 46.0(+3.00)#93 | 53.0(-4.00)#8,453 |
| 94. | Watertown Town | 49.0 | 46.0(+3.00)#94 | 53.0(-4.00)#8,463 |
| 95. | Yarmouth Port | 49.0 | 46.0(+3.00)#95 | 53.0(-4.00)#8,534 |
| 96. | Lynn | 50.0 | 46.0(+4.00)#96 | 53.0(-3.00)#8,663 |
| 97. | Framingham | 50.0 | 46.0(+4.00)#97 | 53.0(-3.00)#8,671 |
| 98. | Weymouth Town | 50.0 | 46.0(+4.00)#98 | 53.0(-3.00)#8,677 |
| 99. | Salem | 50.0 | 46.0(+4.00)#99 | 53.0(-3.00)#8,684 |
| 100. | Danvers | 50.0 | 46.0(+4.00)#100 | 53.0(-3.00)#8,698 |
1
2Common Questions
What are the Top 10 Cities with the Fewest Births per 1,000 Women Below Poverty Level in Massachusetts?
Top 10 Cities with the Fewest Births per 1,000 Women Below Poverty Level in Massachusetts are:
#1
5.0
#2
8.0
#3
9.0
#4
9.0
#5
9.0
#6
10.0
#7
11.0
#8
13.0
#9
13.0
#10
14.0
What city has the Fewest Births per 1,000 Women Below Poverty Level in Massachusetts?
Northborough has the Fewest Births per 1,000 Women Below Poverty Level in Massachusetts with 5.0.
What is the Number of Births per 1,000 Women Below Poverty Level in the State of Massachusetts?
Number of Births per 1,000 Women Below Poverty Level in Massachusetts is 46.0.
What is the Number of Births per 1,000 Women Below Poverty Level in the United States?
Number of Births per 1,000 Women Below Poverty Level in the United States is 53.0.