Cities with the Fewest Births per 1,000 Women Below Poverty Level in West Virginia
RELATED REPORTS & OPTIONS
Lowest Birth Rate | Below Poverty
West Virginia
Compare Cities
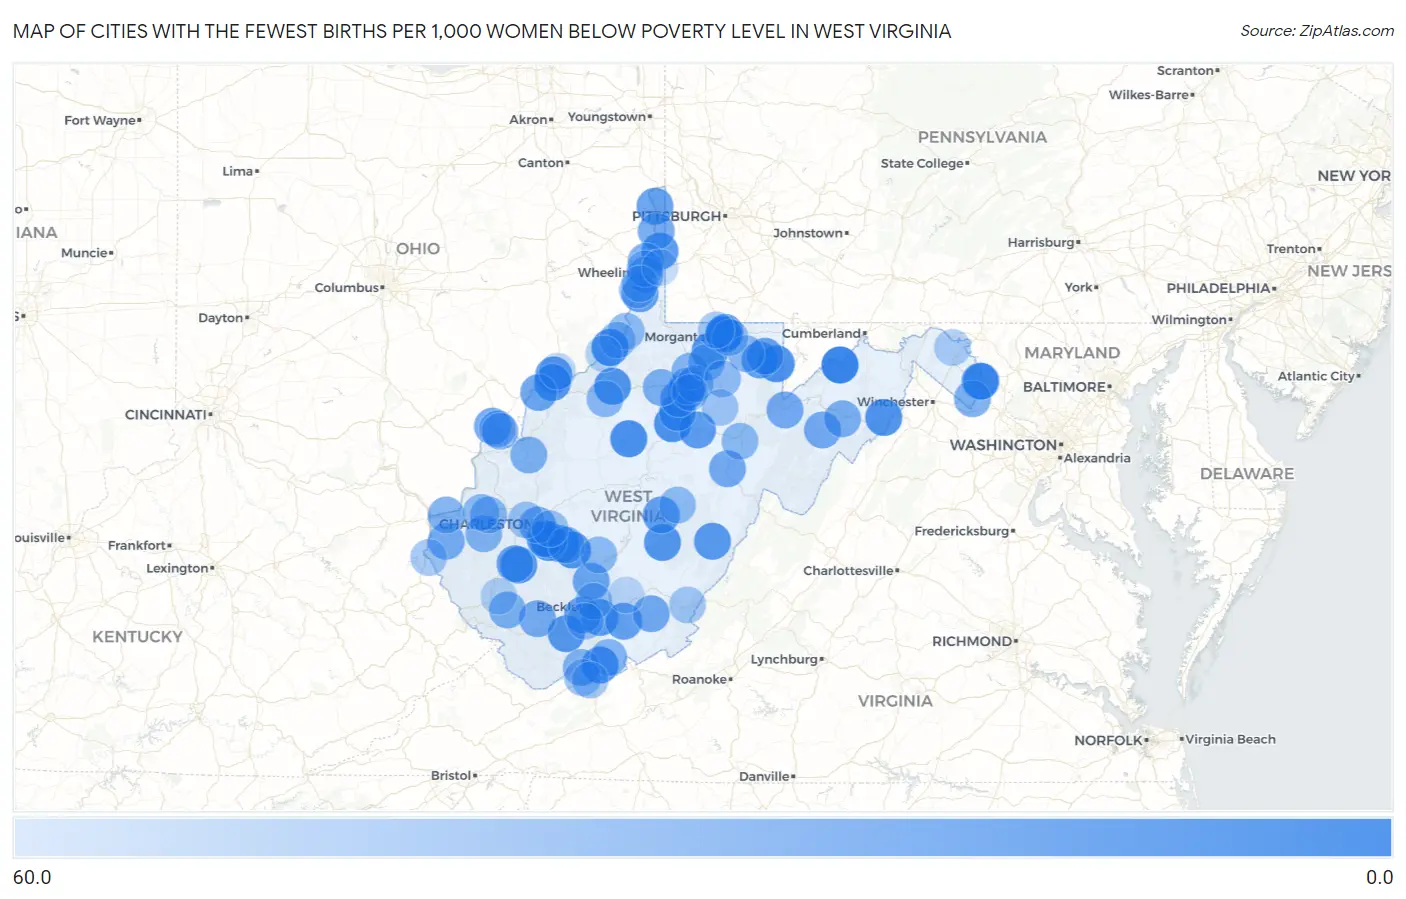
Map of Cities with the Fewest Births per 1,000 Women Below Poverty Level in West Virginia
60.0
0.0
Cities with the Fewest Births per 1,000 Women Below Poverty Level in West Virginia
| City | Births / 1,000 Women | vs State | vs National | |
| 1. | Keyser | 1.0 | 50.0(-49.0)#1 | 53.0(-52.0)#3 |
| 2. | Sistersville | 8.0 | 50.0(-42.0)#2 | 53.0(-45.0)#308 |
| 3. | Bolivar | 9.0 | 50.0(-41.0)#3 | 53.0(-44.0)#394 |
| 4. | Glenville | 9.0 | 50.0(-41.0)#4 | 53.0(-44.0)#398 |
| 5. | East Bank | 9.0 | 50.0(-41.0)#5 | 53.0(-44.0)#410 |
| 6. | Weston | 10.0 | 50.0(-40.0)#6 | 53.0(-43.0)#457 |
| 7. | Star City | 10.0 | 50.0(-40.0)#7 | 53.0(-43.0)#477 |
| 8. | Terra Alta | 10.0 | 50.0(-40.0)#8 | 53.0(-43.0)#480 |
| 9. | Montgomery | 11.0 | 50.0(-39.0)#9 | 53.0(-42.0)#606 |
| 10. | Pennsboro | 11.0 | 50.0(-39.0)#10 | 53.0(-42.0)#614 |
| 11. | Wardensville | 11.0 | 50.0(-39.0)#11 | 53.0(-42.0)#650 |
| 12. | Princeton | 12.0 | 50.0(-38.0)#12 | 53.0(-41.0)#673 |
| 13. | Madison | 12.0 | 50.0(-38.0)#13 | 53.0(-41.0)#699 |
| 14. | Richwood | 13.0 | 50.0(-37.0)#14 | 53.0(-40.0)#833 |
| 15. | Chesapeake | 13.0 | 50.0(-37.0)#15 | 53.0(-40.0)#849 |
| 16. | Rivesville | 13.0 | 50.0(-37.0)#16 | 53.0(-40.0)#888 |
| 17. | Mullens | 14.0 | 50.0(-36.0)#17 | 53.0(-39.0)#974 |
| 18. | Nutter Fort | 14.0 | 50.0(-36.0)#18 | 53.0(-39.0)#988 |
| 19. | Boaz | 14.0 | 50.0(-36.0)#19 | 53.0(-39.0)#998 |
| 20. | Bethany | 14.0 | 50.0(-36.0)#20 | 53.0(-39.0)#1,011 |
| 21. | Marlinton | 15.0 | 50.0(-35.0)#21 | 53.0(-38.0)#1,172 |
| 22. | North Hills | 15.0 | 50.0(-35.0)#22 | 53.0(-38.0)#1,179 |
| 23. | Shady Spring | 16.0 | 50.0(-34.0)#23 | 53.0(-37.0)#1,276 |
| 24. | Buckhannon | 17.0 | 50.0(-33.0)#24 | 53.0(-36.0)#1,434 |
| 25. | Belle | 17.0 | 50.0(-33.0)#25 | 53.0(-36.0)#1,489 |
| 26. | Jane Lew | 17.0 | 50.0(-33.0)#26 | 53.0(-36.0)#1,521 |
| 27. | Marmet | 18.0 | 50.0(-32.0)#27 | 53.0(-35.0)#1,659 |
| 28. | Moundsville | 19.0 | 50.0(-31.0)#28 | 53.0(-34.0)#1,765 |
| 29. | Cowen | 19.0 | 50.0(-31.0)#29 | 53.0(-34.0)#1,875 |
| 30. | Kingwood | 20.0 | 50.0(-30.0)#30 | 53.0(-33.0)#1,977 |
| 31. | Sophia | 20.0 | 50.0(-30.0)#31 | 53.0(-33.0)#2,006 |
| 32. | Hinton | 21.0 | 50.0(-29.0)#32 | 53.0(-32.0)#2,146 |
| 33. | West Milford | 21.0 | 50.0(-29.0)#33 | 53.0(-32.0)#2,226 |
| 34. | New Cumberland | 22.0 | 50.0(-28.0)#34 | 53.0(-31.0)#2,379 |
| 35. | Danville | 22.0 | 50.0(-28.0)#35 | 53.0(-31.0)#2,398 |
| 36. | Albright | 22.0 | 50.0(-28.0)#36 | 53.0(-31.0)#2,431 |
| 37. | Westover | 23.0 | 50.0(-27.0)#37 | 53.0(-30.0)#2,524 |
| 38. | Blennerhassett | 24.0 | 50.0(-26.0)#38 | 53.0(-29.0)#2,692 |
| 39. | Scarbro | 24.0 | 50.0(-26.0)#39 | 53.0(-29.0)#2,827 |
| 40. | Clarksburg | 26.0 | 50.0(-24.0)#40 | 53.0(-27.0)#3,070 |
| 41. | Alderson | 26.0 | 50.0(-24.0)#41 | 53.0(-27.0)#3,184 |
| 42. | Petersburg | 27.0 | 50.0(-23.0)#42 | 53.0(-26.0)#3,332 |
| 43. | Davis | 27.0 | 50.0(-23.0)#43 | 53.0(-26.0)#3,387 |
| 44. | Mason | 27.0 | 50.0(-23.0)#44 | 53.0(-26.0)#3,388 |
| 45. | Mill Creek | 27.0 | 50.0(-23.0)#45 | 53.0(-26.0)#3,393 |
| 46. | Charleston | 28.0 | 50.0(-22.0)#46 | 53.0(-25.0)#3,437 |
| 47. | Follansbee | 29.0 | 50.0(-21.0)#47 | 53.0(-24.0)#3,740 |
| 48. | Wayne | 29.0 | 50.0(-21.0)#48 | 53.0(-24.0)#3,777 |
| 49. | Oceana | 29.0 | 50.0(-21.0)#49 | 53.0(-24.0)#3,782 |
| 50. | Moorefield | 30.0 | 50.0(-20.0)#50 | 53.0(-23.0)#3,982 |
| 51. | Salem | 30.0 | 50.0(-20.0)#51 | 53.0(-23.0)#4,007 |
| 52. | Shannondale | 31.0 | 50.0(-19.0)#52 | 53.0(-22.0)#4,208 |
| 53. | Ripley | 31.0 | 50.0(-19.0)#53 | 53.0(-22.0)#4,212 |
| 54. | Man | 31.0 | 50.0(-19.0)#54 | 53.0(-22.0)#4,268 |
| 55. | Clearview | 31.0 | 50.0(-19.0)#55 | 53.0(-22.0)#4,295 |
| 56. | Huntington | 32.0 | 50.0(-18.0)#56 | 53.0(-21.0)#4,338 |
| 57. | Hartford City | 33.0 | 50.0(-17.0)#57 | 53.0(-20.0)#4,738 |
| 58. | Bethlehem | 34.0 | 50.0(-16.0)#58 | 53.0(-19.0)#4,930 |
| 59. | Shinnston | 34.0 | 50.0(-16.0)#59 | 53.0(-19.0)#4,937 |
| 60. | Hamlin | 34.0 | 50.0(-16.0)#60 | 53.0(-19.0)#4,962 |
| 61. | Montcalm | 34.0 | 50.0(-16.0)#61 | 53.0(-19.0)#4,999 |
| 62. | Bridgeport | 35.0 | 50.0(-15.0)#62 | 53.0(-18.0)#5,096 |
| 63. | Culloden | 35.0 | 50.0(-15.0)#63 | 53.0(-18.0)#5,148 |
| 64. | Athens | 35.0 | 50.0(-15.0)#64 | 53.0(-18.0)#5,202 |
| 65. | Pratt | 36.0 | 50.0(-14.0)#65 | 53.0(-17.0)#5,470 |
| 66. | Harrisville | 37.0 | 50.0(-13.0)#66 | 53.0(-16.0)#5,659 |
| 67. | Granville | 37.0 | 50.0(-13.0)#67 | 53.0(-16.0)#5,666 |
| 68. | Reedsville | 37.0 | 50.0(-13.0)#68 | 53.0(-16.0)#5,702 |
| 69. | Elkins | 38.0 | 50.0(-12.0)#69 | 53.0(-15.0)#5,822 |
| 70. | Pleasant Valley | 38.0 | 50.0(-12.0)#70 | 53.0(-15.0)#5,852 |
| 71. | New Martinsville | 39.0 | 50.0(-11.0)#71 | 53.0(-14.0)#6,097 |
| 72. | Milton | 39.0 | 50.0(-11.0)#72 | 53.0(-14.0)#6,121 |
| 73. | Ansted | 39.0 | 50.0(-11.0)#73 | 53.0(-14.0)#6,163 |
| 74. | Addison Webster Springs | 39.0 | 50.0(-11.0)#74 | 53.0(-14.0)#6,175 |
| 75. | Grafton | 41.0 | 50.0(-9.00)#75 | 53.0(-12.0)#6,583 |
| 76. | New Haven | 41.0 | 50.0(-9.00)#76 | 53.0(-12.0)#6,631 |
| 77. | Stanaford | 42.0 | 50.0(-8.00)#77 | 53.0(-11.0)#6,883 |
| 78. | Harpers Ferry | 42.0 | 50.0(-8.00)#78 | 53.0(-11.0)#6,938 |
| 79. | Paden City | 43.0 | 50.0(-7.00)#79 | 53.0(-10.00)#7,087 |
| 80. | Glen Dale | 43.0 | 50.0(-7.00)#80 | 53.0(-10.00)#7,111 |
| 81. | Brush Fork | 43.0 | 50.0(-7.00)#81 | 53.0(-10.00)#7,130 |
| 82. | Morgantown | 44.0 | 50.0(-6.00)#82 | 53.0(-9.00)#7,262 |
| 83. | Wheeling | 44.0 | 50.0(-6.00)#83 | 53.0(-9.00)#7,267 |
| 84. | Dunbar | 44.0 | 50.0(-6.00)#84 | 53.0(-9.00)#7,309 |
| 85. | Mcmechen | 44.0 | 50.0(-6.00)#85 | 53.0(-9.00)#7,379 |
| 86. | Coal Fork | 44.0 | 50.0(-6.00)#86 | 53.0(-9.00)#7,394 |
| 87. | Coal City | 45.0 | 50.0(-5.00)#87 | 53.0(-8.00)#7,633 |
| 88. | Hinkleville | 45.0 | 50.0(-5.00)#88 | 53.0(-8.00)#7,676 |
| 89. | Philippi | 46.0 | 50.0(-4.00)#89 | 53.0(-7.00)#7,841 |
| 90. | Bluefield | 47.0 | 50.0(-3.00)#90 | 53.0(-6.00)#8,010 |
| 91. | White Sulphur Springs | 47.0 | 50.0(-3.00)#91 | 53.0(-6.00)#8,068 |
| 92. | Fort Gay | 47.0 | 50.0(-3.00)#92 | 53.0(-6.00)#8,135 |
| 93. | Stonewood | 48.0 | 50.0(-2.00)#93 | 53.0(-5.00)#8,324 |
| 94. | Cassville | 48.0 | 50.0(-2.00)#94 | 53.0(-5.00)#8,345 |
| 95. | Hedgesville | 51.0 | 50.0(+1.000)#95 | 53.0(-2.00)#9,128 |
| 96. | Friendly | 53.0 | 50.0(+3.00)#96 | 53.0(=0.000)#9,599 |
| 97. | Logan | 54.0 | 50.0(+4.00)#97 | 53.0(+1.000)#9,758 |
| 98. | Williamstown | 56.0 | 50.0(+6.00)#98 | 53.0(+3.00)#10,209 |
| 99. | Meadow Bridge | 58.0 | 50.0(+8.00)#99 | 53.0(+5.00)#10,682 |
| 100. | Valley Grove | 58.0 | 50.0(+8.00)#100 | 53.0(+5.00)#10,684 |
Common Questions
What are the Top 10 Cities with the Fewest Births per 1,000 Women Below Poverty Level in West Virginia?
Top 10 Cities with the Fewest Births per 1,000 Women Below Poverty Level in West Virginia are:
#1
1.0
#2
8.0
#3
9.0
#4
9.0
#5
9.0
#6
10.0
#7
10.0
#8
10.0
#9
11.0
#10
11.0
What city has the Fewest Births per 1,000 Women Below Poverty Level in West Virginia?
Keyser has the Fewest Births per 1,000 Women Below Poverty Level in West Virginia with 1.0.
What is the Number of Births per 1,000 Women Below Poverty Level in the State of West Virginia?
Number of Births per 1,000 Women Below Poverty Level in West Virginia is 50.0.
What is the Number of Births per 1,000 Women Below Poverty Level in the United States?
Number of Births per 1,000 Women Below Poverty Level in the United States is 53.0.