Cities with the Fewest Births per 1,000 Women Below Poverty Level in Connecticut
RELATED REPORTS & OPTIONS
Lowest Birth Rate | Below Poverty
Connecticut
Compare Cities
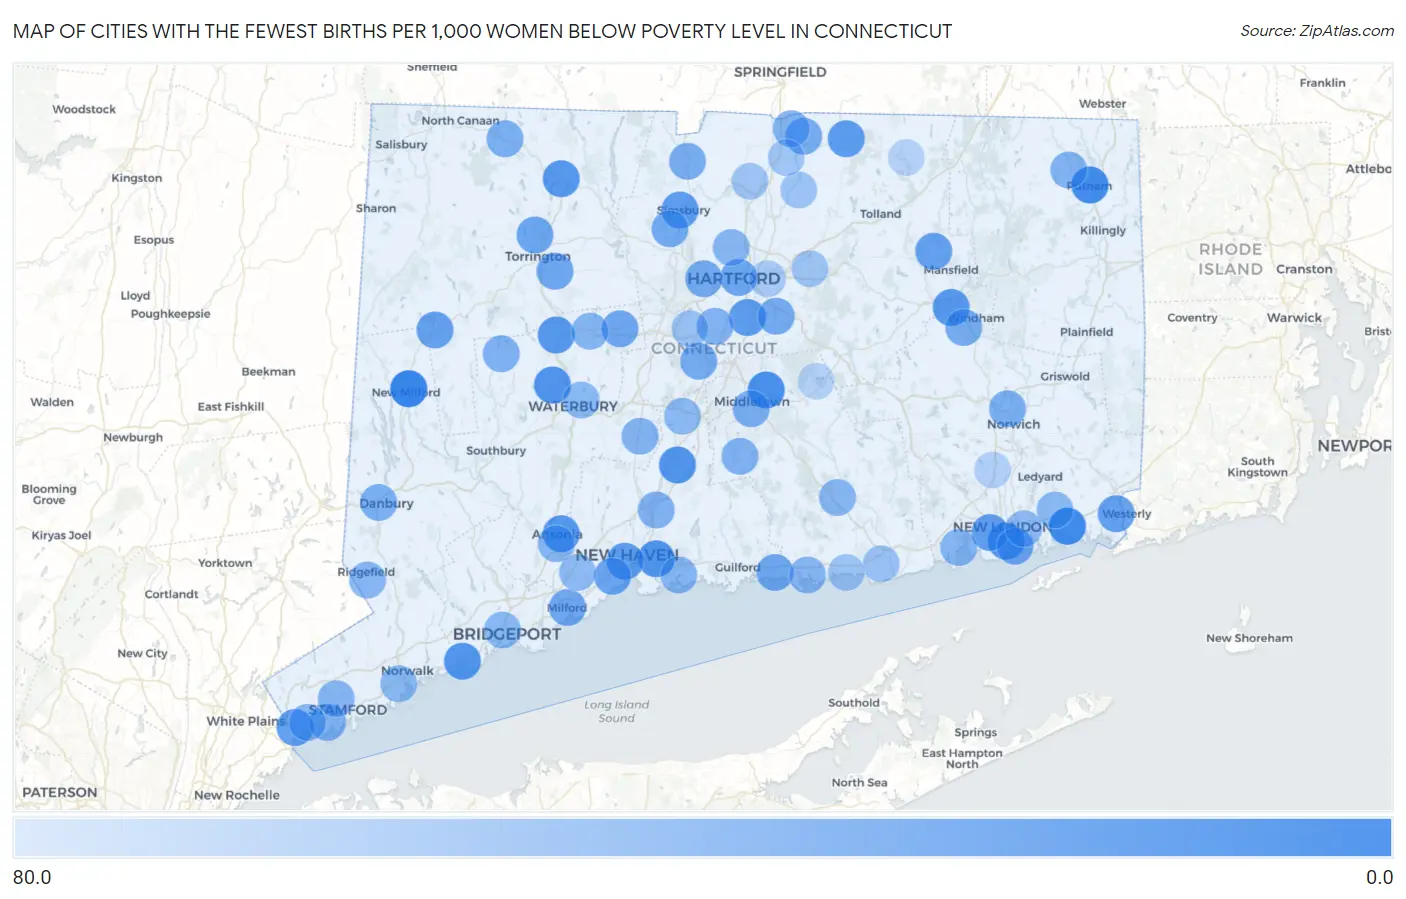
Map of Cities with the Fewest Births per 1,000 Women Below Poverty Level in Connecticut
80.0
0.0
Cities with the Fewest Births per 1,000 Women Below Poverty Level in Connecticut
| City | Births / 1,000 Women | vs State | vs National | |
| 1. | New Milford | 2.0 | 45.0(-43.0)#1 | 53.0(-51.0)#9 |
| 2. | Putnam | 8.0 | 45.0(-37.0)#2 | 53.0(-45.0)#257 |
| 3. | Mystic | 9.0 | 45.0(-36.0)#3 | 53.0(-44.0)#357 |
| 4. | Daniels Farm | 11.0 | 45.0(-34.0)#4 | 53.0(-42.0)#565 |
| 5. | Portland | 13.0 | 45.0(-32.0)#5 | 53.0(-40.0)#801 |
| 6. | Taylor Corners | 13.0 | 45.0(-32.0)#6 | 53.0(-40.0)#896 |
| 7. | Sandy Hook | 16.0 | 45.0(-29.0)#7 | 53.0(-37.0)#1,239 |
| 8. | Oakville | 16.0 | 45.0(-29.0)#8 | 53.0(-37.0)#1,240 |
| 9. | East Haven | 17.0 | 45.0(-28.0)#9 | 53.0(-36.0)#1,403 |
| 10. | Wallingford Center | 17.0 | 45.0(-28.0)#10 | 53.0(-36.0)#1,408 |
| 11. | New London | 19.0 | 45.0(-26.0)#11 | 53.0(-34.0)#1,742 |
| 12. | Southport | 19.0 | 45.0(-26.0)#12 | 53.0(-34.0)#1,826 |
| 13. | Ansonia | 20.0 | 45.0(-25.0)#13 | 53.0(-33.0)#1,915 |
| 14. | Lordship | 20.0 | 45.0(-25.0)#14 | 53.0(-33.0)#1,964 |
| 15. | Thomaston | 21.0 | 45.0(-24.0)#15 | 53.0(-32.0)#2,150 |
| 16. | Willimantic | 22.0 | 45.0(-23.0)#16 | 53.0(-31.0)#2,261 |
| 17. | Winsted | 22.0 | 45.0(-23.0)#17 | 53.0(-31.0)#2,282 |
| 18. | Danielson Borough | 23.0 | 45.0(-22.0)#18 | 53.0(-30.0)#2,521 |
| 19. | Pemberwick | 24.0 | 45.0(-21.0)#19 | 53.0(-29.0)#2,696 |
| 20. | Somers | 24.0 | 45.0(-21.0)#20 | 53.0(-29.0)#2,716 |
| 21. | New Haven | 26.0 | 45.0(-19.0)#21 | 53.0(-27.0)#3,042 |
| 22. | Wethersfield | 26.0 | 45.0(-19.0)#22 | 53.0(-27.0)#3,056 |
| 23. | Simsbury Center | 26.0 | 45.0(-19.0)#23 | 53.0(-27.0)#3,107 |
| 24. | Jewett City Borough | 27.0 | 45.0(-18.0)#24 | 53.0(-26.0)#3,318 |
| 25. | Waterford | 27.0 | 45.0(-18.0)#25 | 53.0(-26.0)#3,322 |
| 26. | Ball Pond | 27.0 | 45.0(-18.0)#26 | 53.0(-26.0)#3,338 |
| 27. | Storrs | 29.0 | 45.0(-16.0)#27 | 53.0(-24.0)#3,654 |
| 28. | Pawcatuck | 29.0 | 45.0(-16.0)#28 | 53.0(-24.0)#3,701 |
| 29. | Staples | 30.0 | 45.0(-15.0)#29 | 53.0(-23.0)#3,930 |
| 30. | Woodmont Borough | 31.0 | 45.0(-14.0)#30 | 53.0(-22.0)#4,251 |
| 31. | New Preston | 31.0 | 45.0(-14.0)#31 | 53.0(-22.0)#4,274 |
| 32. | Stratford Downtown | 32.0 | 45.0(-13.0)#32 | 53.0(-21.0)#4,459 |
| 33. | West Haven | 33.0 | 45.0(-12.0)#33 | 53.0(-20.0)#4,546 |
| 34. | Noroton Heights | 34.0 | 45.0(-11.0)#34 | 53.0(-19.0)#4,916 |
| 35. | Hartford | 35.0 | 45.0(-10.00)#35 | 53.0(-18.0)#5,037 |
| 36. | Torrington | 35.0 | 45.0(-10.00)#36 | 53.0(-18.0)#5,050 |
| 37. | Bristol | 36.0 | 45.0(-9.00)#37 | 53.0(-17.0)#5,263 |
| 38. | Northwest Harwinton | 36.0 | 45.0(-9.00)#38 | 53.0(-17.0)#5,366 |
| 39. | Madison Center | 36.0 | 45.0(-9.00)#39 | 53.0(-17.0)#5,409 |
| 40. | Milford City Balance | 37.0 | 45.0(-8.00)#40 | 53.0(-16.0)#5,508 |
| 41. | Groton | 37.0 | 45.0(-8.00)#41 | 53.0(-16.0)#5,575 |
| 42. | New Canaan | 38.0 | 45.0(-7.00)#42 | 53.0(-15.0)#5,824 |
| 43. | Old Hill | 38.0 | 45.0(-7.00)#43 | 53.0(-15.0)#5,866 |
| 44. | West Hartford | 39.0 | 45.0(-6.00)#44 | 53.0(-14.0)#6,012 |
| 45. | Weatogue | 39.0 | 45.0(-6.00)#45 | 53.0(-14.0)#6,124 |
| 46. | Lakes West | 39.0 | 45.0(-6.00)#46 | 53.0(-14.0)#6,158 |
| 47. | Naugatuck Borough | 40.0 | 45.0(-5.00)#47 | 53.0(-13.0)#6,241 |
| 48. | Kensington | 40.0 | 45.0(-5.00)#48 | 53.0(-13.0)#6,286 |
| 49. | Glastonbury Center | 40.0 | 45.0(-5.00)#49 | 53.0(-13.0)#6,291 |
| 50. | Greens Farms | 40.0 | 45.0(-5.00)#50 | 53.0(-13.0)#6,338 |
| 51. | Hazardville | 41.0 | 45.0(-4.00)#51 | 53.0(-12.0)#6,576 |
| 52. | South Windham | 41.0 | 45.0(-4.00)#52 | 53.0(-12.0)#6,637 |
| 53. | Middletown | 42.0 | 45.0(-3.00)#53 | 53.0(-11.0)#6,730 |
| 54. | Salmon Brook | 42.0 | 45.0(-3.00)#54 | 53.0(-11.0)#6,852 |
| 55. | Danbury | 43.0 | 45.0(-2.00)#55 | 53.0(-10.00)#6,963 |
| 56. | Norwich | 43.0 | 45.0(-2.00)#56 | 53.0(-10.00)#6,974 |
| 57. | Norfolk | 43.0 | 45.0(-2.00)#57 | 53.0(-10.00)#7,152 |
| 58. | Riverside | 45.0 | 45.0(=0.000)#58 | 53.0(-8.00)#7,541 |
| 59. | North Haven | 46.0 | 45.0(+1.000)#59 | 53.0(-7.00)#7,753 |
| 60. | Bethlehem Village | 46.0 | 45.0(+1.000)#60 | 53.0(-7.00)#7,851 |
| 61. | Cheshire Village | 47.0 | 45.0(+2.00)#61 | 53.0(-6.00)#8,034 |
| 62. | Sherwood Manor | 47.0 | 45.0(+2.00)#62 | 53.0(-6.00)#8,035 |
| 63. | Durham | 47.0 | 45.0(+2.00)#63 | 53.0(-6.00)#8,059 |
| 64. | South Woodstock | 47.0 | 45.0(+2.00)#64 | 53.0(-6.00)#8,098 |
| 65. | Newington | 48.0 | 45.0(+3.00)#65 | 53.0(-5.00)#8,195 |
| 66. | Stamford | 50.0 | 45.0(+5.00)#66 | 53.0(-3.00)#8,659 |
| 67. | Branford Center | 50.0 | 45.0(+5.00)#67 | 53.0(-3.00)#8,768 |
| 68. | Terryville | 50.0 | 45.0(+5.00)#68 | 53.0(-3.00)#8,779 |
| 69. | Niantic | 50.0 | 45.0(+5.00)#69 | 53.0(-3.00)#8,802 |
| 70. | Greenwich | 51.0 | 45.0(+6.00)#70 | 53.0(-2.00)#8,980 |
| 71. | Clinton | 51.0 | 45.0(+6.00)#71 | 53.0(-2.00)#9,037 |
| 72. | Blue Hills | 51.0 | 45.0(+6.00)#72 | 53.0(-2.00)#9,053 |
| 73. | Derby | 52.0 | 45.0(+7.00)#73 | 53.0(-1.000)#9,202 |
| 74. | Ridgefield | 52.0 | 45.0(+7.00)#74 | 53.0(-1.000)#9,230 |
| 75. | Chester Center | 52.0 | 45.0(+7.00)#75 | 53.0(-1.000)#9,290 |
| 76. | Bridgeport | 53.0 | 45.0(+8.00)#76 | 53.0(=0.000)#9,366 |
| 77. | Norwalk | 53.0 | 45.0(+8.00)#77 | 53.0(=0.000)#9,374 |
| 78. | Old Mystic | 53.0 | 45.0(+8.00)#78 | 53.0(=0.000)#9,484 |
| 79. | Waterbury | 54.0 | 45.0(+9.00)#79 | 53.0(+1.000)#9,614 |
| 80. | Meriden | 54.0 | 45.0(+9.00)#80 | 53.0(+1.000)#9,625 |
| 81. | Orange | 56.0 | 45.0(+11.0)#81 | 53.0(+3.00)#10,139 |
| 82. | Newtown Borough | 56.0 | 45.0(+11.0)#82 | 53.0(+3.00)#10,238 |
| 83. | Long Hill | 57.0 | 45.0(+12.0)#83 | 53.0(+4.00)#10,415 |
| 84. | Mill Plain | 59.0 | 45.0(+14.0)#84 | 53.0(+6.00)#10,847 |
| 85. | East | 61.0 | 45.0(+16.0)#85 | 53.0(+8.00)#11,210 |
| 86. | Trumbull Center | 62.0 | 45.0(+17.0)#86 | 53.0(+9.00)#11,405 |
| 87. | New Britain | 63.0 | 45.0(+18.0)#87 | 53.0(+10.00)#11,505 |
| 88. | Old Saybrook Center | 63.0 | 45.0(+18.0)#88 | 53.0(+10.00)#11,625 |
| 89. | Indian Field | 63.0 | 45.0(+18.0)#89 | 53.0(+10.00)#11,695 |
| 90. | Westbrook Center | 64.0 | 45.0(+19.0)#90 | 53.0(+11.0)#11,870 |
| 91. | Broad Brook | 65.0 | 45.0(+20.0)#91 | 53.0(+12.0)#12,005 |
| 92. | Manchester | 66.0 | 45.0(+21.0)#92 | 53.0(+13.0)#12,121 |
| 93. | Windsor Locks | 66.0 | 45.0(+21.0)#93 | 53.0(+13.0)#12,152 |
| 94. | Southwood Acres | 67.0 | 45.0(+22.0)#94 | 53.0(+14.0)#12,336 |
| 95. | East Hartford | 72.0 | 45.0(+27.0)#95 | 53.0(+19.0)#13,125 |
| 96. | Litchfield Borough | 72.0 | 45.0(+27.0)#96 | 53.0(+19.0)#13,208 |
| 97. | Compo | 73.0 | 45.0(+28.0)#97 | 53.0(+20.0)#13,307 |
| 98. | Oxoboxo River | 77.0 | 45.0(+32.0)#98 | 53.0(+24.0)#13,875 |
| 99. | Lake Pocotopaug | 79.0 | 45.0(+34.0)#99 | 53.0(+26.0)#14,134 |
| 100. | Stafford Springs | 80.0 | 45.0(+35.0)#100 | 53.0(+27.0)#14,255 |
1
2Common Questions
What are the Top 10 Cities with the Fewest Births per 1,000 Women Below Poverty Level in Connecticut?
Top 10 Cities with the Fewest Births per 1,000 Women Below Poverty Level in Connecticut are:
#1
2.0
#2
8.0
#3
9.0
#4
13.0
#5
16.0
#6
17.0
#7
17.0
#8
19.0
#9
19.0
#10
20.0
What city has the Fewest Births per 1,000 Women Below Poverty Level in Connecticut?
New Milford has the Fewest Births per 1,000 Women Below Poverty Level in Connecticut with 2.0.
What is the Number of Births per 1,000 Women Below Poverty Level in the State of Connecticut?
Number of Births per 1,000 Women Below Poverty Level in Connecticut is 45.0.
What is the Number of Births per 1,000 Women Below Poverty Level in the United States?
Number of Births per 1,000 Women Below Poverty Level in the United States is 53.0.