Zip Codes with the Highest Percentage of Population with a Degree in Physical and Health Sciences in Marysville, WA
RELATED REPORTS & OPTIONS
Physical and Health Sciences
Marysville
Compare Zip Codes
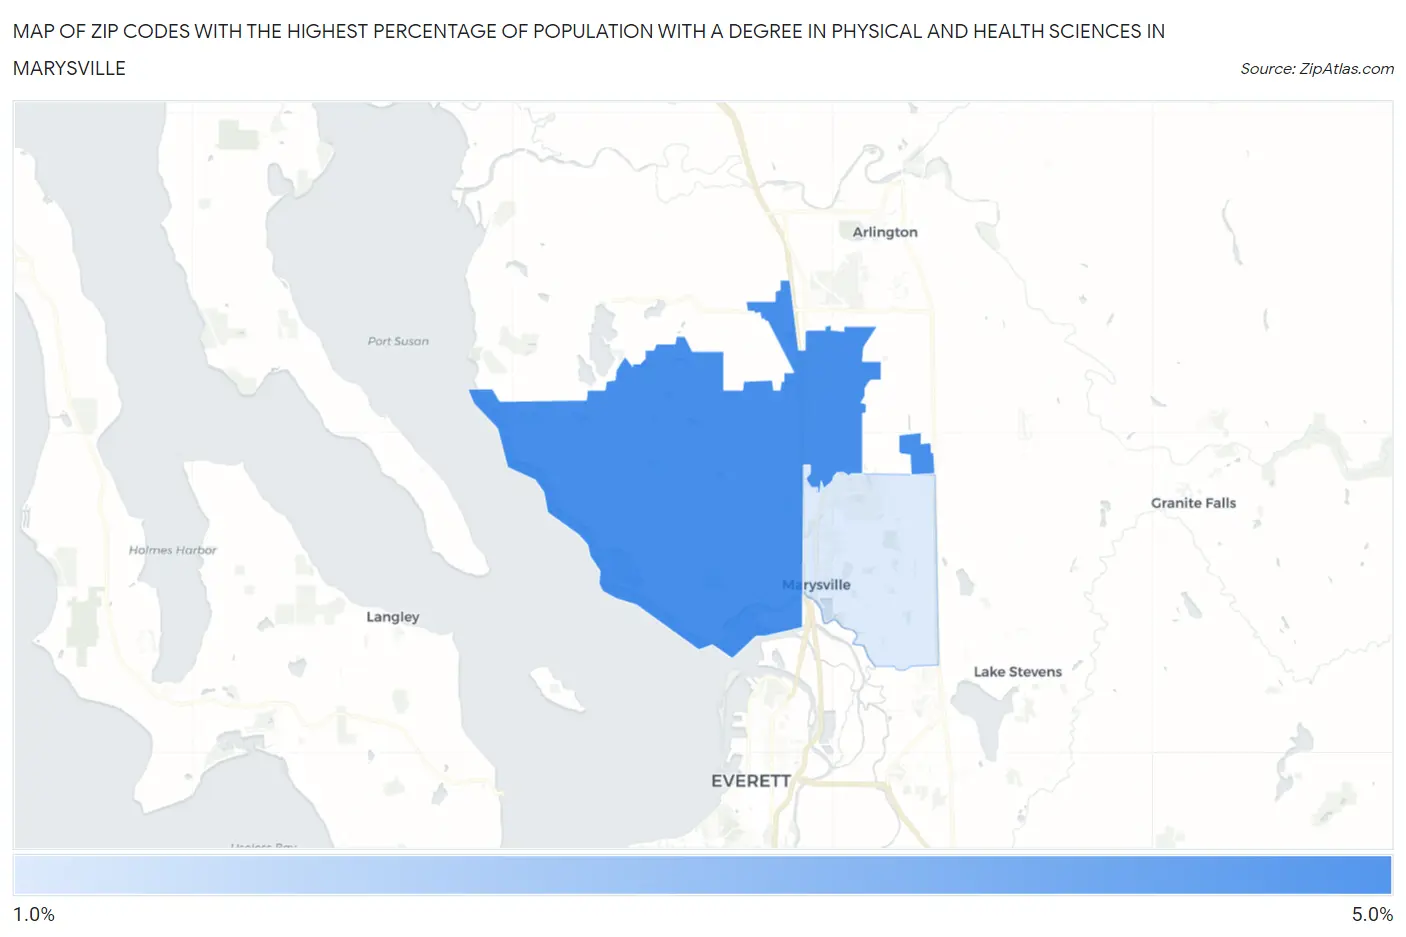
Map of Zip Codes with the Highest Percentage of Population with a Degree in Physical and Health Sciences in Marysville
2.0%
4.3%
Zip Codes with the Highest Percentage of Population with a Degree in Physical and Health Sciences in Marysville, WA
| Zip Code | % Graduates | vs State | vs National | |
| 1. | 98271 | 4.3% | 3.4%(+0.927)#136 | 3.1%(+1.20)#5,965 |
| 2. | 98270 | 2.0% | 3.4%(-1.39)#342 | 3.1%(-1.12)#15,183 |
1
Common Questions
What are the Top Zip Codes with the Highest Percentage of Population with a Degree in Physical and Health Sciences in Marysville, WA?
Top Zip Codes with the Highest Percentage of Population with a Degree in Physical and Health Sciences in Marysville, WA are:
What zip code has the Highest Percentage of Population with a Degree in Physical and Health Sciences in Marysville, WA?
98271 has the Highest Percentage of Population with a Degree in Physical and Health Sciences in Marysville, WA with 4.3%.
What is the Percentage of Population with a Degree in Physical and Health Sciences in Marysville, WA?
Percentage of Population with a Degree in Physical and Health Sciences in Marysville is 2.1%.
What is the Percentage of Population with a Degree in Physical and Health Sciences in Washington?
Percentage of Population with a Degree in Physical and Health Sciences in Washington is 3.4%.
What is the Percentage of Population with a Degree in Physical and Health Sciences in the United States?
Percentage of Population with a Degree in Physical and Health Sciences in the United States is 3.1%.