Everson, WA Map & Demographics
Everson Map
Everson Overview
$32,295
PER CAPITA INCOME
$87,050
AVG FAMILY INCOME
$76,645
AVG HOUSEHOLD INCOME
37.5%
WAGE / INCOME GAP [ % ]
62.5¢/ $1
WAGE / INCOME GAP [ $ ]
0.39
INEQUALITY / GINI INDEX
2,960
TOTAL POPULATION
1,435
MALE POPULATION
1,525
FEMALE POPULATION
94.10
MALES / 100 FEMALES
106.27
FEMALES / 100 MALES
32.3
MEDIAN AGE
3.3
AVG FAMILY SIZE
2.8
AVG HOUSEHOLD SIZE
1,395
LABOR FORCE [ PEOPLE ]
64.4%
PERCENT IN LABOR FORCE
2.6%
UNEMPLOYMENT RATE
Everson Zip Codes
Everson Area Codes
Income in Everson
Income Overview in Everson
Per Capita Income in Everson is $32,295, while median incomes of families and households are $87,050 and $76,645 respectively.
| Characteristic | Number | Measure |
| Per Capita Income | 2,960 | $32,295 |
| Median Family Income | 771 | $87,050 |
| Mean Family Income | 771 | $105,537 |
| Median Household Income | 1,045 | $76,645 |
| Mean Household Income | 1,045 | $90,483 |
| Income Deficit | 771 | $0 |
| Wage / Income Gap (%) | 2,960 | 37.51% |
| Wage / Income Gap ($) | 2,960 | 62.49¢ per $1 |
| Gini / Inequality Index | 2,960 | 0.39 |
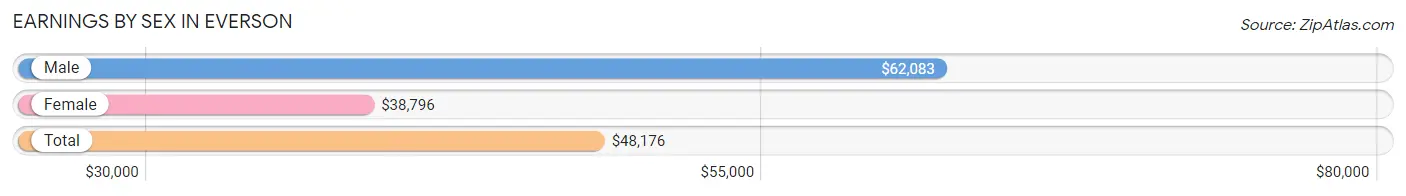
Earnings by Sex in Everson
Average Earnings in Everson are $48,176, $62,083 for men and $38,796 for women, a difference of 37.5%.
| Sex | Number | Average Earnings |
| Male | 728 (50.6%) | $62,083 |
| Female | 710 (49.4%) | $38,796 |
| Total | 1,438 (100.0%) | $48,176 |
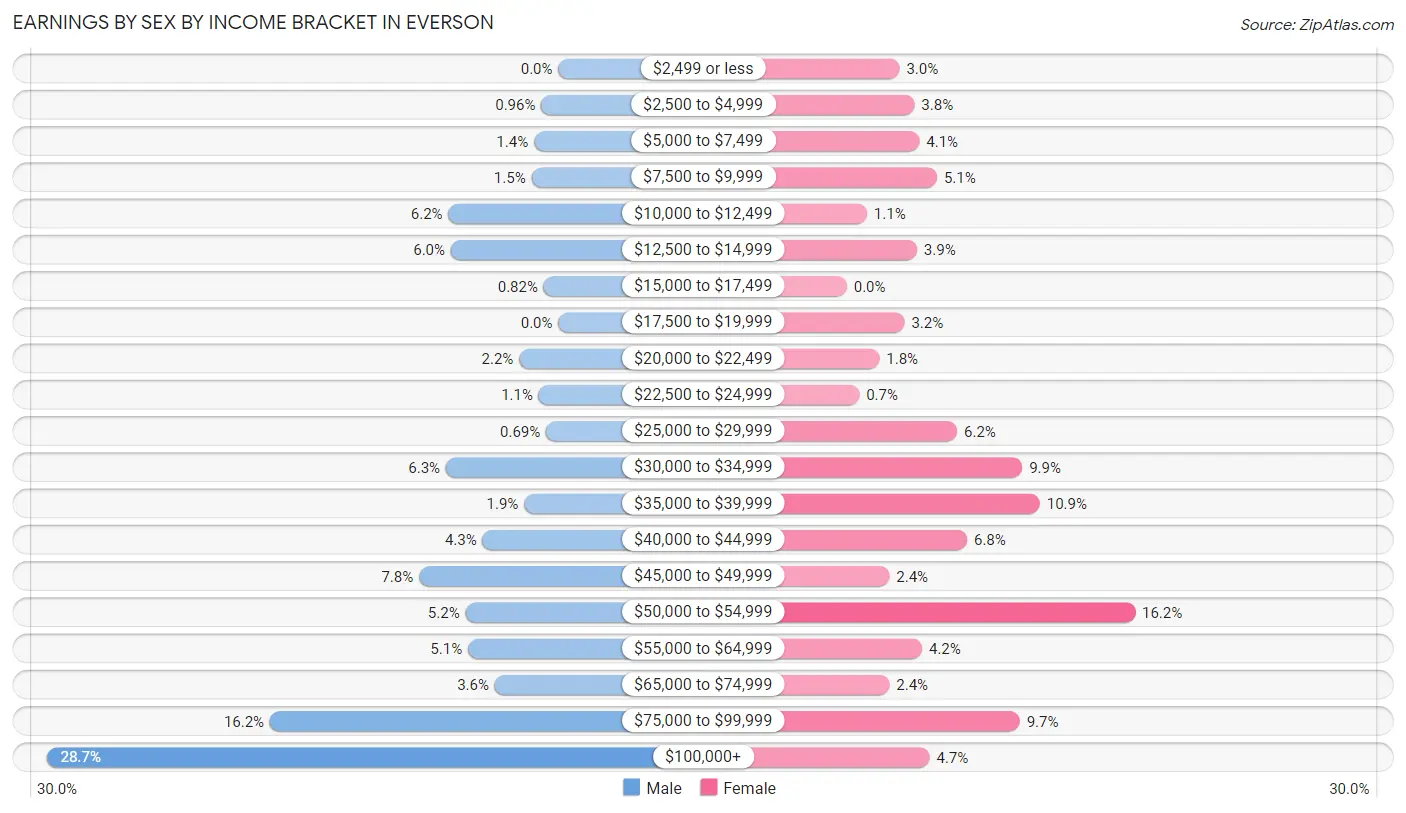
Earnings by Sex by Income Bracket in Everson
The most common earnings brackets in Everson are $100,000+ for men (209 | 28.7%) and $50,000 to $54,999 for women (115 | 16.2%).
| Income | Male | Female |
| $2,499 or less | 0 (0.0%) | 21 (3.0%) |
| $2,500 to $4,999 | 7 (1.0%) | 27 (3.8%) |
| $5,000 to $7,499 | 10 (1.4%) | 29 (4.1%) |
| $7,500 to $9,999 | 11 (1.5%) | 36 (5.1%) |
| $10,000 to $12,499 | 45 (6.2%) | 8 (1.1%) |
| $12,500 to $14,999 | 44 (6.0%) | 28 (3.9%) |
| $15,000 to $17,499 | 6 (0.8%) | 0 (0.0%) |
| $17,500 to $19,999 | 0 (0.0%) | 23 (3.2%) |
| $20,000 to $22,499 | 16 (2.2%) | 13 (1.8%) |
| $22,500 to $24,999 | 8 (1.1%) | 5 (0.7%) |
| $25,000 to $29,999 | 5 (0.7%) | 44 (6.2%) |
| $30,000 to $34,999 | 46 (6.3%) | 70 (9.9%) |
| $35,000 to $39,999 | 14 (1.9%) | 77 (10.8%) |
| $40,000 to $44,999 | 31 (4.3%) | 48 (6.8%) |
| $45,000 to $49,999 | 57 (7.8%) | 17 (2.4%) |
| $50,000 to $54,999 | 38 (5.2%) | 115 (16.2%) |
| $55,000 to $64,999 | 37 (5.1%) | 30 (4.2%) |
| $65,000 to $74,999 | 26 (3.6%) | 17 (2.4%) |
| $75,000 to $99,999 | 118 (16.2%) | 69 (9.7%) |
| $100,000+ | 209 (28.7%) | 33 (4.6%) |
| Total | 728 (100.0%) | 710 (100.0%) |
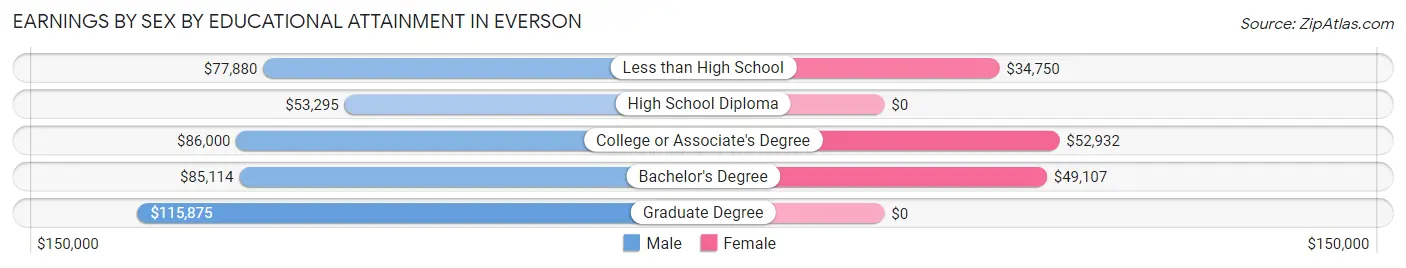
Earnings by Sex by Educational Attainment in Everson
Average earnings in Everson are $76,016 for men and $41,400 for women, a difference of 45.5%. Men with an educational attainment of graduate degree enjoy the highest average annual earnings of $115,875, while those with high school diploma education earn the least with $53,295. Women with an educational attainment of college or associate's degree earn the most with the average annual earnings of $52,932, while those with less than high school education have the smallest earnings of $34,750.
| Educational Attainment | Male Income | Female Income |
| Less than High School | $77,880 | $34,750 |
| High School Diploma | $53,295 | $0 |
| College or Associate's Degree | $86,000 | $52,932 |
| Bachelor's Degree | $85,114 | $49,107 |
| Graduate Degree | $115,875 | $0 |
| Total | $76,016 | $41,400 |
Family Income in Everson
Family Income Brackets in Everson
According to the Everson family income data, there are 184 families falling into the $100,000 to $149,999 income range, which is the most common income bracket and makes up 23.9% of all families. Conversely, the $15,000 to $24,999 income bracket is the least frequent group with only 7 families (0.9%) belonging to this category.
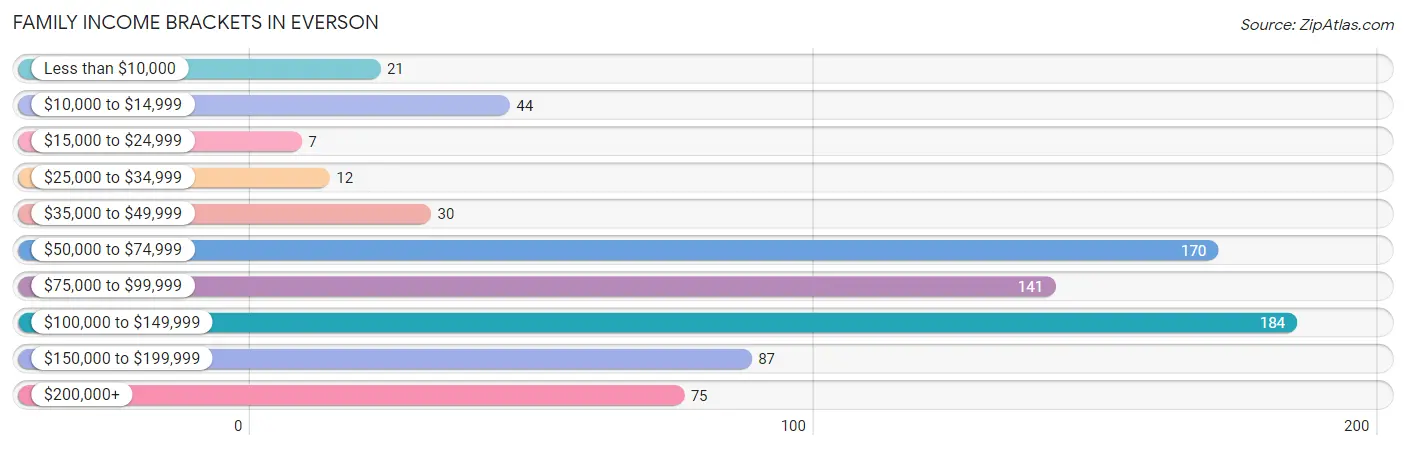
| Income Bracket | # Families | % Families |
| Less than $10,000 | 21 | 2.7% |
| $10,000 to $14,999 | 44 | 5.7% |
| $15,000 to $24,999 | 7 | 0.9% |
| $25,000 to $34,999 | 12 | 1.6% |
| $35,000 to $49,999 | 30 | 3.9% |
| $50,000 to $74,999 | 170 | 22.0% |
| $75,000 to $99,999 | 141 | 18.3% |
| $100,000 to $149,999 | 184 | 23.9% |
| $150,000 to $199,999 | 87 | 11.3% |
| $200,000+ | 75 | 9.7% |
Family Income by Famaliy Size in Everson
5-person families (42 | 5.4%) account for the highest median family income in Everson with $117,857 per family, while 2-person families (214 | 27.8%) have the highest median income of $38,125 per family member.
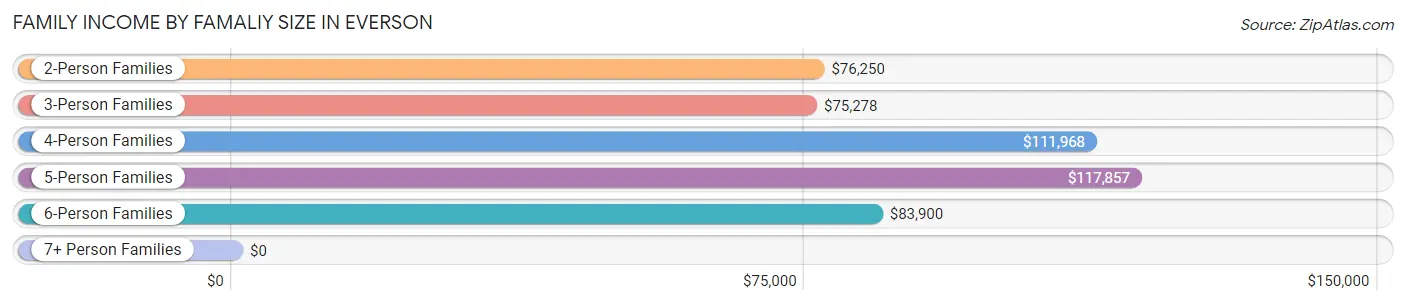
| Income Bracket | # Families | Median Income |
| 2-Person Families | 214 (27.8%) | $76,250 |
| 3-Person Families | 254 (32.9%) | $75,278 |
| 4-Person Families | 210 (27.2%) | $111,968 |
| 5-Person Families | 42 (5.4%) | $117,857 |
| 6-Person Families | 40 (5.2%) | $83,900 |
| 7+ Person Families | 11 (1.4%) | $0 |
| Total | 771 (100.0%) | $87,050 |
Family Income by Number of Earners in Everson
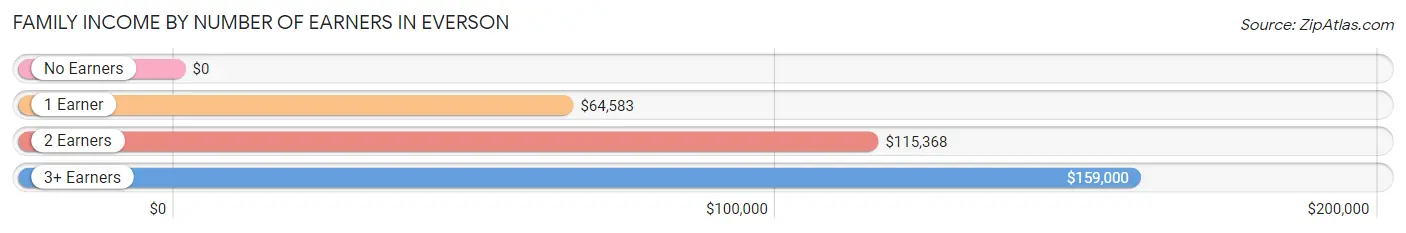
| Number of Earners | # Families | Median Income |
| No Earners | 81 (10.5%) | $0 |
| 1 Earner | 321 (41.6%) | $64,583 |
| 2 Earners | 271 (35.1%) | $115,368 |
| 3+ Earners | 98 (12.7%) | $159,000 |
| Total | 771 (100.0%) | $87,050 |
Household Income in Everson
Household Income Brackets in Everson
With 243 households falling in the category, the $50,000 to $74,999 income range is the most frequent in Everson, accounting for 23.3% of all households. In contrast, only 13 households (1.2%) fall into the less than $10,000 income bracket, making it the least populous group.
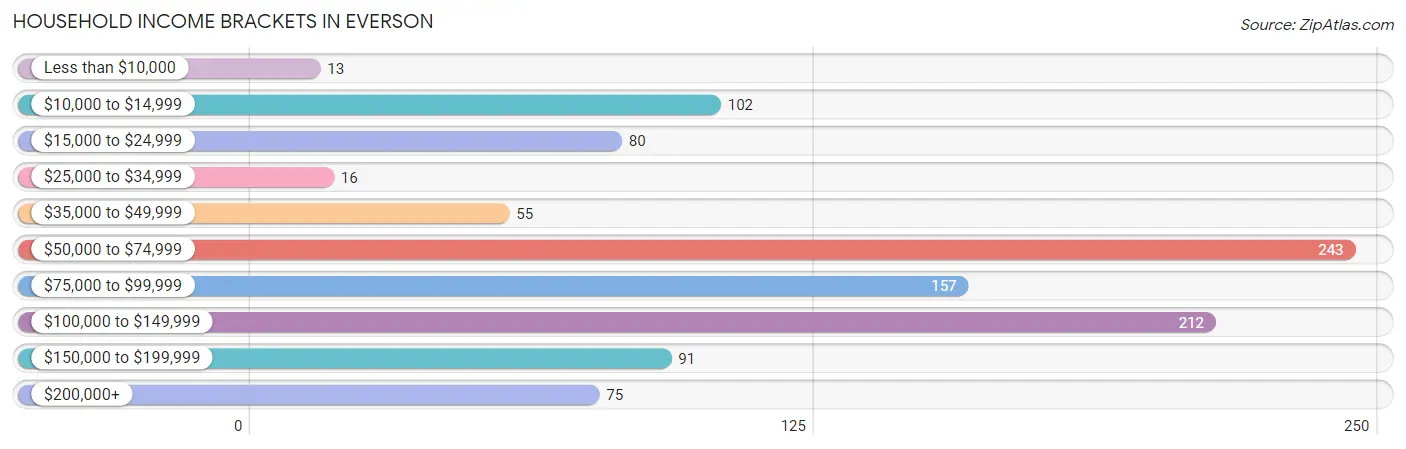
| Income Bracket | # Households | % Households |
| Less than $10,000 | 13 | 1.2% |
| $10,000 to $14,999 | 102 | 9.8% |
| $15,000 to $24,999 | 80 | 7.7% |
| $25,000 to $34,999 | 16 | 1.5% |
| $35,000 to $49,999 | 55 | 5.3% |
| $50,000 to $74,999 | 243 | 23.3% |
| $75,000 to $99,999 | 157 | 15.0% |
| $100,000 to $149,999 | 212 | 20.3% |
| $150,000 to $199,999 | 91 | 8.7% |
| $200,000+ | 75 | 7.2% |
Household Income by Householder Age in Everson
The median household income in Everson is $76,645, with the highest median household income of $103,750 found in the 45 to 64 years age bracket for the primary householder. A total of 260 households (24.9%) fall into this category. Meanwhile, the 65+ years age bracket for the primary householder has the lowest median household income of $47,679, with 243 households (23.3%) in this group.
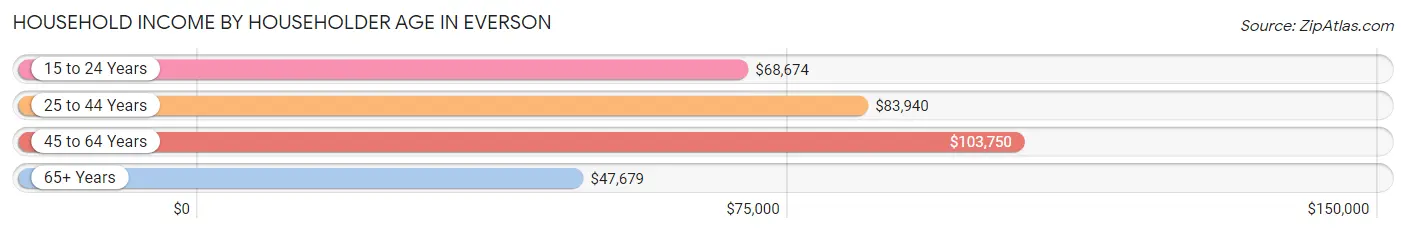
| Income Bracket | # Households | Median Income |
| 15 to 24 Years | 63 (6.0%) | $68,674 |
| 25 to 44 Years | 479 (45.8%) | $83,940 |
| 45 to 64 Years | 260 (24.9%) | $103,750 |
| 65+ Years | 243 (23.3%) | $47,679 |
| Total | 1,045 (100.0%) | $76,645 |
Poverty in Everson
Income Below Poverty by Sex and Age in Everson
With 9.0% poverty level for males and 12.5% for females among the residents of Everson, 5 year old males and 18 to 24 year old females are the most vulnerable to poverty, with 10 males (34.5%) and 49 females (32.7%) in their respective age groups living below the poverty level.
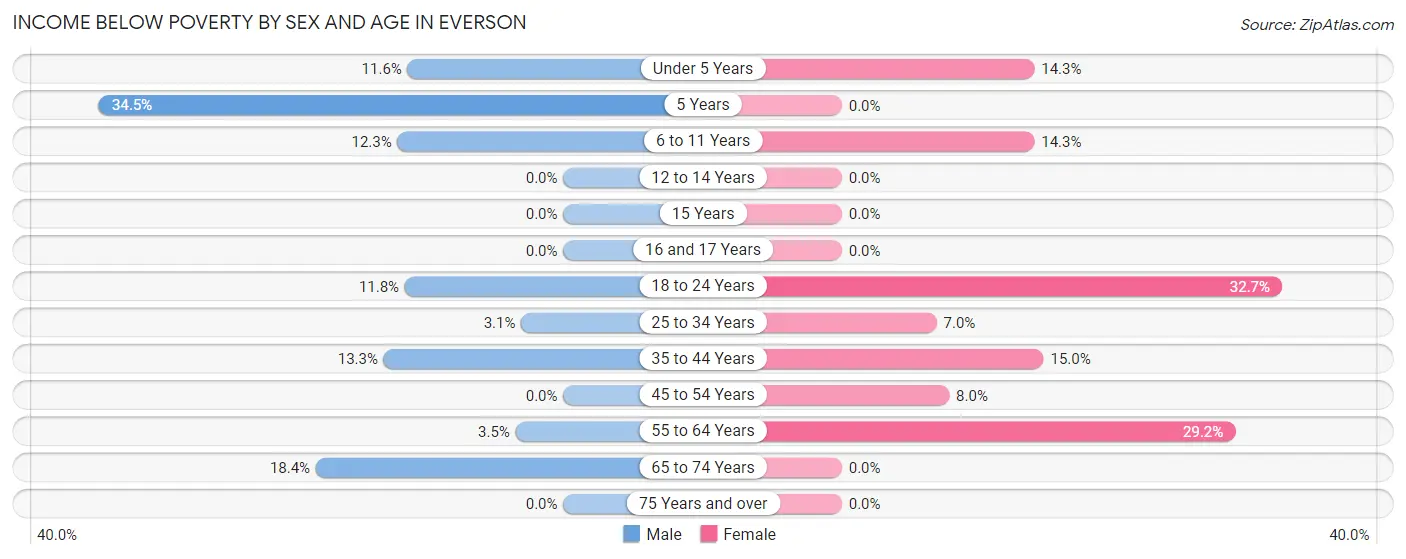
| Age Bracket | Male | Female |
| Under 5 Years | 17 (11.6%) | 21 (14.3%) |
| 5 Years | 10 (34.5%) | 0 (0.0%) |
| 6 to 11 Years | 24 (12.3%) | 9 (14.3%) |
| 12 to 14 Years | 0 (0.0%) | 0 (0.0%) |
| 15 Years | 0 (0.0%) | 0 (0.0%) |
| 16 and 17 Years | 0 (0.0%) | 0 (0.0%) |
| 18 to 24 Years | 16 (11.8%) | 49 (32.7%) |
| 25 to 34 Years | 7 (3.1%) | 15 (7.0%) |
| 35 to 44 Years | 24 (13.3%) | 46 (15.0%) |
| 45 to 54 Years | 0 (0.0%) | 11 (8.0%) |
| 55 to 64 Years | 4 (3.5%) | 40 (29.2%) |
| 65 to 74 Years | 27 (18.4%) | 0 (0.0%) |
| 75 Years and over | 0 (0.0%) | 0 (0.0%) |
| Total | 129 (9.0%) | 191 (12.5%) |
Income Above Poverty by Sex and Age in Everson
According to the poverty statistics in Everson, males aged 12 to 14 years and females aged 5 years are the age groups that are most secure financially, with 100.0% of males and 100.0% of females in these age groups living above the poverty line.
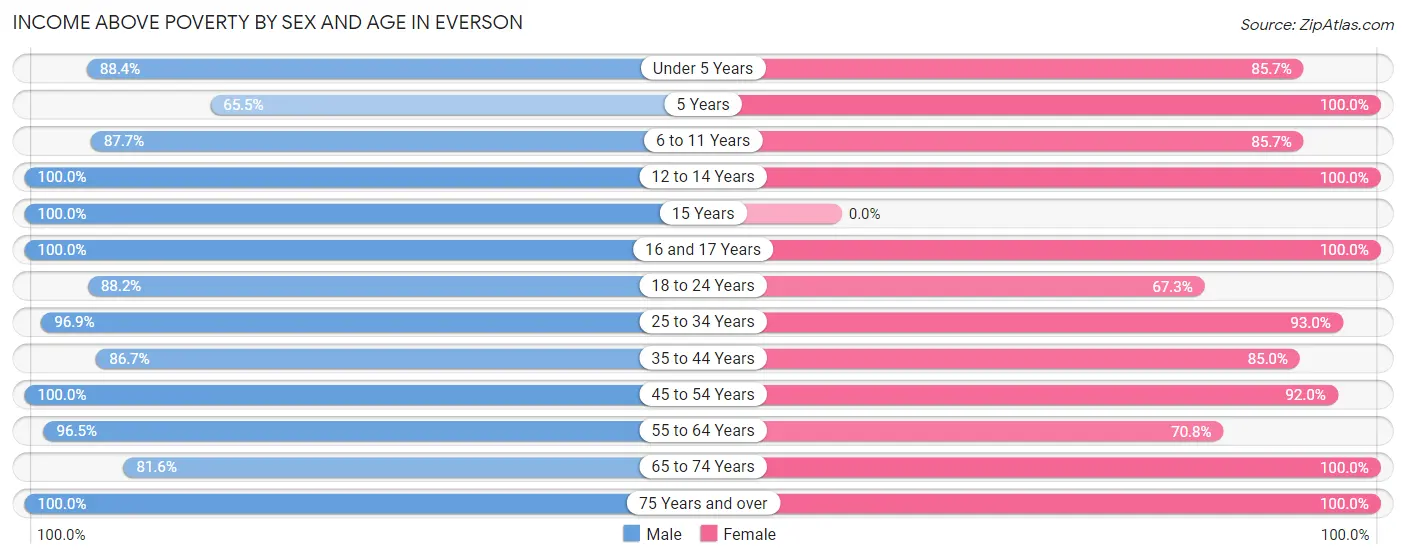
| Age Bracket | Male | Female |
| Under 5 Years | 130 (88.4%) | 126 (85.7%) |
| 5 Years | 19 (65.5%) | 25 (100.0%) |
| 6 to 11 Years | 171 (87.7%) | 54 (85.7%) |
| 12 to 14 Years | 99 (100.0%) | 81 (100.0%) |
| 15 Years | 8 (100.0%) | 0 (0.0%) |
| 16 and 17 Years | 11 (100.0%) | 60 (100.0%) |
| 18 to 24 Years | 120 (88.2%) | 101 (67.3%) |
| 25 to 34 Years | 217 (96.9%) | 198 (93.0%) |
| 35 to 44 Years | 156 (86.7%) | 261 (85.0%) |
| 45 to 54 Years | 94 (100.0%) | 127 (92.0%) |
| 55 to 64 Years | 109 (96.5%) | 97 (70.8%) |
| 65 to 74 Years | 120 (81.6%) | 152 (100.0%) |
| 75 Years and over | 52 (100.0%) | 52 (100.0%) |
| Total | 1,306 (91.0%) | 1,334 (87.5%) |
Income Below Poverty Among Married-Couple Families in Everson
The poverty statistics for married-couple families in Everson show that 5.0% or 28 of the total 565 families live below the poverty line. Families with no children have the highest poverty rate of 9.6%, comprising of 28 families. On the other hand, families with 1 or 2 children have the lowest poverty rate of 0.0%, which includes 0 families.
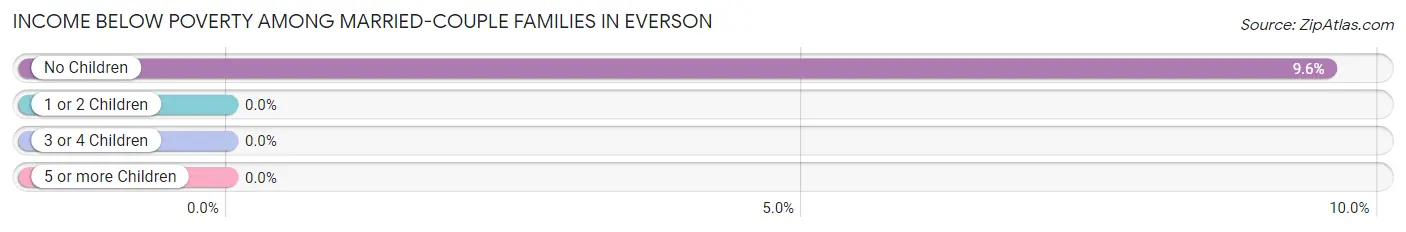
| Children | Above Poverty | Below Poverty |
| No Children | 265 (90.4%) | 28 (9.6%) |
| 1 or 2 Children | 196 (100.0%) | 0 (0.0%) |
| 3 or 4 Children | 65 (100.0%) | 0 (0.0%) |
| 5 or more Children | 11 (100.0%) | 0 (0.0%) |
| Total | 537 (95.0%) | 28 (5.0%) |
Income Below Poverty Among Single-Parent Households in Everson
According to the poverty data in Everson, 31.4% or 16 single-father households and 18.1% or 28 single-mother households are living below the poverty line. Among single-father households, those with 1 or 2 children have the highest poverty rate, with 16 households (64.0%) experiencing poverty. Likewise, among single-mother households, those with 3 or 4 children have the highest poverty rate, with 7 households (50.0%) falling below the poverty line.
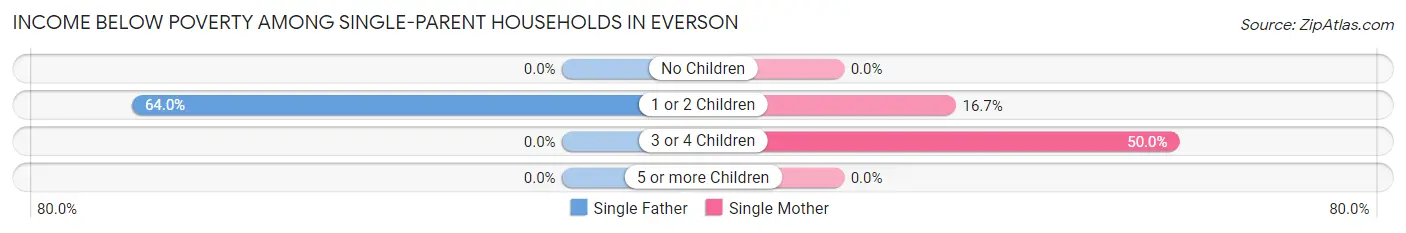
| Children | Single Father | Single Mother |
| No Children | 0 (0.0%) | 0 (0.0%) |
| 1 or 2 Children | 16 (64.0%) | 21 (16.7%) |
| 3 or 4 Children | 0 (0.0%) | 7 (50.0%) |
| 5 or more Children | 0 (0.0%) | 0 (0.0%) |
| Total | 16 (31.4%) | 28 (18.1%) |
Income Below Poverty Among Married-Couple vs Single-Parent Households in Everson
The poverty data for Everson shows that 28 of the married-couple family households (5.0%) and 44 of the single-parent households (21.4%) are living below the poverty level. Within the married-couple family households, those with no children have the highest poverty rate, with 28 households (9.6%) falling below the poverty line. Among the single-parent households, those with 1 or 2 children have the highest poverty rate, with 37 household (24.5%) living below poverty.
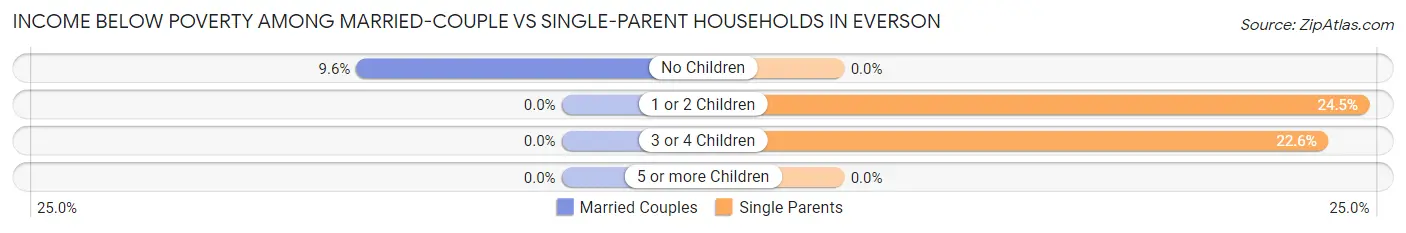
| Children | Married-Couple Families | Single-Parent Households |
| No Children | 28 (9.6%) | 0 (0.0%) |
| 1 or 2 Children | 0 (0.0%) | 37 (24.5%) |
| 3 or 4 Children | 0 (0.0%) | 7 (22.6%) |
| 5 or more Children | 0 (0.0%) | 0 (0.0%) |
| Total | 28 (5.0%) | 44 (21.4%) |
Race in Everson
The most populous races in Everson are White / Caucasian (2,344 | 79.2%), Hispanic or Latino (624 | 21.1%), and Some other Race (293 | 9.9%).
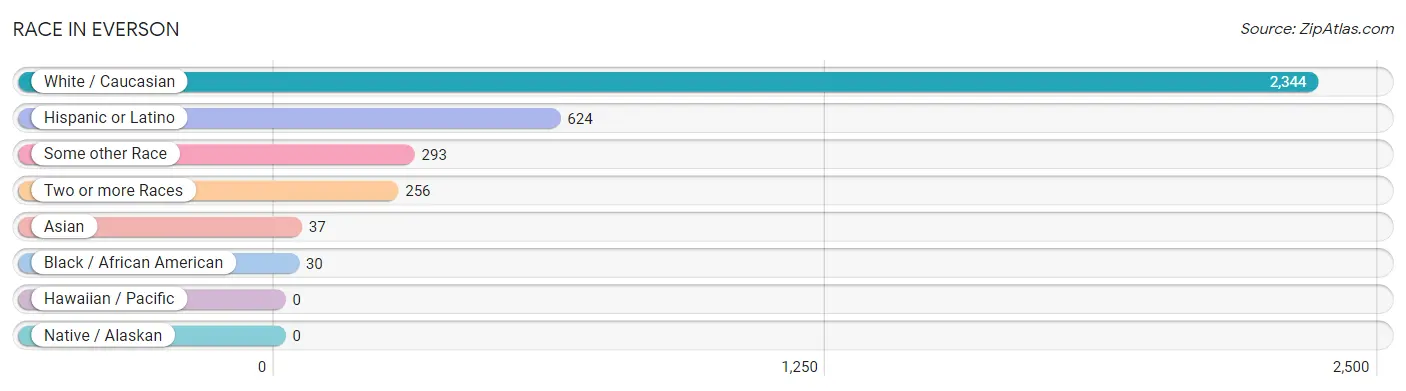
| Race | # Population | % Population |
| Asian | 37 | 1.3% |
| Black / African American | 30 | 1.0% |
| Hawaiian / Pacific | 0 | 0.0% |
| Hispanic or Latino | 624 | 21.1% |
| Native / Alaskan | 0 | 0.0% |
| White / Caucasian | 2,344 | 79.2% |
| Two or more Races | 256 | 8.6% |
| Some other Race | 293 | 9.9% |
| Total | 2,960 | 100.0% |
Ancestry in Everson
The most populous ancestries reported in Everson are Mexican (545 | 18.4%), Dutch (441 | 14.9%), German (335 | 11.3%), European (260 | 8.8%), and Irish (194 | 6.6%), together accounting for 60.0% of all Everson residents.
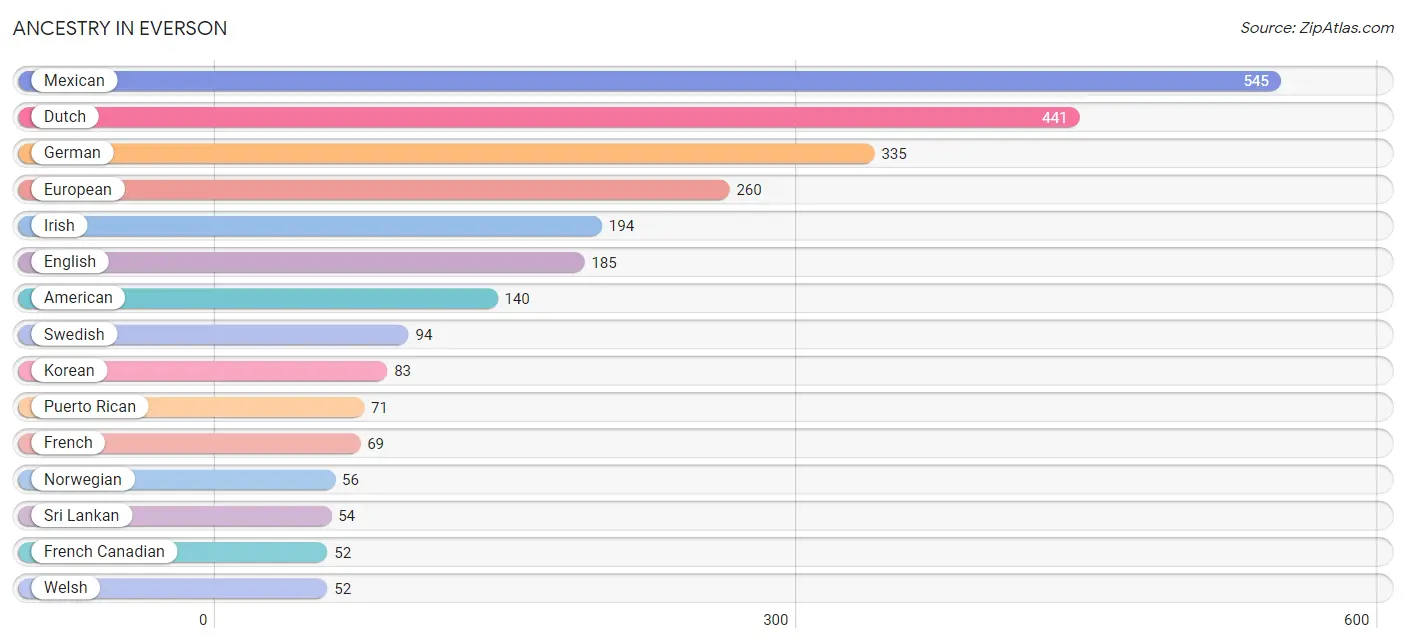
| Ancestry | # Population | % Population |
| American | 140 | 4.7% |
| Austrian | 5 | 0.2% |
| Bhutanese | 16 | 0.5% |
| British | 27 | 0.9% |
| Burmese | 16 | 0.5% |
| Canadian | 5 | 0.2% |
| Cherokee | 32 | 1.1% |
| Choctaw | 22 | 0.7% |
| Cuban | 8 | 0.3% |
| Dutch | 441 | 14.9% |
| English | 185 | 6.2% |
| European | 260 | 8.8% |
| French | 69 | 2.3% |
| French Canadian | 52 | 1.8% |
| German | 335 | 11.3% |
| Greek | 36 | 1.2% |
| Hungarian | 45 | 1.5% |
| Icelander | 4 | 0.1% |
| Indian (Asian) | 16 | 0.5% |
| Iranian | 12 | 0.4% |
| Irish | 194 | 6.6% |
| Italian | 30 | 1.0% |
| Korean | 83 | 2.8% |
| Mexican | 545 | 18.4% |
| Native Hawaiian | 7 | 0.2% |
| Northern European | 19 | 0.6% |
| Norwegian | 56 | 1.9% |
| Polish | 18 | 0.6% |
| Portuguese | 14 | 0.5% |
| Puerto Rican | 71 | 2.4% |
| Russian | 11 | 0.4% |
| Scandinavian | 6 | 0.2% |
| Scotch-Irish | 14 | 0.5% |
| Scottish | 35 | 1.2% |
| Sri Lankan | 54 | 1.8% |
| Swedish | 94 | 3.2% |
| Swiss | 5 | 0.2% |
| Thai | 36 | 1.2% |
| Welsh | 52 | 1.8% | View All 39 Rows |
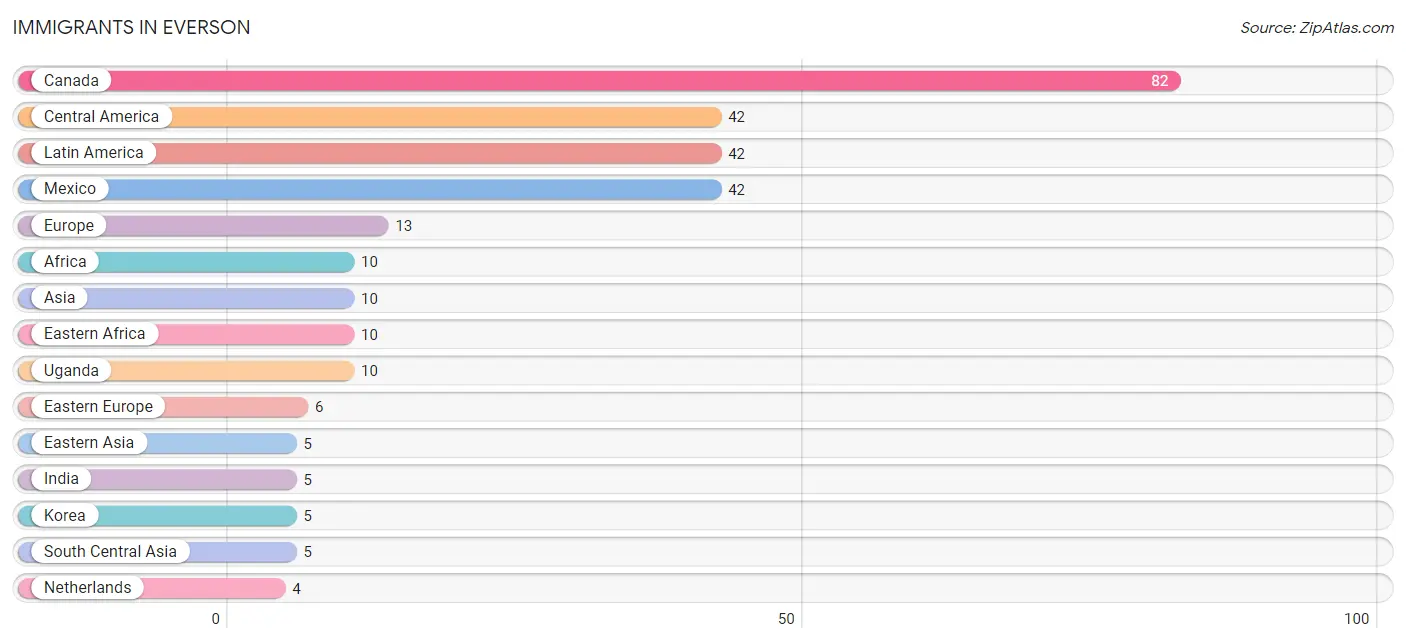
Immigrants in Everson
The most numerous immigrant groups reported in Everson came from Canada (82 | 2.8%), Central America (42 | 1.4%), Latin America (42 | 1.4%), Mexico (42 | 1.4%), and Europe (13 | 0.4%), together accounting for 7.5% of all Everson residents.
| Immigration Origin | # Population | % Population |
| Africa | 10 | 0.3% |
| Asia | 10 | 0.3% |
| Canada | 82 | 2.8% |
| Central America | 42 | 1.4% |
| Eastern Africa | 10 | 0.3% |
| Eastern Asia | 5 | 0.2% |
| Eastern Europe | 6 | 0.2% |
| England | 3 | 0.1% |
| Europe | 13 | 0.4% |
| India | 5 | 0.2% |
| Korea | 5 | 0.2% |
| Latin America | 42 | 1.4% |
| Mexico | 42 | 1.4% |
| Netherlands | 4 | 0.1% |
| Northern Europe | 3 | 0.1% |
| South Central Asia | 5 | 0.2% |
| Uganda | 10 | 0.3% |
| Western Europe | 4 | 0.1% | View All 18 Rows |
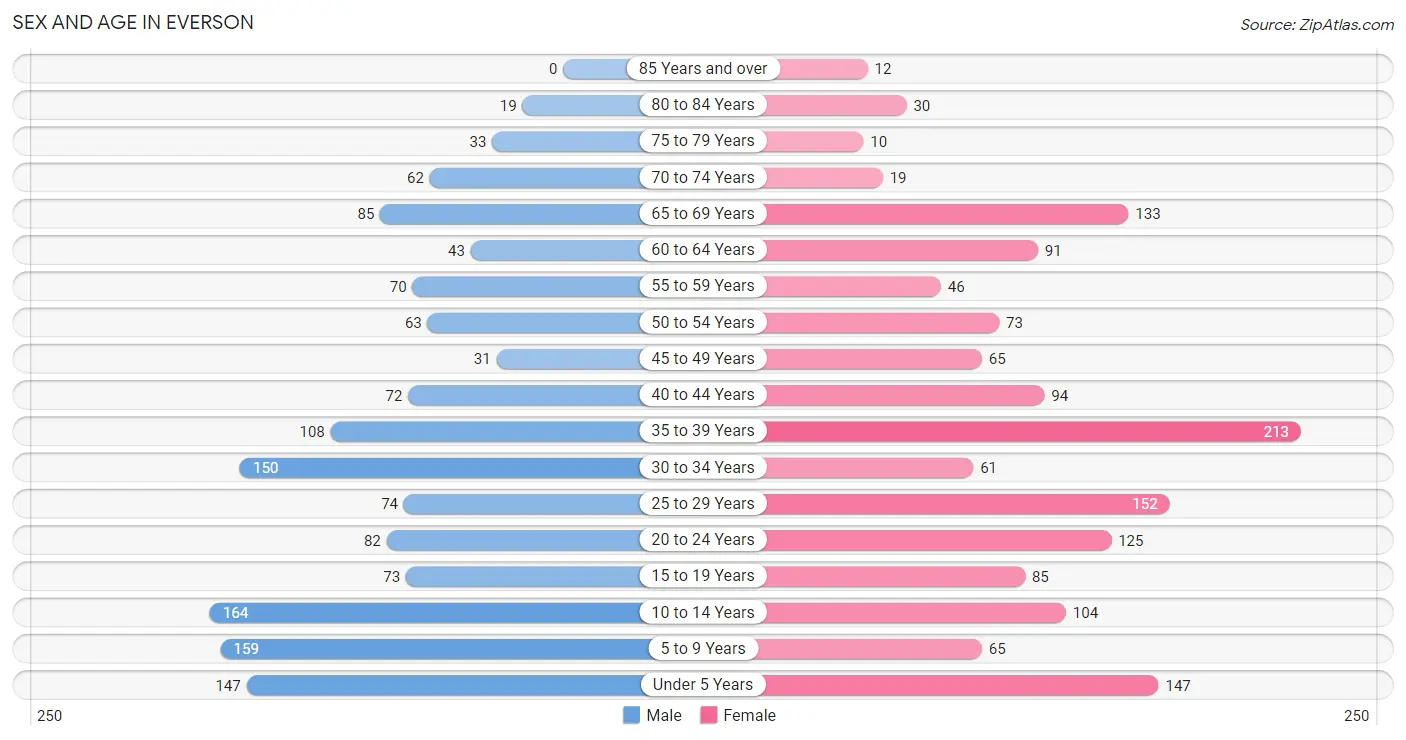
Sex and Age in Everson
Sex and Age in Everson
The most populous age groups in Everson are 10 to 14 Years (164 | 11.4%) for men and 35 to 39 Years (213 | 14.0%) for women.
| Age Bracket | Male | Female |
| Under 5 Years | 147 (10.2%) | 147 (9.6%) |
| 5 to 9 Years | 159 (11.1%) | 65 (4.3%) |
| 10 to 14 Years | 164 (11.4%) | 104 (6.8%) |
| 15 to 19 Years | 73 (5.1%) | 85 (5.6%) |
| 20 to 24 Years | 82 (5.7%) | 125 (8.2%) |
| 25 to 29 Years | 74 (5.2%) | 152 (10.0%) |
| 30 to 34 Years | 150 (10.4%) | 61 (4.0%) |
| 35 to 39 Years | 108 (7.5%) | 213 (14.0%) |
| 40 to 44 Years | 72 (5.0%) | 94 (6.2%) |
| 45 to 49 Years | 31 (2.2%) | 65 (4.3%) |
| 50 to 54 Years | 63 (4.4%) | 73 (4.8%) |
| 55 to 59 Years | 70 (4.9%) | 46 (3.0%) |
| 60 to 64 Years | 43 (3.0%) | 91 (6.0%) |
| 65 to 69 Years | 85 (5.9%) | 133 (8.7%) |
| 70 to 74 Years | 62 (4.3%) | 19 (1.3%) |
| 75 to 79 Years | 33 (2.3%) | 10 (0.7%) |
| 80 to 84 Years | 19 (1.3%) | 30 (2.0%) |
| 85 Years and over | 0 (0.0%) | 12 (0.8%) |
| Total | 1,435 (100.0%) | 1,525 (100.0%) |
Families and Households in Everson
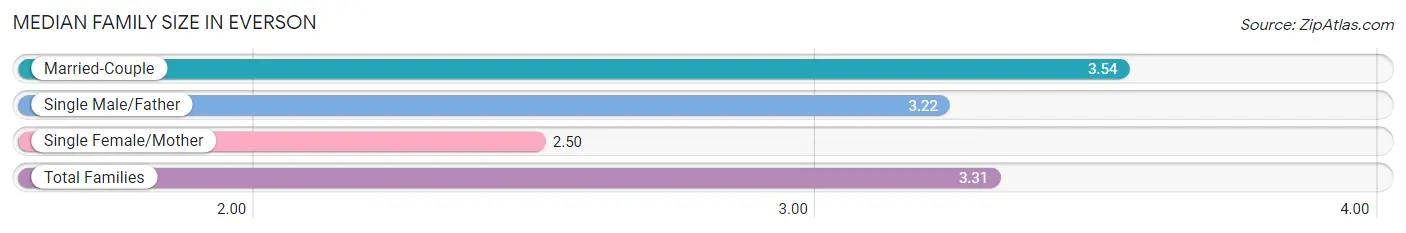
Median Family Size in Everson
The median family size in Everson is 3.31 persons per family, with married-couple families (565 | 73.3%) accounting for the largest median family size of 3.54 persons per family. On the other hand, single female/mother families (155 | 20.1%) represent the smallest median family size with 2.50 persons per family.
| Family Type | # Families | Family Size |
| Married-Couple | 565 (73.3%) | 3.54 |
| Single Male/Father | 51 (6.6%) | 3.22 |
| Single Female/Mother | 155 (20.1%) | 2.50 |
| Total Families | 771 (100.0%) | 3.31 |
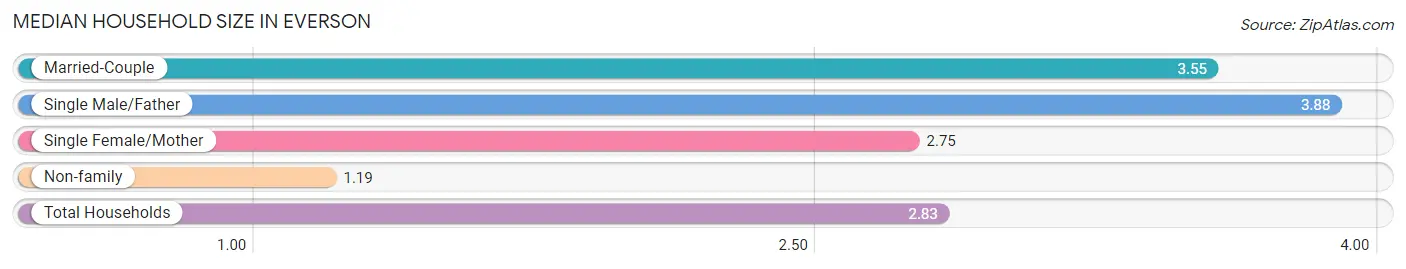
Median Household Size in Everson
The median household size in Everson is 2.83 persons per household, with single male/father households (51 | 4.9%) accounting for the largest median household size of 3.88 persons per household. non-family households (274 | 26.2%) represent the smallest median household size with 1.19 persons per household.
| Household Type | # Households | Household Size |
| Married-Couple | 565 (54.1%) | 3.55 |
| Single Male/Father | 51 (4.9%) | 3.88 |
| Single Female/Mother | 155 (14.8%) | 2.75 |
| Non-family | 274 (26.2%) | 1.19 |
| Total Households | 1,045 (100.0%) | 2.83 |
Household Size by Marriage Status in Everson
Out of a total of 1,045 households in Everson, 771 (73.8%) are family households, while 274 (26.2%) are nonfamily households. The most numerous type of family households are 3-person households, comprising 268, and the most common type of nonfamily households are 1-person households, comprising 222.
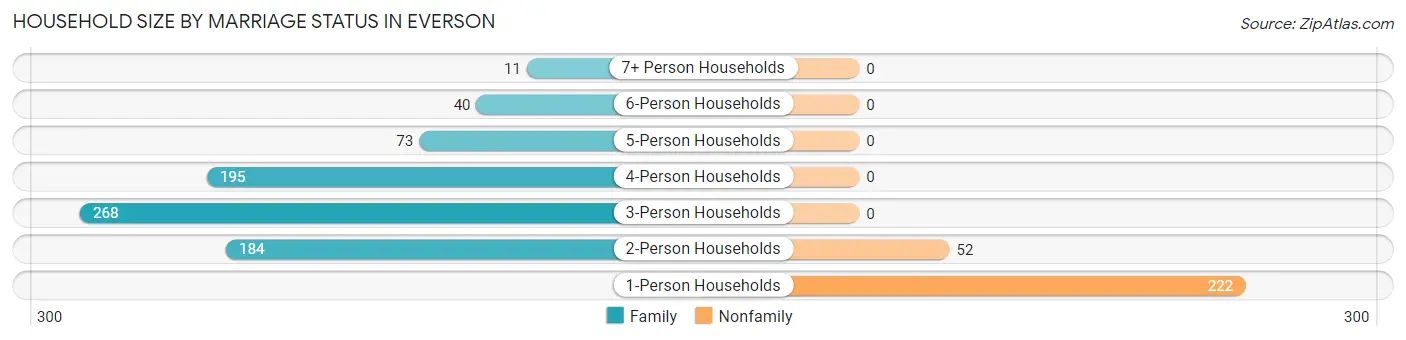
| Household Size | Family Households | Nonfamily Households |
| 1-Person Households | - | 222 (21.2%) |
| 2-Person Households | 184 (17.6%) | 52 (5.0%) |
| 3-Person Households | 268 (25.7%) | 0 (0.0%) |
| 4-Person Households | 195 (18.7%) | 0 (0.0%) |
| 5-Person Households | 73 (7.0%) | 0 (0.0%) |
| 6-Person Households | 40 (3.8%) | 0 (0.0%) |
| 7+ Person Households | 11 (1.1%) | 0 (0.0%) |
| Total | 771 (73.8%) | 274 (26.2%) |
Female Fertility in Everson
Fertility by Age in Everson
Average fertility rate in Everson is 59.0 births per 1,000 women. Women in the age bracket of 20 to 34 years have the highest fertility rate with 142.0 births per 1,000 women. Women in the age bracket of 20 to 34 years acount for 100.0% of all women with births.
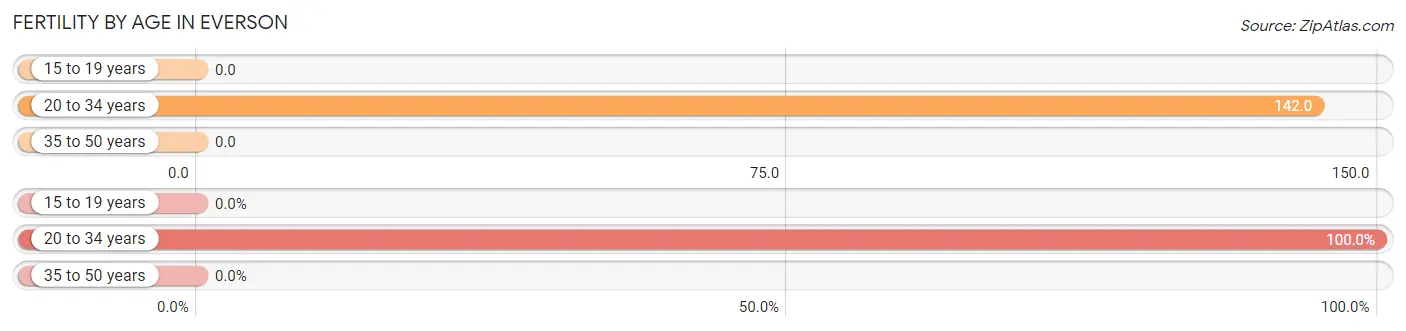
| Age Bracket | Women with Births | Births / 1,000 Women |
| 15 to 19 years | 0 (0.0%) | 0.0 |
| 20 to 34 years | 48 (100.0%) | 142.0 |
| 35 to 50 years | 0 (0.0%) | 0.0 |
| Total | 48 (100.0%) | 59.0 |
Fertility by Age by Marriage Status in Everson
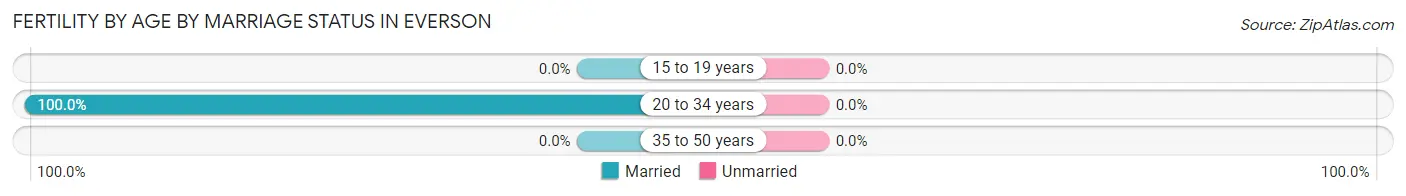
| Age Bracket | Married | Unmarried |
| 15 to 19 years | 0 (0.0%) | 0 (0.0%) |
| 20 to 34 years | 48 (100.0%) | 0 (0.0%) |
| 35 to 50 years | 0 (0.0%) | 0 (0.0%) |
| Total | 48 (100.0%) | 0 (0.0%) |
Fertility by Education in Everson
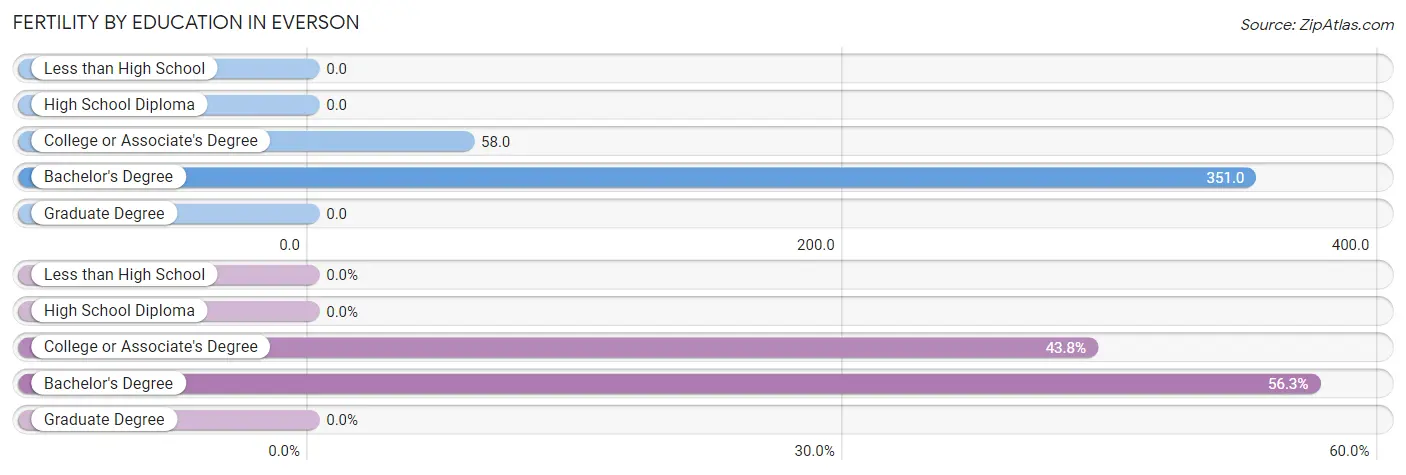
| Educational Attainment | Women with Births | Births / 1,000 Women |
| Less than High School | 0 (0.0%) | 0.0 |
| High School Diploma | 0 (0.0%) | 0.0 |
| College or Associate's Degree | 21 (43.8%) | 58.0 |
| Bachelor's Degree | 27 (56.2%) | 351.0 |
| Graduate Degree | 0 (0.0%) | 0.0 |
| Total | 48 (100.0%) | 59.0 |
Fertility by Education by Marriage Status in Everson
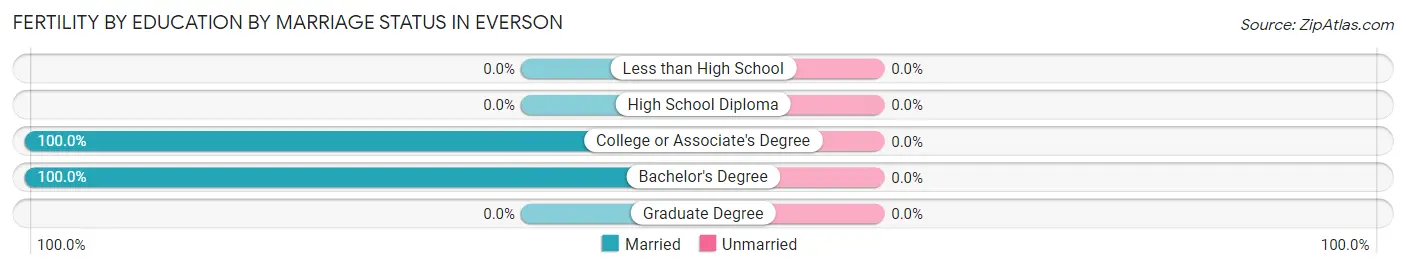
| Educational Attainment | Married | Unmarried |
| Less than High School | 0 (0.0%) | 0 (0.0%) |
| High School Diploma | 0 (0.0%) | 0 (0.0%) |
| College or Associate's Degree | 21 (100.0%) | 0 (0.0%) |
| Bachelor's Degree | 27 (100.0%) | 0 (0.0%) |
| Graduate Degree | 0 (0.0%) | 0 (0.0%) |
| Total | 48 (100.0%) | 0 (0.0%) |
Employment Characteristics in Everson
Employment by Class of Employer in Everson
Among the 1,348 employed individuals in Everson, private company employees (931 | 69.1%), not-for-profit organizations (262 | 19.4%), and local government employees (67 | 5.0%) make up the most common classes of employment.
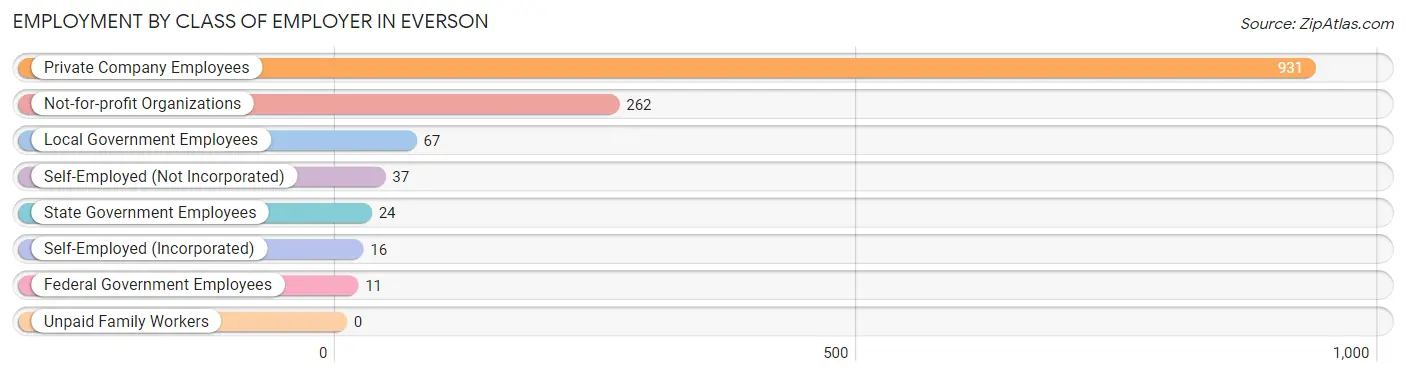
| Employer Class | # Employees | % Employees |
| Private Company Employees | 931 | 69.1% |
| Self-Employed (Incorporated) | 16 | 1.2% |
| Self-Employed (Not Incorporated) | 37 | 2.7% |
| Not-for-profit Organizations | 262 | 19.4% |
| Local Government Employees | 67 | 5.0% |
| State Government Employees | 24 | 1.8% |
| Federal Government Employees | 11 | 0.8% |
| Unpaid Family Workers | 0 | 0.0% |
| Total | 1,348 | 100.0% |
Employment Status by Age in Everson
According to the labor force statistics for Everson, out of the total population over 16 years of age (2,166), 64.4% or 1,395 individuals are in the labor force, with 2.6% or 36 of them unemployed. The age group with the highest labor force participation rate is 45 to 54 years, with 93.5% or 217 individuals in the labor force. Within the labor force, the 16 to 19 years age range has the highest percentage of unemployed individuals, with 12.6% or 11 of them being unemployed.
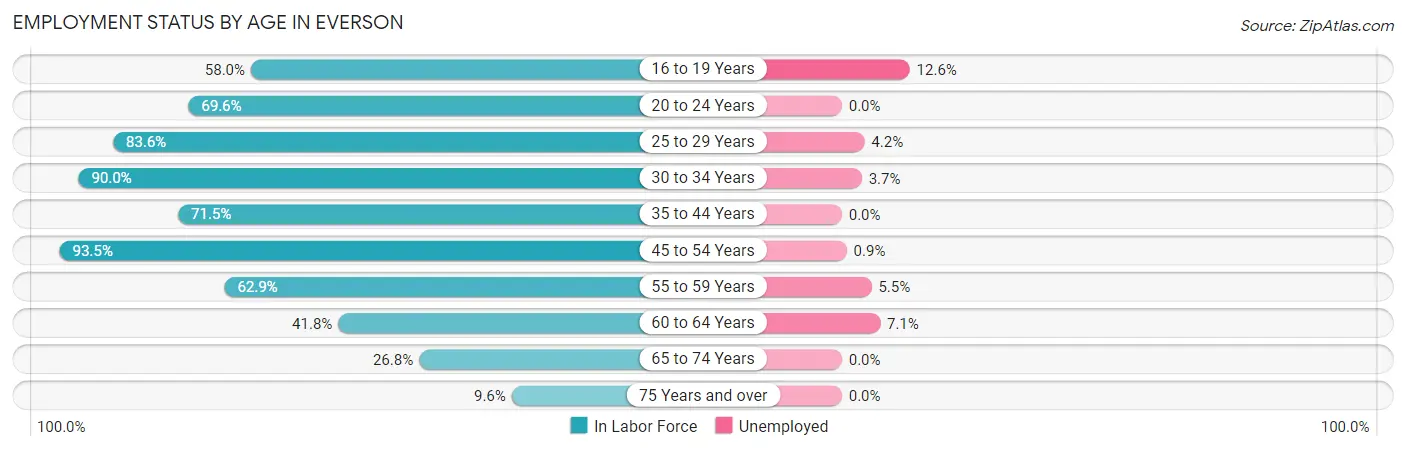
| Age Bracket | In Labor Force | Unemployed |
| 16 to 19 Years | 87 (58.0%) | 11 (12.6%) |
| 20 to 24 Years | 144 (69.6%) | 0 (0.0%) |
| 25 to 29 Years | 189 (83.6%) | 8 (4.2%) |
| 30 to 34 Years | 190 (90.0%) | 7 (3.7%) |
| 35 to 44 Years | 348 (71.5%) | 0 (0.0%) |
| 45 to 54 Years | 217 (93.5%) | 2 (0.9%) |
| 55 to 59 Years | 73 (62.9%) | 4 (5.5%) |
| 60 to 64 Years | 56 (41.8%) | 4 (7.1%) |
| 65 to 74 Years | 80 (26.8%) | 0 (0.0%) |
| 75 Years and over | 10 (9.6%) | 0 (0.0%) |
| Total | 1,395 (64.4%) | 36 (2.6%) |
Employment Status by Educational Attainment in Everson
According to labor force statistics for Everson, 76.3% of individuals (1,073) out of the total population between 25 and 64 years of age (1,406) are in the labor force, with 2.3% or 25 of them being unemployed. The group with the highest labor force participation rate are those with the educational attainment of bachelor's degree or higher, with 86.1% or 284 individuals in the labor force. Within the labor force, individuals with high school diploma education have the highest percentage of unemployment, with 5.2% or 13 of them being unemployed.
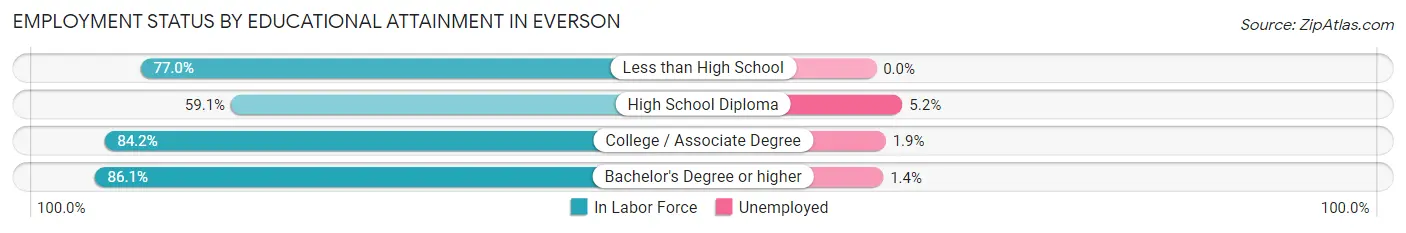
| Educational Attainment | In Labor Force | Unemployed |
| Less than High School | 114 (77.0%) | 0 (0.0%) |
| High School Diploma | 250 (59.1%) | 22 (5.2%) |
| College / Associate Degree | 425 (84.2%) | 10 (1.9%) |
| Bachelor's Degree or higher | 284 (86.1%) | 5 (1.4%) |
| Total | 1,073 (76.3%) | 32 (2.3%) |
Employment Occupations by Sex in Everson
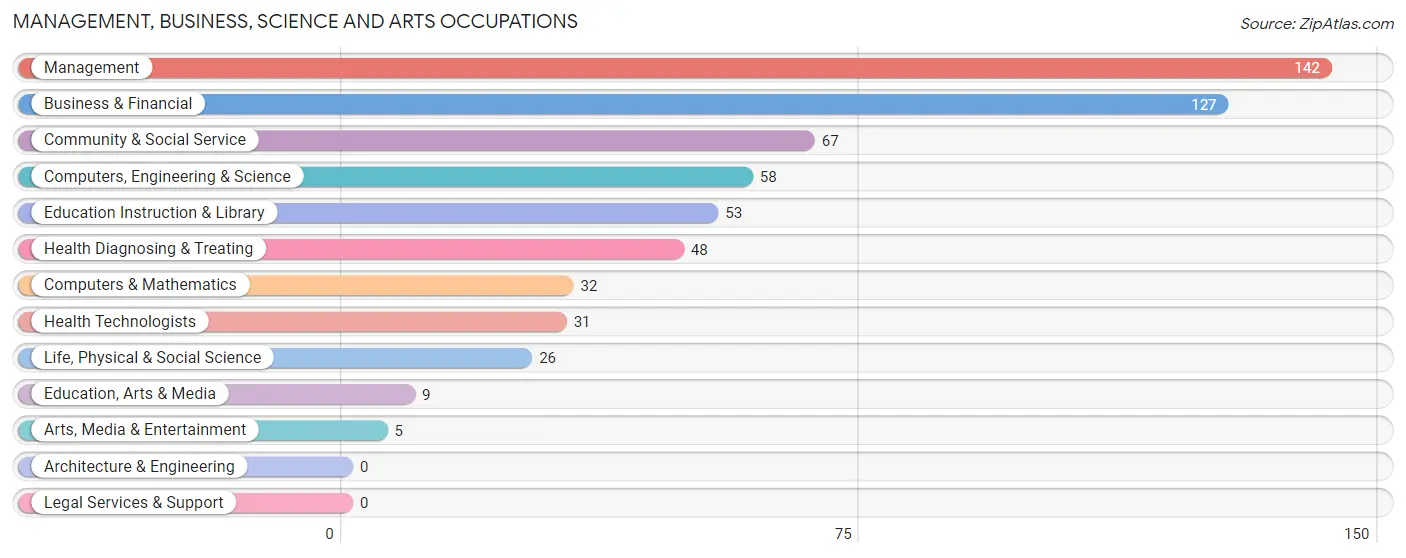
Management, Business, Science and Arts Occupations
The most common Management, Business, Science and Arts occupations in Everson are Management (142 | 10.5%), Business & Financial (127 | 9.3%), Community & Social Service (67 | 4.9%), Computers, Engineering & Science (58 | 4.3%), and Education Instruction & Library (53 | 3.9%).
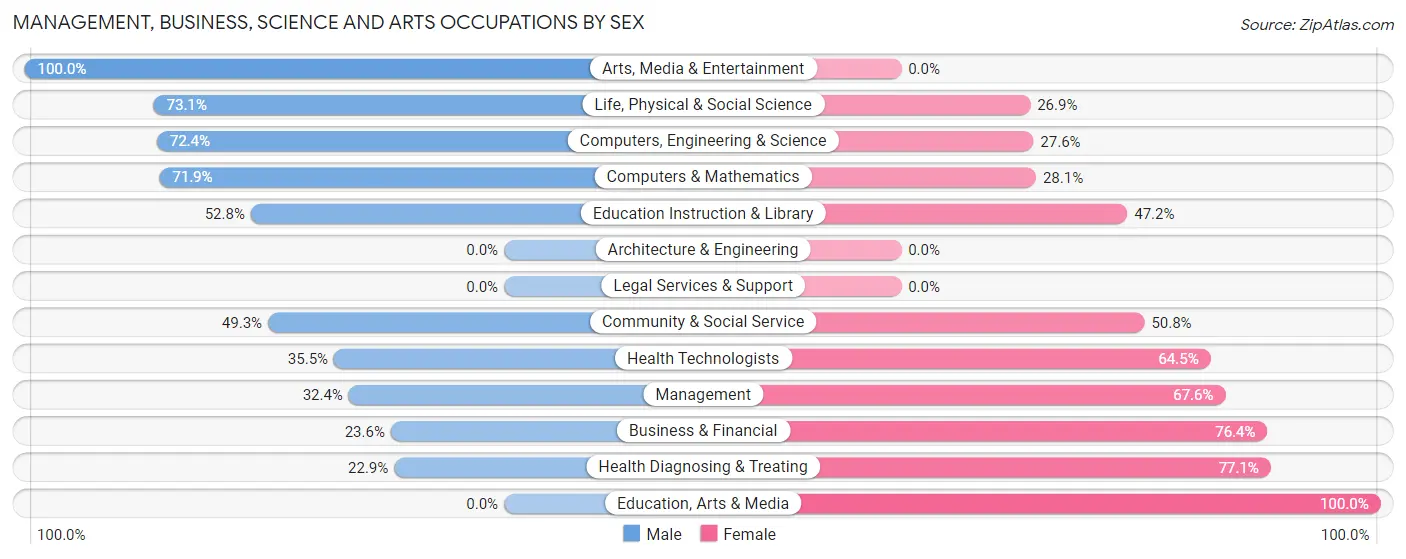
Management, Business, Science and Arts Occupations by Sex
Within the Management, Business, Science and Arts occupations in Everson, the most male-oriented occupations are Arts, Media & Entertainment (100.0%), Life, Physical & Social Science (73.1%), and Computers, Engineering & Science (72.4%), while the most female-oriented occupations are Education, Arts & Media (100.0%), Health Diagnosing & Treating (77.1%), and Business & Financial (76.4%).
| Occupation | Male | Female |
| Management | 46 (32.4%) | 96 (67.6%) |
| Business & Financial | 30 (23.6%) | 97 (76.4%) |
| Computers, Engineering & Science | 42 (72.4%) | 16 (27.6%) |
| Computers & Mathematics | 23 (71.9%) | 9 (28.1%) |
| Architecture & Engineering | 0 (0.0%) | 0 (0.0%) |
| Life, Physical & Social Science | 19 (73.1%) | 7 (26.9%) |
| Community & Social Service | 33 (49.2%) | 34 (50.7%) |
| Education, Arts & Media | 0 (0.0%) | 9 (100.0%) |
| Legal Services & Support | 0 (0.0%) | 0 (0.0%) |
| Education Instruction & Library | 28 (52.8%) | 25 (47.2%) |
| Arts, Media & Entertainment | 5 (100.0%) | 0 (0.0%) |
| Health Diagnosing & Treating | 11 (22.9%) | 37 (77.1%) |
| Health Technologists | 11 (35.5%) | 20 (64.5%) |
| Total (Category) | 162 (36.6%) | 280 (63.3%) |
| Total (Overall) | 703 (51.8%) | 655 (48.2%) |
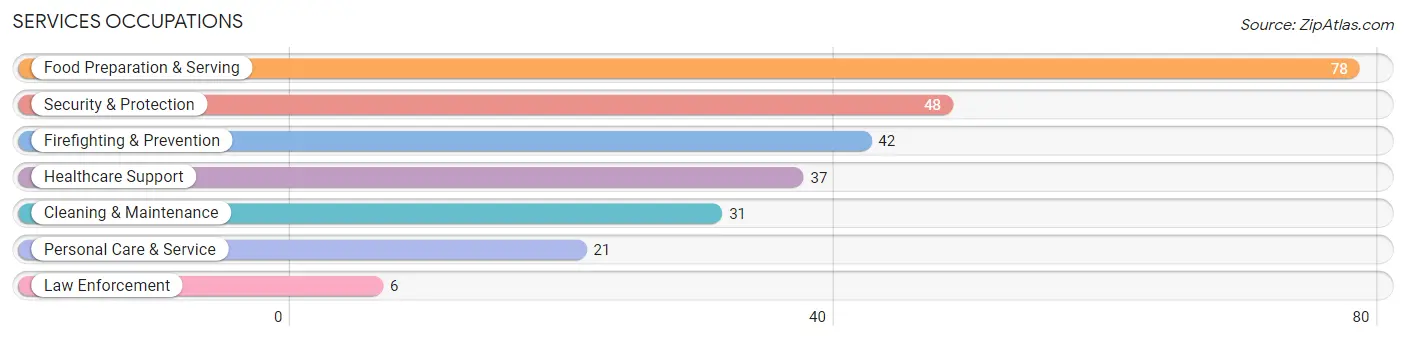
Services Occupations
The most common Services occupations in Everson are Food Preparation & Serving (78 | 5.7%), Security & Protection (48 | 3.5%), Firefighting & Prevention (42 | 3.1%), Healthcare Support (37 | 2.7%), and Cleaning & Maintenance (31 | 2.3%).
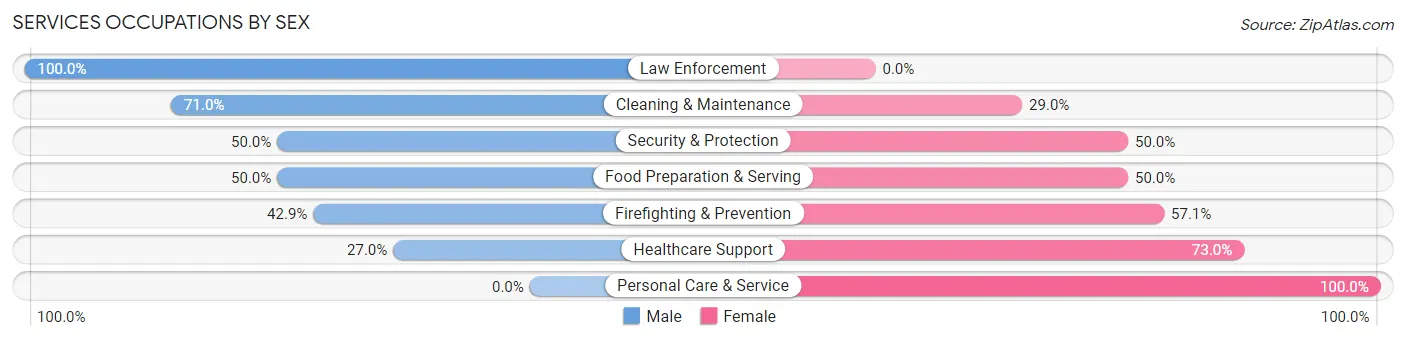
Services Occupations by Sex
Within the Services occupations in Everson, the most male-oriented occupations are Law Enforcement (100.0%), Cleaning & Maintenance (71.0%), and Security & Protection (50.0%), while the most female-oriented occupations are Personal Care & Service (100.0%), Healthcare Support (73.0%), and Firefighting & Prevention (57.1%).
| Occupation | Male | Female |
| Healthcare Support | 10 (27.0%) | 27 (73.0%) |
| Security & Protection | 24 (50.0%) | 24 (50.0%) |
| Firefighting & Prevention | 18 (42.9%) | 24 (57.1%) |
| Law Enforcement | 6 (100.0%) | 0 (0.0%) |
| Food Preparation & Serving | 39 (50.0%) | 39 (50.0%) |
| Cleaning & Maintenance | 22 (71.0%) | 9 (29.0%) |
| Personal Care & Service | 0 (0.0%) | 21 (100.0%) |
| Total (Category) | 95 (44.2%) | 120 (55.8%) |
| Total (Overall) | 703 (51.8%) | 655 (48.2%) |
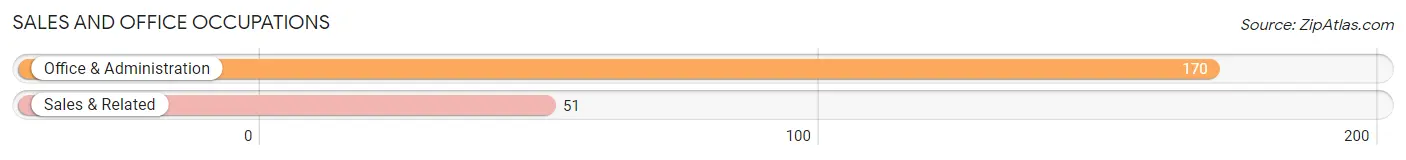
Sales and Office Occupations
The most common Sales and Office occupations in Everson are Office & Administration (170 | 12.5%), and Sales & Related (51 | 3.8%).
Sales and Office Occupations by Sex
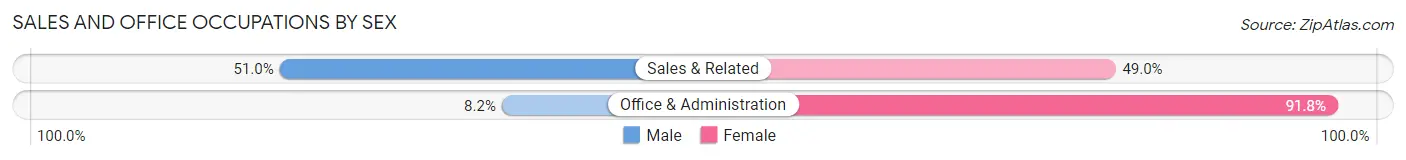
| Occupation | Male | Female |
| Sales & Related | 26 (51.0%) | 25 (49.0%) |
| Office & Administration | 14 (8.2%) | 156 (91.8%) |
| Total (Category) | 40 (18.1%) | 181 (81.9%) |
| Total (Overall) | 703 (51.8%) | 655 (48.2%) |
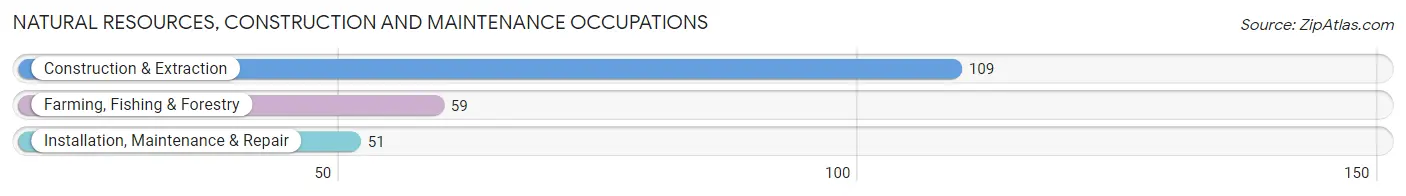
Natural Resources, Construction and Maintenance Occupations
The most common Natural Resources, Construction and Maintenance occupations in Everson are Construction & Extraction (109 | 8.0%), Farming, Fishing & Forestry (59 | 4.3%), and Installation, Maintenance & Repair (51 | 3.8%).
Natural Resources, Construction and Maintenance Occupations by Sex
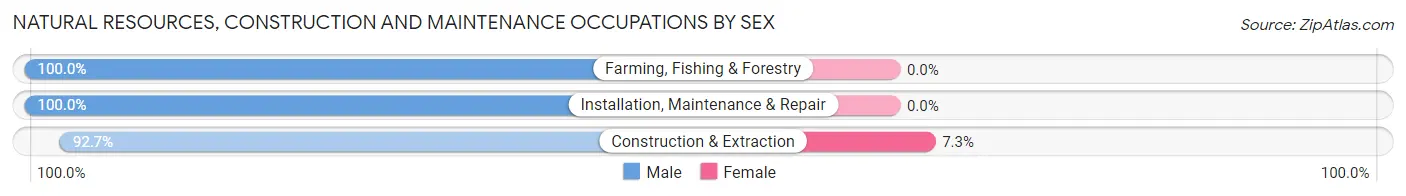
| Occupation | Male | Female |
| Farming, Fishing & Forestry | 59 (100.0%) | 0 (0.0%) |
| Construction & Extraction | 101 (92.7%) | 8 (7.3%) |
| Installation, Maintenance & Repair | 51 (100.0%) | 0 (0.0%) |
| Total (Category) | 211 (96.4%) | 8 (3.6%) |
| Total (Overall) | 703 (51.8%) | 655 (48.2%) |
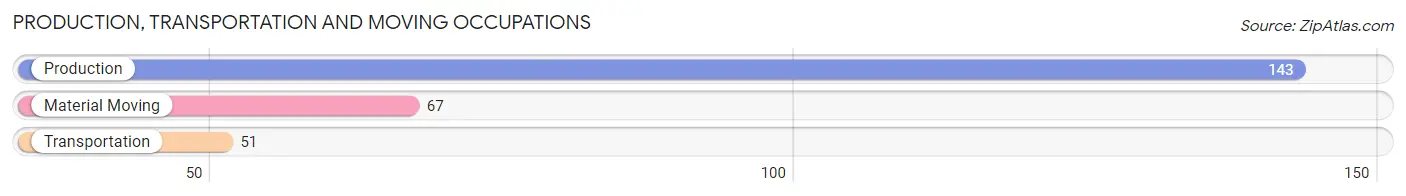
Production, Transportation and Moving Occupations
The most common Production, Transportation and Moving occupations in Everson are Production (143 | 10.5%), Material Moving (67 | 4.9%), and Transportation (51 | 3.8%).
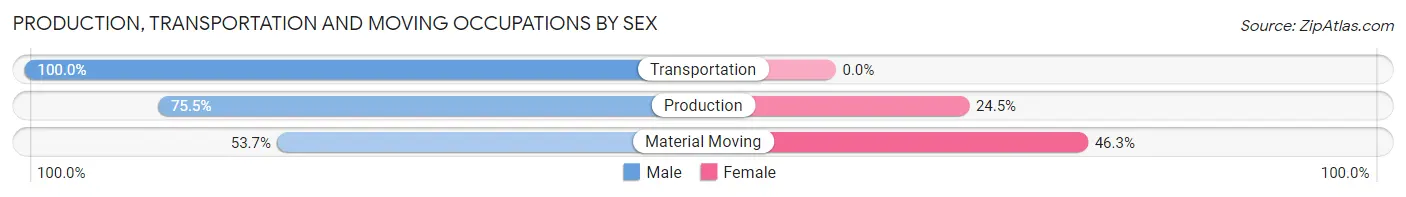
Production, Transportation and Moving Occupations by Sex
| Occupation | Male | Female |
| Production | 108 (75.5%) | 35 (24.5%) |
| Transportation | 51 (100.0%) | 0 (0.0%) |
| Material Moving | 36 (53.7%) | 31 (46.3%) |
| Total (Category) | 195 (74.7%) | 66 (25.3%) |
| Total (Overall) | 703 (51.8%) | 655 (48.2%) |
Employment Industries by Sex in Everson
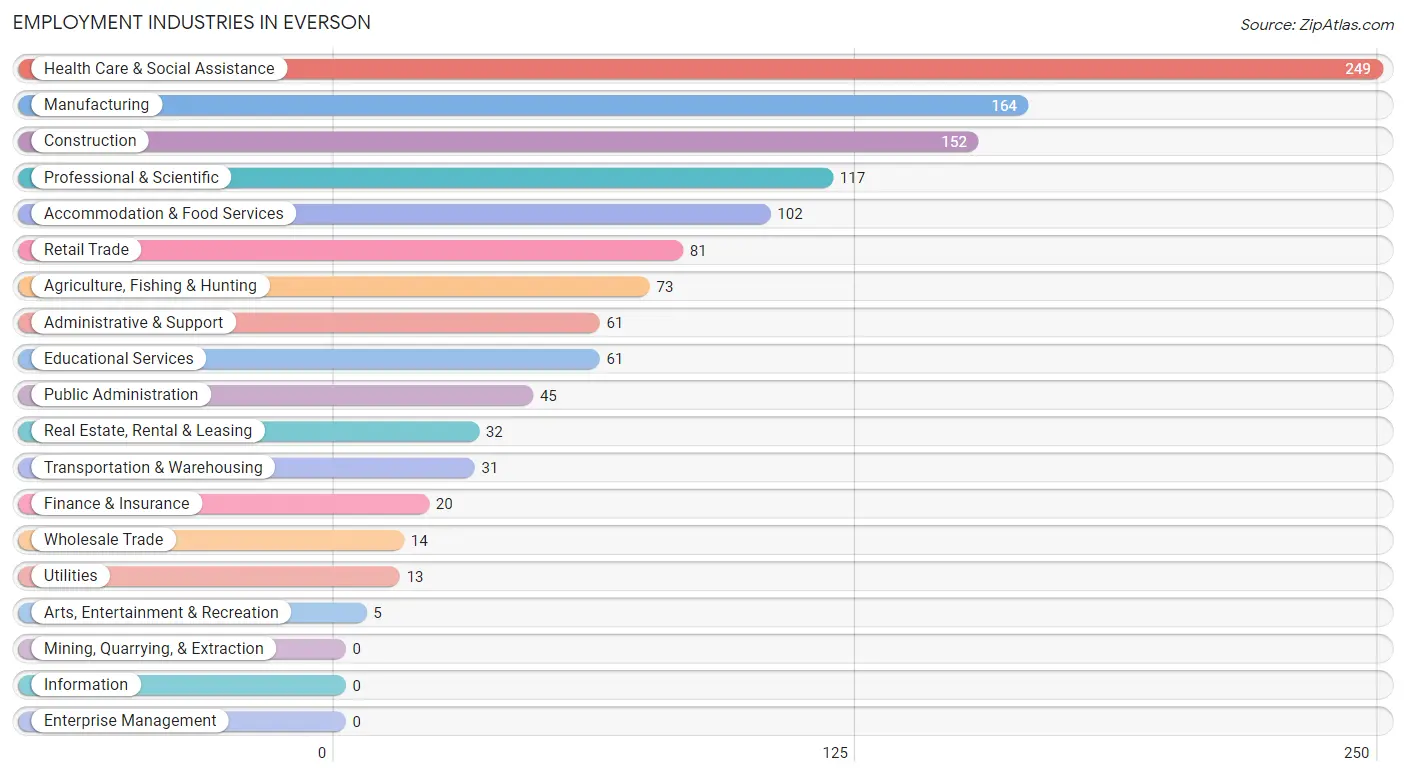
Employment Industries in Everson
The major employment industries in Everson include Health Care & Social Assistance (249 | 18.3%), Manufacturing (164 | 12.1%), Construction (152 | 11.2%), Professional & Scientific (117 | 8.6%), and Accommodation & Food Services (102 | 7.5%).
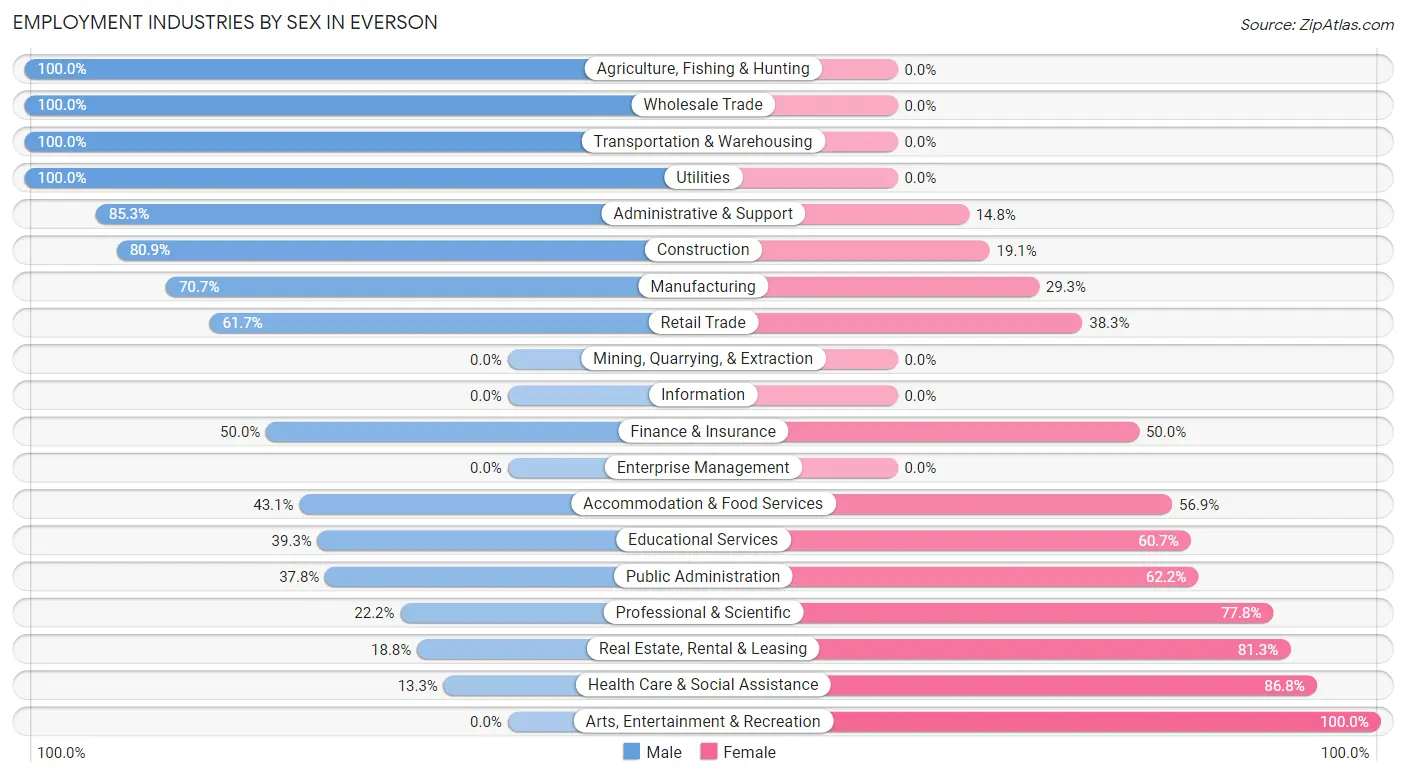
Employment Industries by Sex in Everson
The Everson industries that see more men than women are Agriculture, Fishing & Hunting (100.0%), Wholesale Trade (100.0%), and Transportation & Warehousing (100.0%), whereas the industries that tend to have a higher number of women are Arts, Entertainment & Recreation (100.0%), Health Care & Social Assistance (86.8%), and Real Estate, Rental & Leasing (81.2%).
| Industry | Male | Female |
| Agriculture, Fishing & Hunting | 73 (100.0%) | 0 (0.0%) |
| Mining, Quarrying, & Extraction | 0 (0.0%) | 0 (0.0%) |
| Construction | 123 (80.9%) | 29 (19.1%) |
| Manufacturing | 116 (70.7%) | 48 (29.3%) |
| Wholesale Trade | 14 (100.0%) | 0 (0.0%) |
| Retail Trade | 50 (61.7%) | 31 (38.3%) |
| Transportation & Warehousing | 31 (100.0%) | 0 (0.0%) |
| Utilities | 13 (100.0%) | 0 (0.0%) |
| Information | 0 (0.0%) | 0 (0.0%) |
| Finance & Insurance | 10 (50.0%) | 10 (50.0%) |
| Real Estate, Rental & Leasing | 6 (18.8%) | 26 (81.2%) |
| Professional & Scientific | 26 (22.2%) | 91 (77.8%) |
| Enterprise Management | 0 (0.0%) | 0 (0.0%) |
| Administrative & Support | 52 (85.3%) | 9 (14.7%) |
| Educational Services | 24 (39.3%) | 37 (60.7%) |
| Health Care & Social Assistance | 33 (13.3%) | 216 (86.8%) |
| Arts, Entertainment & Recreation | 0 (0.0%) | 5 (100.0%) |
| Accommodation & Food Services | 44 (43.1%) | 58 (56.9%) |
| Public Administration | 17 (37.8%) | 28 (62.2%) |
| Total | 703 (51.8%) | 655 (48.2%) |
Education in Everson
School Enrollment in Everson
The most common levels of schooling among the 817 students in Everson are college / undergraduate (207 | 25.3%), elementary school (202 | 24.7%), and middle school (155 | 19.0%).
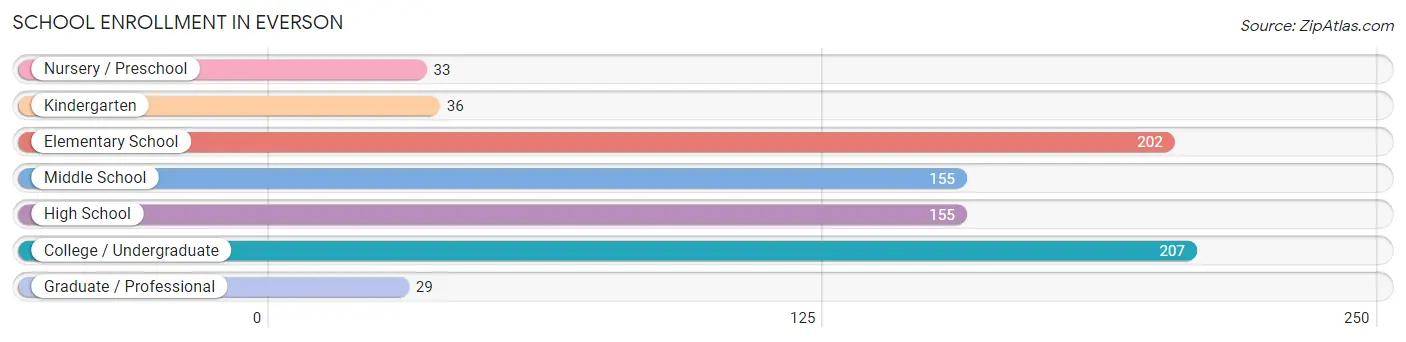
| School Level | # Students | % Students |
| Nursery / Preschool | 33 | 4.0% |
| Kindergarten | 36 | 4.4% |
| Elementary School | 202 | 24.7% |
| Middle School | 155 | 19.0% |
| High School | 155 | 19.0% |
| College / Undergraduate | 207 | 25.3% |
| Graduate / Professional | 29 | 3.5% |
| Total | 817 | 100.0% |
School Enrollment by Age by Funding Source in Everson
Out of a total of 817 students who are enrolled in schools in Everson, 220 (26.9%) attend a private institution, while the remaining 597 (73.1%) are enrolled in public schools. The age group of 35 years and over has the highest likelihood of being enrolled in private schools, with 48 (100.0% in the age bracket) enrolled. Conversely, the age group of 3 to 4 year olds has the lowest likelihood of being enrolled in a private school, with 15 (100.0% in the age bracket) attending a public institution.
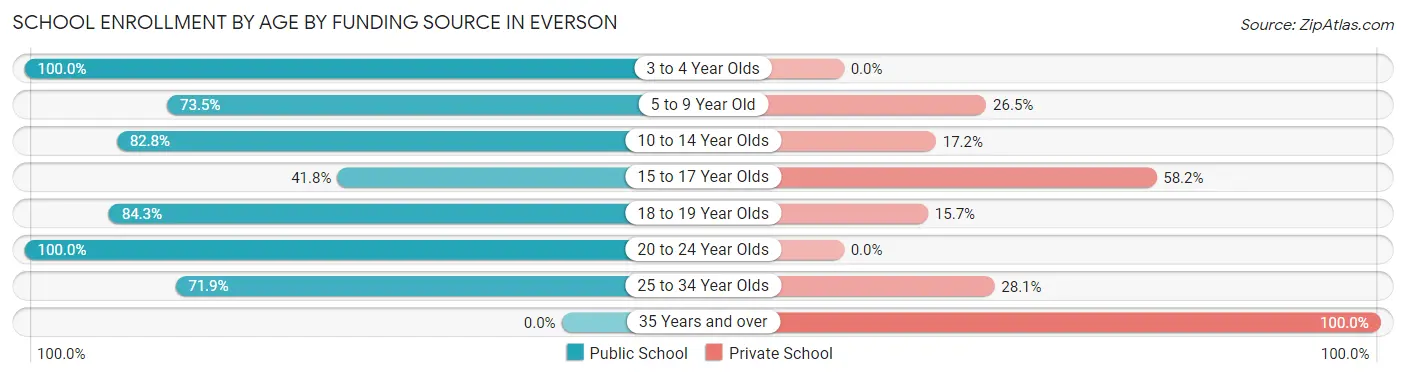
| Age Bracket | Public School | Private School |
| 3 to 4 Year Olds | 15 (100.0%) | 0 (0.0%) |
| 5 to 9 Year Old | 155 (73.5%) | 56 (26.5%) |
| 10 to 14 Year Olds | 222 (82.8%) | 46 (17.2%) |
| 15 to 17 Year Olds | 33 (41.8%) | 46 (58.2%) |
| 18 to 19 Year Olds | 43 (84.3%) | 8 (15.7%) |
| 20 to 24 Year Olds | 88 (100.0%) | 0 (0.0%) |
| 25 to 34 Year Olds | 41 (71.9%) | 16 (28.1%) |
| 35 Years and over | 0 (0.0%) | 48 (100.0%) |
| Total | 597 (73.1%) | 220 (26.9%) |
Educational Attainment by Field of Study in Everson
Bio, nature & agricultural (113 | 22.0%), business (89 | 17.3%), science & technology (71 | 13.8%), arts & humanities (65 | 12.7%), and education (40 | 7.8%) are the most common fields of study among 513 individuals in Everson who have obtained a bachelor's degree or higher.
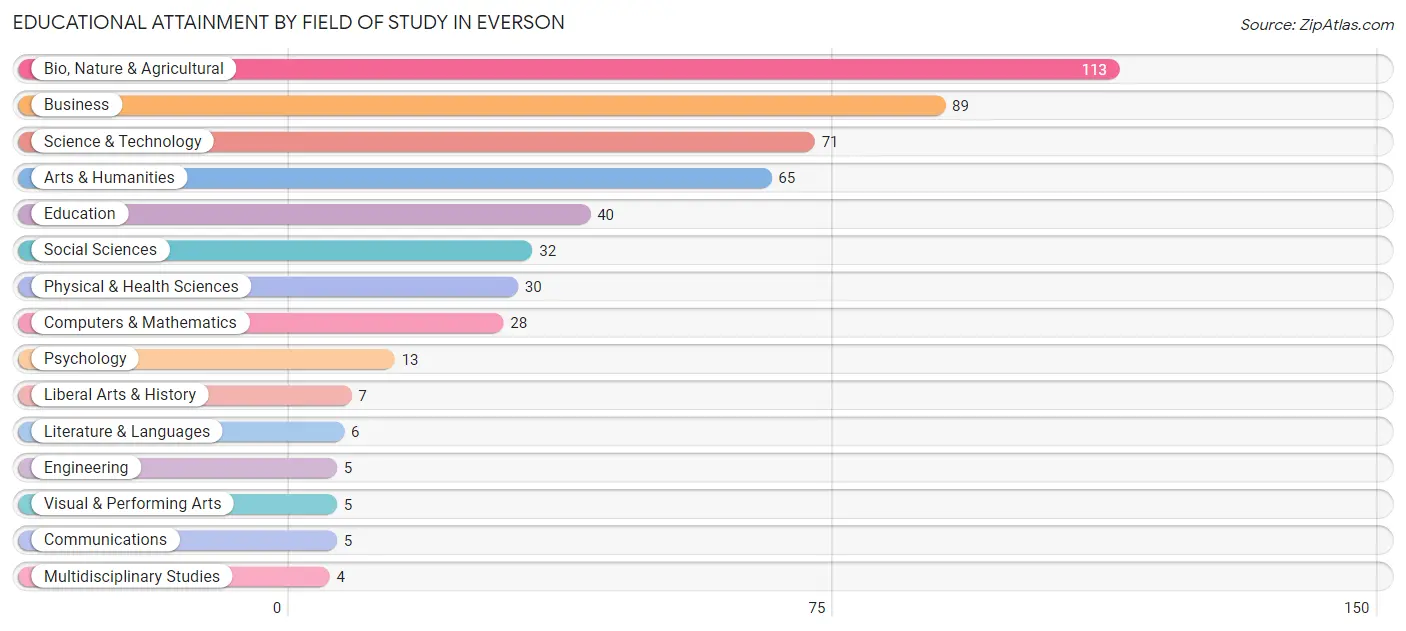
| Field of Study | # Graduates | % Graduates |
| Computers & Mathematics | 28 | 5.5% |
| Bio, Nature & Agricultural | 113 | 22.0% |
| Physical & Health Sciences | 30 | 5.9% |
| Psychology | 13 | 2.5% |
| Social Sciences | 32 | 6.2% |
| Engineering | 5 | 1.0% |
| Multidisciplinary Studies | 4 | 0.8% |
| Science & Technology | 71 | 13.8% |
| Business | 89 | 17.3% |
| Education | 40 | 7.8% |
| Literature & Languages | 6 | 1.2% |
| Liberal Arts & History | 7 | 1.4% |
| Visual & Performing Arts | 5 | 1.0% |
| Communications | 5 | 1.0% |
| Arts & Humanities | 65 | 12.7% |
| Total | 513 | 100.0% |
Transportation & Commute in Everson
Vehicle Availability by Sex in Everson
The most prevalent vehicle ownership categories in Everson are males with 3 vehicles (279, accounting for 39.9%) and females with 3 vehicles (165, making up 43.0%).
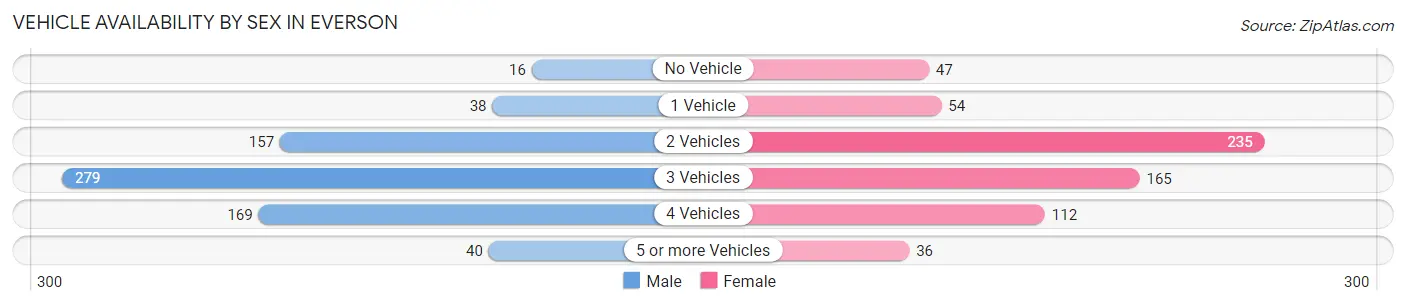
| Vehicles Available | Male | Female |
| No Vehicle | 16 (2.3%) | 47 (7.2%) |
| 1 Vehicle | 38 (5.4%) | 54 (8.3%) |
| 2 Vehicles | 157 (22.5%) | 235 (36.2%) |
| 3 Vehicles | 279 (39.9%) | 165 (25.4%) |
| 4 Vehicles | 169 (24.2%) | 112 (17.3%) |
| 5 or more Vehicles | 40 (5.7%) | 36 (5.6%) |
| Total | 699 (100.0%) | 649 (100.0%) |
Commute Time in Everson
The most frequently occuring commute durations in Everson are 20 to 24 minutes (229 commuters, 17.9%), 30 to 34 minutes (202 commuters, 15.8%), and 25 to 29 minutes (188 commuters, 14.7%).
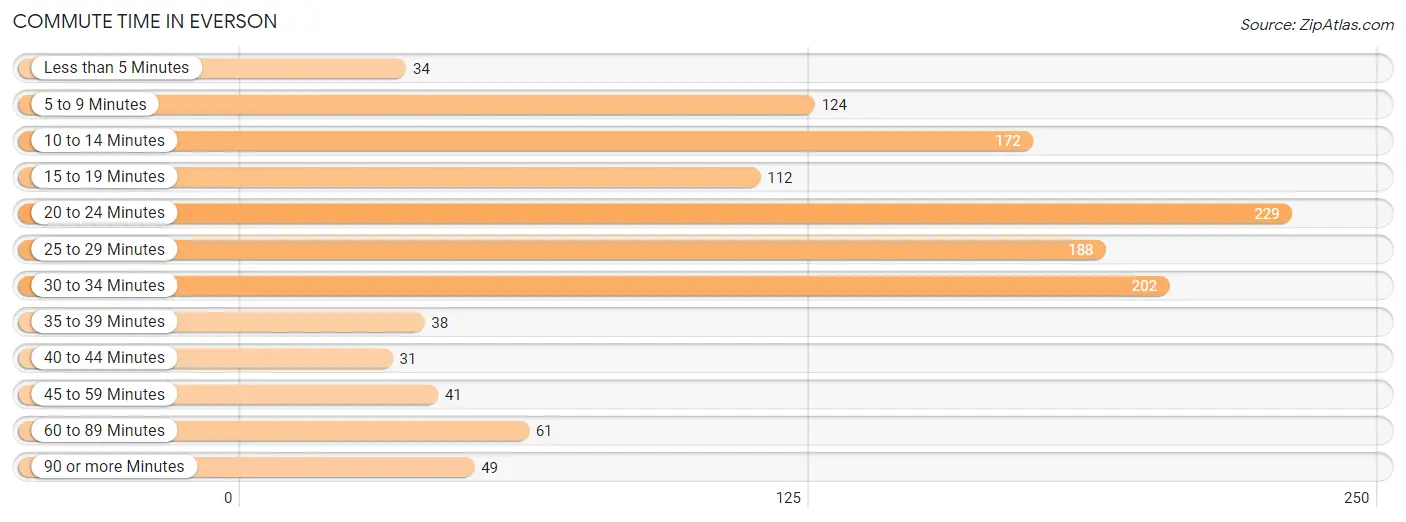
| Commute Time | # Commuters | % Commuters |
| Less than 5 Minutes | 34 | 2.6% |
| 5 to 9 Minutes | 124 | 9.7% |
| 10 to 14 Minutes | 172 | 13.4% |
| 15 to 19 Minutes | 112 | 8.7% |
| 20 to 24 Minutes | 229 | 17.9% |
| 25 to 29 Minutes | 188 | 14.7% |
| 30 to 34 Minutes | 202 | 15.8% |
| 35 to 39 Minutes | 38 | 3.0% |
| 40 to 44 Minutes | 31 | 2.4% |
| 45 to 59 Minutes | 41 | 3.2% |
| 60 to 89 Minutes | 61 | 4.8% |
| 90 or more Minutes | 49 | 3.8% |
Commute Time by Sex in Everson
The most common commute times in Everson are 5 to 9 minutes (102 commuters, 15.4%) for males and 30 to 34 minutes (136 commuters, 21.9%) for females.
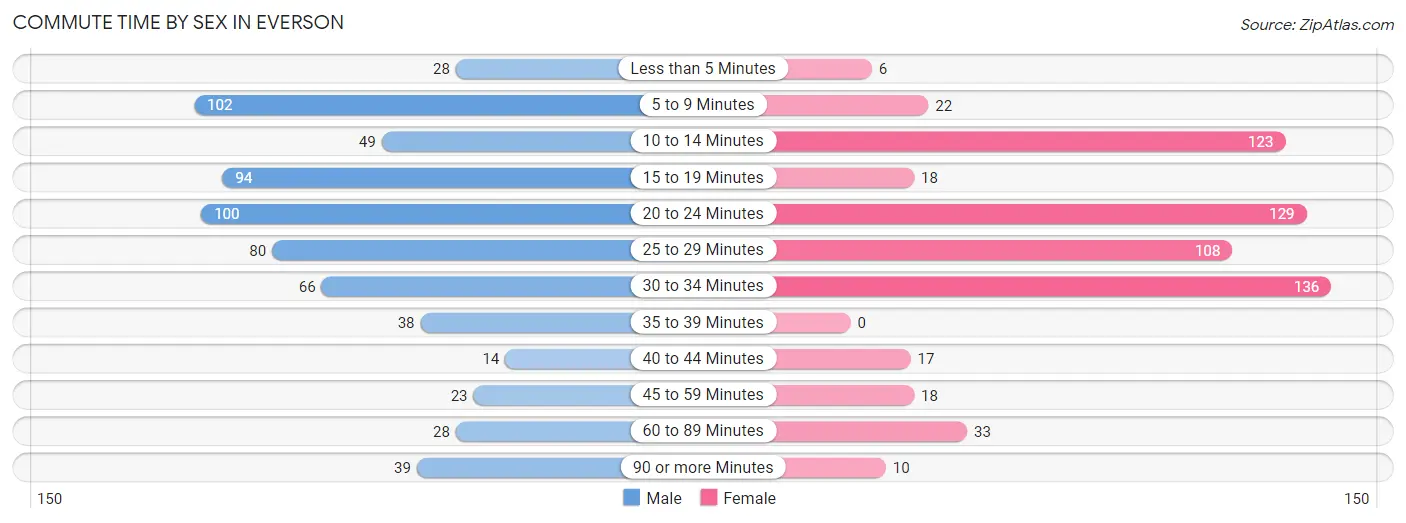
| Commute Time | Male | Female |
| Less than 5 Minutes | 28 (4.2%) | 6 (1.0%) |
| 5 to 9 Minutes | 102 (15.4%) | 22 (3.5%) |
| 10 to 14 Minutes | 49 (7.4%) | 123 (19.8%) |
| 15 to 19 Minutes | 94 (14.2%) | 18 (2.9%) |
| 20 to 24 Minutes | 100 (15.1%) | 129 (20.8%) |
| 25 to 29 Minutes | 80 (12.1%) | 108 (17.4%) |
| 30 to 34 Minutes | 66 (10.0%) | 136 (21.9%) |
| 35 to 39 Minutes | 38 (5.8%) | 0 (0.0%) |
| 40 to 44 Minutes | 14 (2.1%) | 17 (2.7%) |
| 45 to 59 Minutes | 23 (3.5%) | 18 (2.9%) |
| 60 to 89 Minutes | 28 (4.2%) | 33 (5.3%) |
| 90 or more Minutes | 39 (5.9%) | 10 (1.6%) |
Time of Departure to Work by Sex in Everson
The most frequent times of departure to work in Everson are 7:00 AM to 7:29 AM (131, 19.8%) for males and 7:00 AM to 7:29 AM (124, 20.0%) for females.
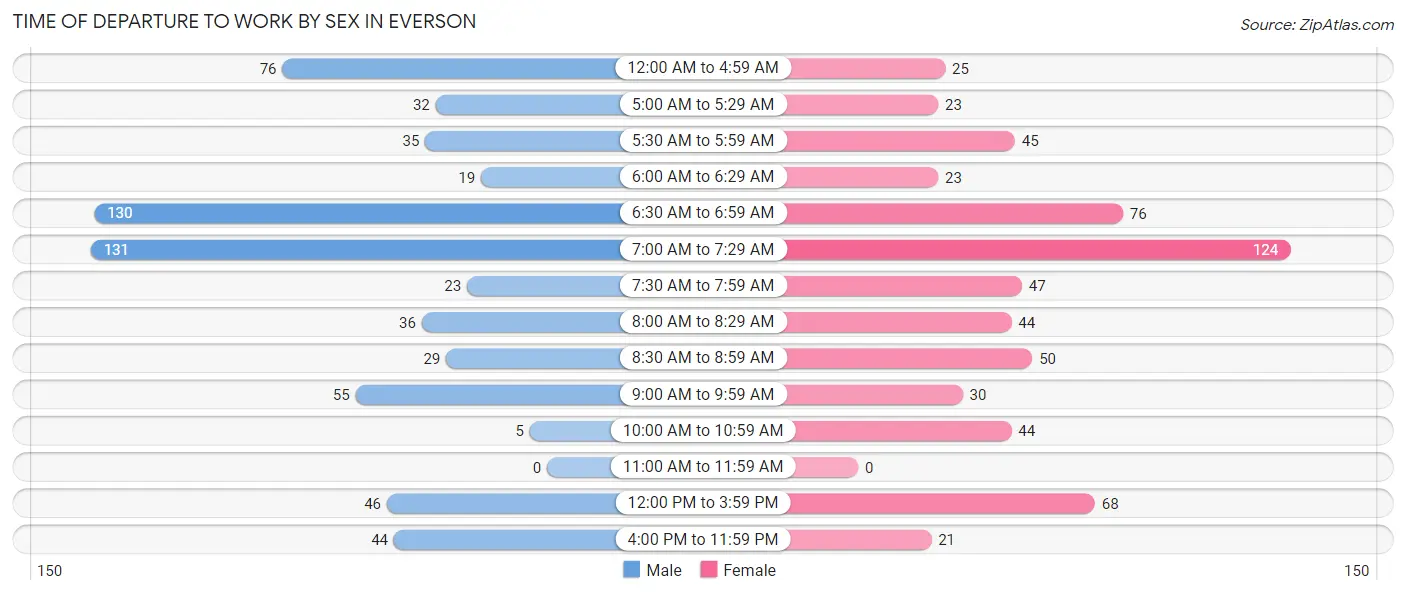
| Time of Departure | Male | Female |
| 12:00 AM to 4:59 AM | 76 (11.5%) | 25 (4.0%) |
| 5:00 AM to 5:29 AM | 32 (4.8%) | 23 (3.7%) |
| 5:30 AM to 5:59 AM | 35 (5.3%) | 45 (7.3%) |
| 6:00 AM to 6:29 AM | 19 (2.9%) | 23 (3.7%) |
| 6:30 AM to 6:59 AM | 130 (19.7%) | 76 (12.3%) |
| 7:00 AM to 7:29 AM | 131 (19.8%) | 124 (20.0%) |
| 7:30 AM to 7:59 AM | 23 (3.5%) | 47 (7.6%) |
| 8:00 AM to 8:29 AM | 36 (5.4%) | 44 (7.1%) |
| 8:30 AM to 8:59 AM | 29 (4.4%) | 50 (8.1%) |
| 9:00 AM to 9:59 AM | 55 (8.3%) | 30 (4.8%) |
| 10:00 AM to 10:59 AM | 5 (0.8%) | 44 (7.1%) |
| 11:00 AM to 11:59 AM | 0 (0.0%) | 0 (0.0%) |
| 12:00 PM to 3:59 PM | 46 (7.0%) | 68 (11.0%) |
| 4:00 PM to 11:59 PM | 44 (6.7%) | 21 (3.4%) |
| Total | 661 (100.0%) | 620 (100.0%) |
Housing Occupancy in Everson
Occupancy by Ownership in Everson
Of the total 1,045 dwellings in Everson, owner-occupied units account for 653 (62.5%), while renter-occupied units make up 392 (37.5%).
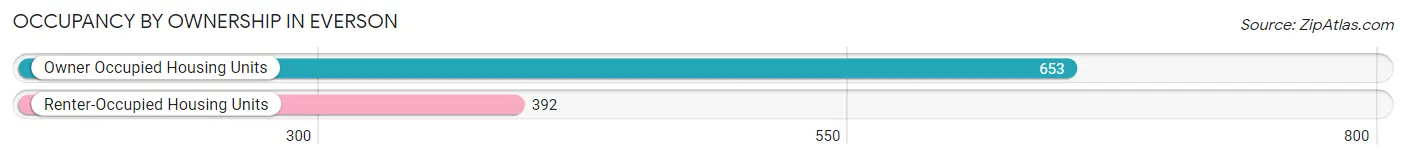
| Occupancy | # Housing Units | % Housing Units |
| Owner Occupied Housing Units | 653 | 62.5% |
| Renter-Occupied Housing Units | 392 | 37.5% |
| Total Occupied Housing Units | 1,045 | 100.0% |
Occupancy by Household Size in Everson
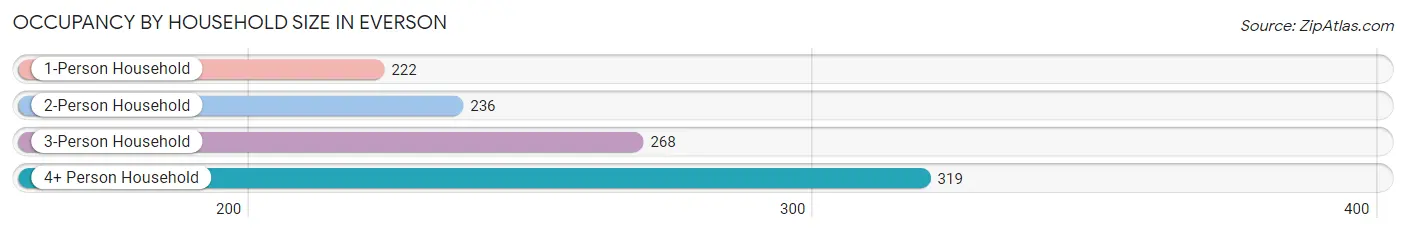
| Household Size | # Housing Units | % Housing Units |
| 1-Person Household | 222 | 21.2% |
| 2-Person Household | 236 | 22.6% |
| 3-Person Household | 268 | 25.7% |
| 4+ Person Household | 319 | 30.5% |
| Total Housing Units | 1,045 | 100.0% |
Occupancy by Ownership by Household Size in Everson
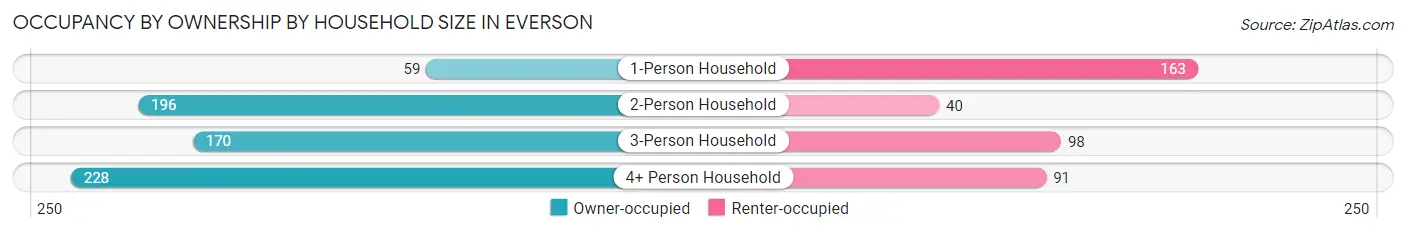
| Household Size | Owner-occupied | Renter-occupied |
| 1-Person Household | 59 (26.6%) | 163 (73.4%) |
| 2-Person Household | 196 (83.1%) | 40 (17.0%) |
| 3-Person Household | 170 (63.4%) | 98 (36.6%) |
| 4+ Person Household | 228 (71.5%) | 91 (28.5%) |
| Total Housing Units | 653 (62.5%) | 392 (37.5%) |
Occupancy by Educational Attainment in Everson
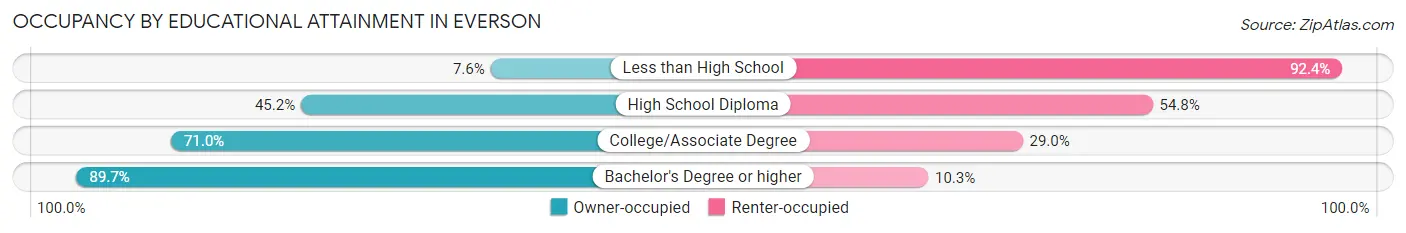
| Household Size | Owner-occupied | Renter-occupied |
| Less than High School | 7 (7.6%) | 85 (92.4%) |
| High School Diploma | 146 (45.2%) | 177 (54.8%) |
| College/Associate Degree | 247 (71.0%) | 101 (29.0%) |
| Bachelor's Degree or higher | 253 (89.7%) | 29 (10.3%) |
Occupancy by Age of Householder in Everson
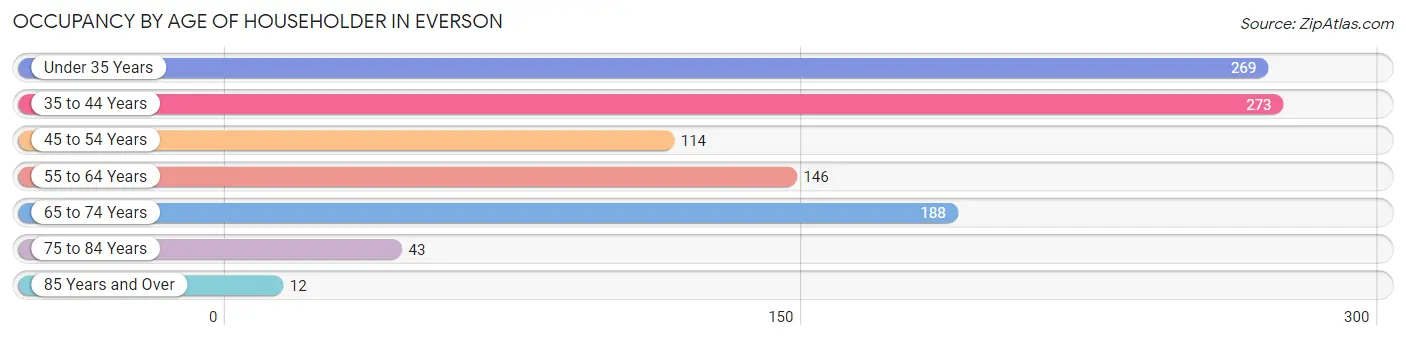
| Age Bracket | # Households | % Households |
| Under 35 Years | 269 | 25.7% |
| 35 to 44 Years | 273 | 26.1% |
| 45 to 54 Years | 114 | 10.9% |
| 55 to 64 Years | 146 | 14.0% |
| 65 to 74 Years | 188 | 18.0% |
| 75 to 84 Years | 43 | 4.1% |
| 85 Years and Over | 12 | 1.1% |
| Total | 1,045 | 100.0% |
Housing Finances in Everson
Median Income by Occupancy in Everson
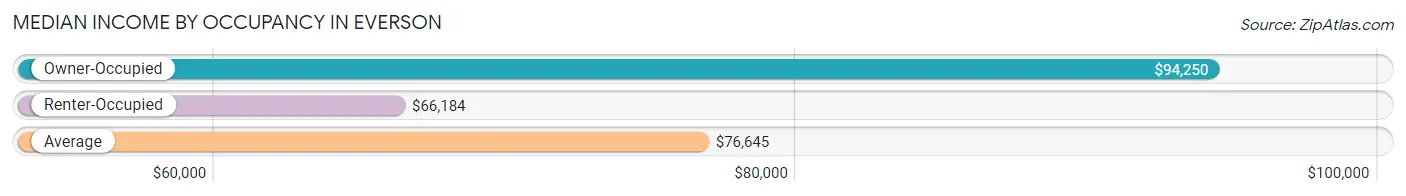
| Occupancy Type | # Households | Median Income |
| Owner-Occupied | 653 (62.5%) | $94,250 |
| Renter-Occupied | 392 (37.5%) | $66,184 |
| Average | 1,045 (100.0%) | $76,645 |
Occupancy by Householder Income Bracket in Everson
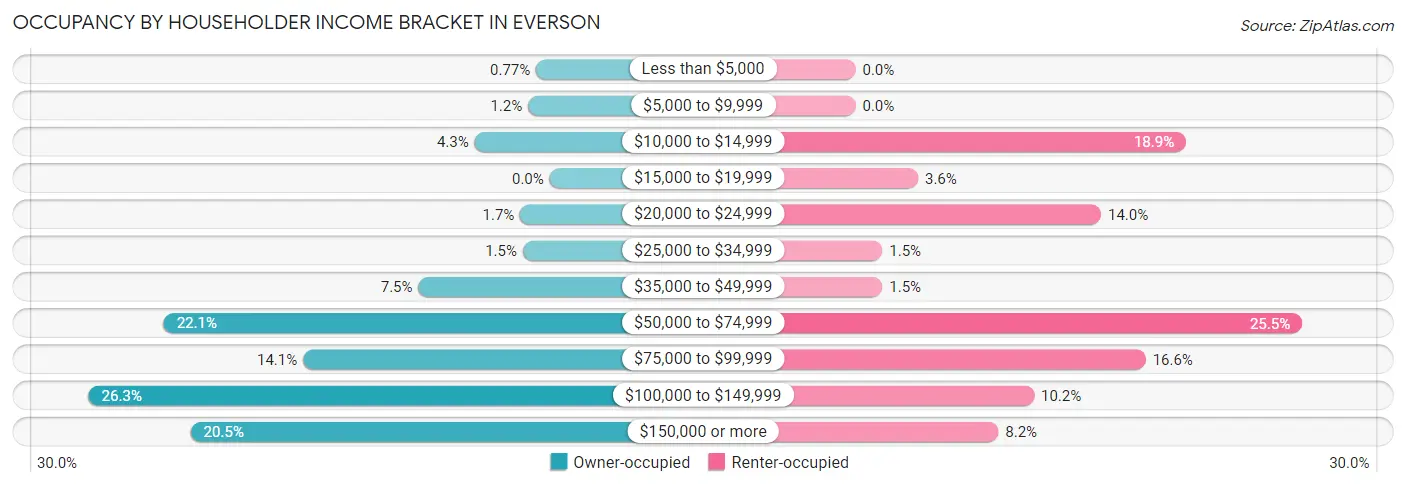
| Income Bracket | Owner-occupied | Renter-occupied |
| Less than $5,000 | 5 (0.8%) | 0 (0.0%) |
| $5,000 to $9,999 | 8 (1.2%) | 0 (0.0%) |
| $10,000 to $14,999 | 28 (4.3%) | 74 (18.9%) |
| $15,000 to $19,999 | 0 (0.0%) | 14 (3.6%) |
| $20,000 to $24,999 | 11 (1.7%) | 55 (14.0%) |
| $25,000 to $34,999 | 10 (1.5%) | 6 (1.5%) |
| $35,000 to $49,999 | 49 (7.5%) | 6 (1.5%) |
| $50,000 to $74,999 | 144 (22.1%) | 100 (25.5%) |
| $75,000 to $99,999 | 92 (14.1%) | 65 (16.6%) |
| $100,000 to $149,999 | 172 (26.3%) | 40 (10.2%) |
| $150,000 or more | 134 (20.5%) | 32 (8.2%) |
| Total | 653 (100.0%) | 392 (100.0%) |
Monthly Housing Cost Tiers in Everson
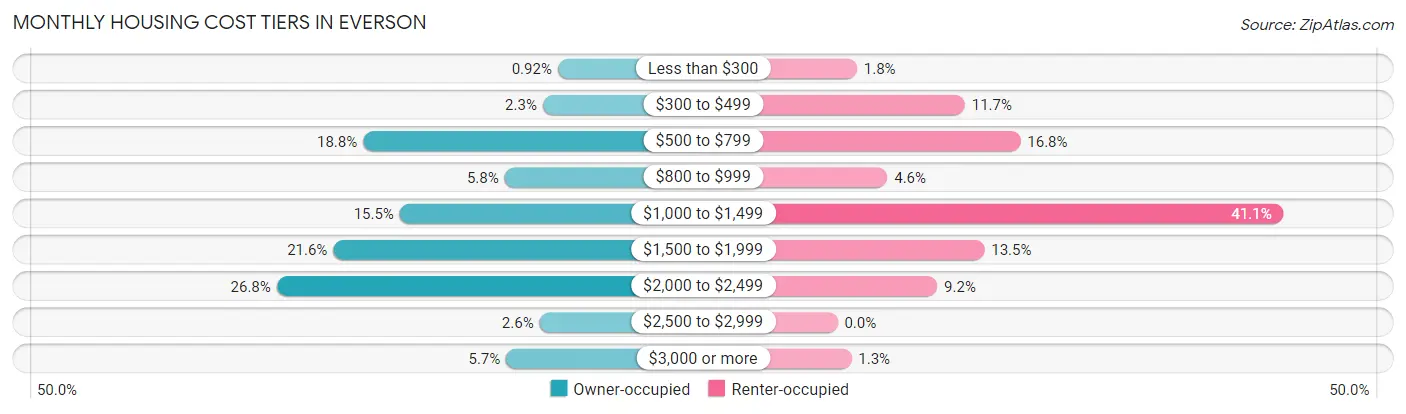
| Monthly Cost | Owner-occupied | Renter-occupied |
| Less than $300 | 6 (0.9%) | 7 (1.8%) |
| $300 to $499 | 15 (2.3%) | 46 (11.7%) |
| $500 to $799 | 123 (18.8%) | 66 (16.8%) |
| $800 to $999 | 38 (5.8%) | 18 (4.6%) |
| $1,000 to $1,499 | 101 (15.5%) | 161 (41.1%) |
| $1,500 to $1,999 | 141 (21.6%) | 53 (13.5%) |
| $2,000 to $2,499 | 175 (26.8%) | 36 (9.2%) |
| $2,500 to $2,999 | 17 (2.6%) | 0 (0.0%) |
| $3,000 or more | 37 (5.7%) | 5 (1.3%) |
| Total | 653 (100.0%) | 392 (100.0%) |
Physical Housing Characteristics in Everson
Housing Structures in Everson
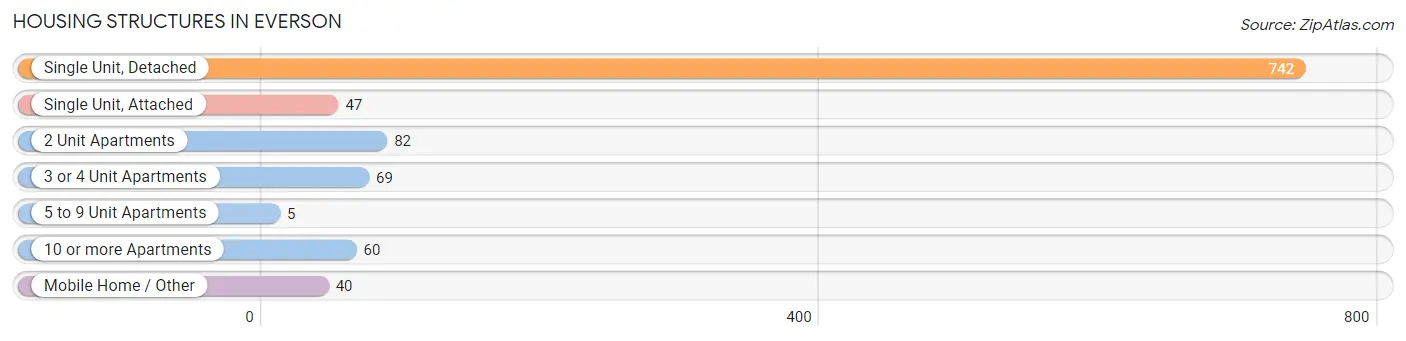
| Structure Type | # Housing Units | % Housing Units |
| Single Unit, Detached | 742 | 71.0% |
| Single Unit, Attached | 47 | 4.5% |
| 2 Unit Apartments | 82 | 7.9% |
| 3 or 4 Unit Apartments | 69 | 6.6% |
| 5 to 9 Unit Apartments | 5 | 0.5% |
| 10 or more Apartments | 60 | 5.7% |
| Mobile Home / Other | 40 | 3.8% |
| Total | 1,045 | 100.0% |
Housing Structures by Occupancy in Everson
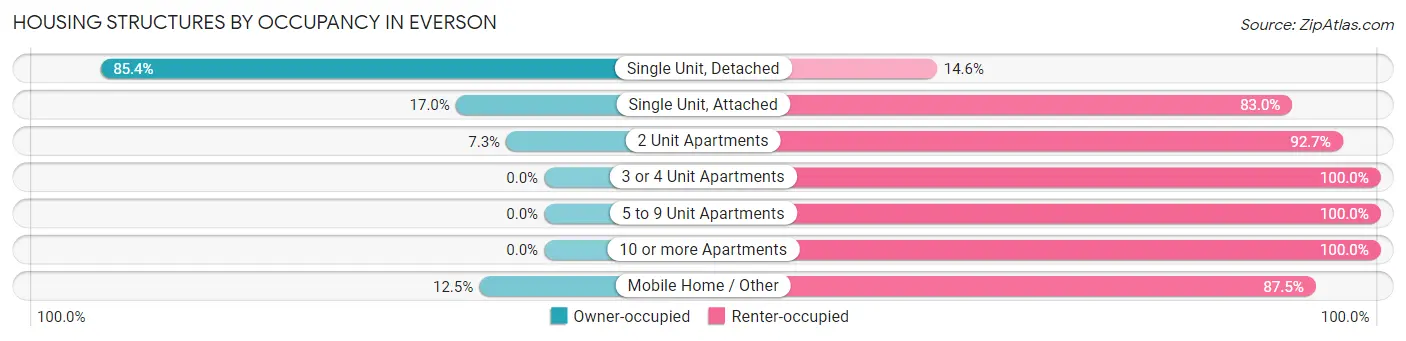
| Structure Type | Owner-occupied | Renter-occupied |
| Single Unit, Detached | 634 (85.4%) | 108 (14.6%) |
| Single Unit, Attached | 8 (17.0%) | 39 (83.0%) |
| 2 Unit Apartments | 6 (7.3%) | 76 (92.7%) |
| 3 or 4 Unit Apartments | 0 (0.0%) | 69 (100.0%) |
| 5 to 9 Unit Apartments | 0 (0.0%) | 5 (100.0%) |
| 10 or more Apartments | 0 (0.0%) | 60 (100.0%) |
| Mobile Home / Other | 5 (12.5%) | 35 (87.5%) |
| Total | 653 (62.5%) | 392 (37.5%) |
Housing Structures by Number of Rooms in Everson
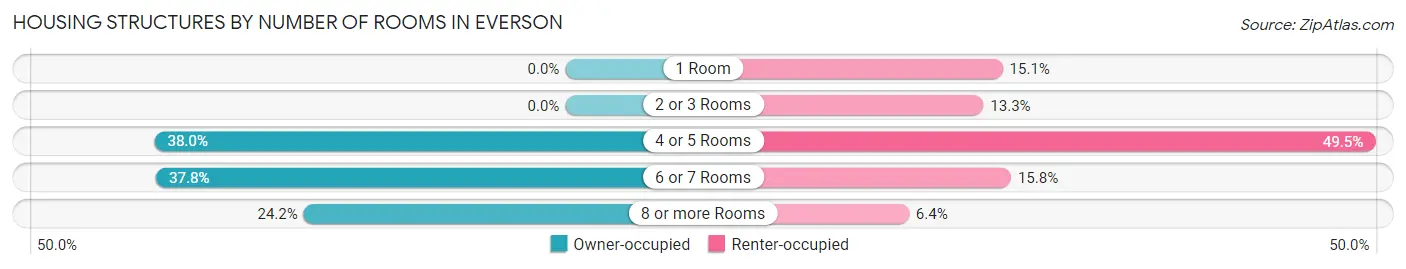
| Number of Rooms | Owner-occupied | Renter-occupied |
| 1 Room | 0 (0.0%) | 59 (15.0%) |
| 2 or 3 Rooms | 0 (0.0%) | 52 (13.3%) |
| 4 or 5 Rooms | 248 (38.0%) | 194 (49.5%) |
| 6 or 7 Rooms | 247 (37.8%) | 62 (15.8%) |
| 8 or more Rooms | 158 (24.2%) | 25 (6.4%) |
| Total | 653 (100.0%) | 392 (100.0%) |
Housing Structure by Heating Type in Everson
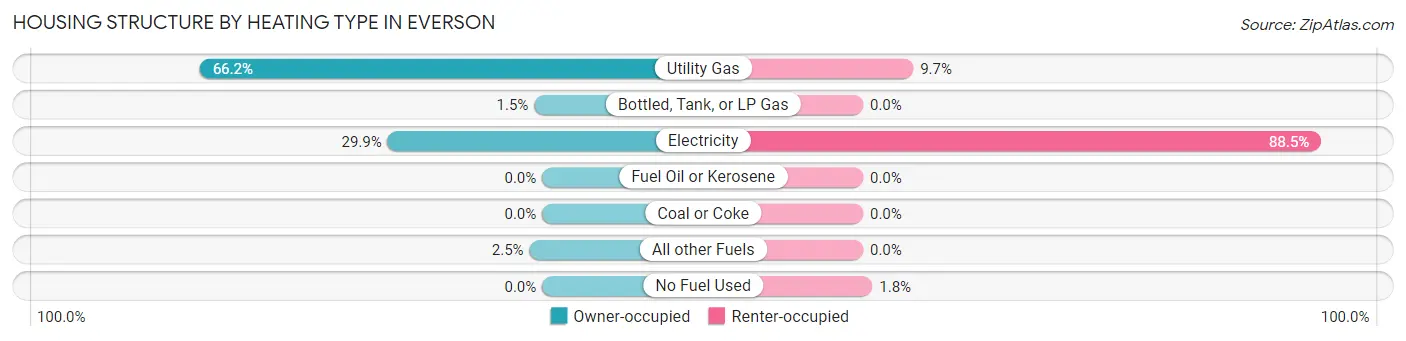
| Heating Type | Owner-occupied | Renter-occupied |
| Utility Gas | 432 (66.2%) | 38 (9.7%) |
| Bottled, Tank, or LP Gas | 10 (1.5%) | 0 (0.0%) |
| Electricity | 195 (29.9%) | 347 (88.5%) |
| Fuel Oil or Kerosene | 0 (0.0%) | 0 (0.0%) |
| Coal or Coke | 0 (0.0%) | 0 (0.0%) |
| All other Fuels | 16 (2.5%) | 0 (0.0%) |
| No Fuel Used | 0 (0.0%) | 7 (1.8%) |
| Total | 653 (100.0%) | 392 (100.0%) |
Household Vehicle Usage in Everson
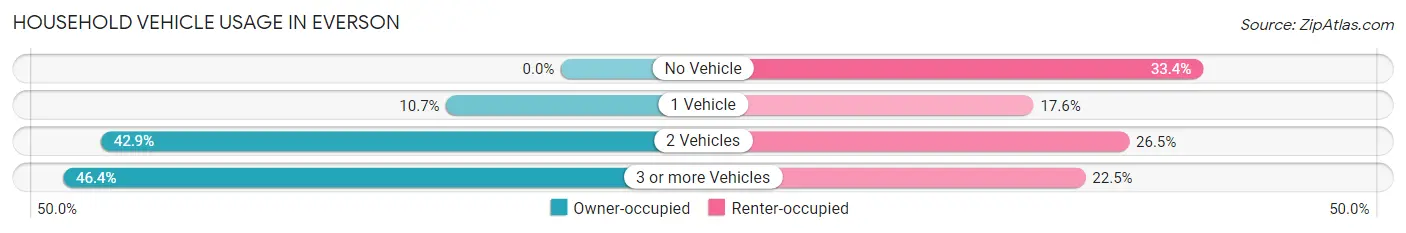
| Vehicles per Household | Owner-occupied | Renter-occupied |
| No Vehicle | 0 (0.0%) | 131 (33.4%) |
| 1 Vehicle | 70 (10.7%) | 69 (17.6%) |
| 2 Vehicles | 280 (42.9%) | 104 (26.5%) |
| 3 or more Vehicles | 303 (46.4%) | 88 (22.5%) |
| Total | 653 (100.0%) | 392 (100.0%) |
Real Estate & Mortgages in Everson
Real Estate and Mortgage Overview in Everson
| Characteristic | Without Mortgage | With Mortgage |
| Housing Units | 162 | 491 |
| Median Property Value | $423,700 | $415,900 |
| Median Household Income | $95,417 | $115 |
| Monthly Housing Costs | $730 | $37 |
| Real Estate Taxes | $3,530 | $12 |
Property Value by Mortgage Status in Everson
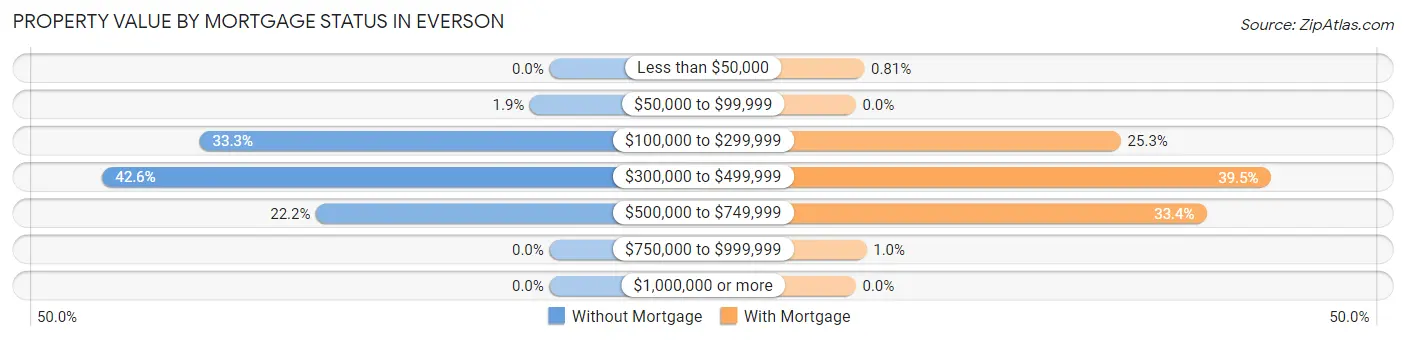
| Property Value | Without Mortgage | With Mortgage |
| Less than $50,000 | 0 (0.0%) | 4 (0.8%) |
| $50,000 to $99,999 | 3 (1.8%) | 0 (0.0%) |
| $100,000 to $299,999 | 54 (33.3%) | 124 (25.3%) |
| $300,000 to $499,999 | 69 (42.6%) | 194 (39.5%) |
| $500,000 to $749,999 | 36 (22.2%) | 164 (33.4%) |
| $750,000 to $999,999 | 0 (0.0%) | 5 (1.0%) |
| $1,000,000 or more | 0 (0.0%) | 0 (0.0%) |
| Total | 162 (100.0%) | 491 (100.0%) |
Household Income by Mortgage Status in Everson
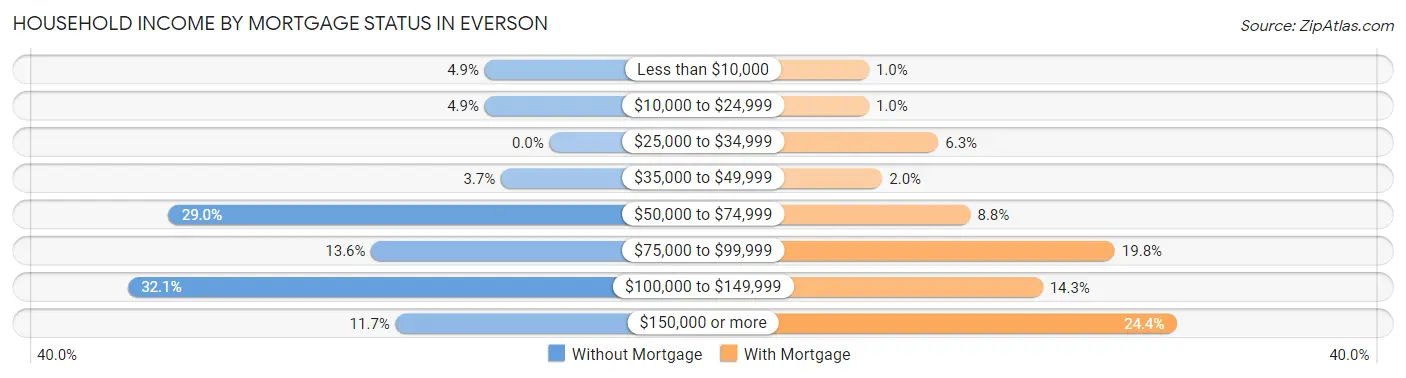
| Household Income | Without Mortgage | With Mortgage |
| Less than $10,000 | 8 (4.9%) | 5 (1.0%) |
| $10,000 to $24,999 | 8 (4.9%) | 5 (1.0%) |
| $25,000 to $34,999 | 0 (0.0%) | 31 (6.3%) |
| $35,000 to $49,999 | 6 (3.7%) | 10 (2.0%) |
| $50,000 to $74,999 | 47 (29.0%) | 43 (8.8%) |
| $75,000 to $99,999 | 22 (13.6%) | 97 (19.8%) |
| $100,000 to $149,999 | 52 (32.1%) | 70 (14.3%) |
| $150,000 or more | 19 (11.7%) | 120 (24.4%) |
| Total | 162 (100.0%) | 491 (100.0%) |
Property Value to Household Income Ratio in Everson
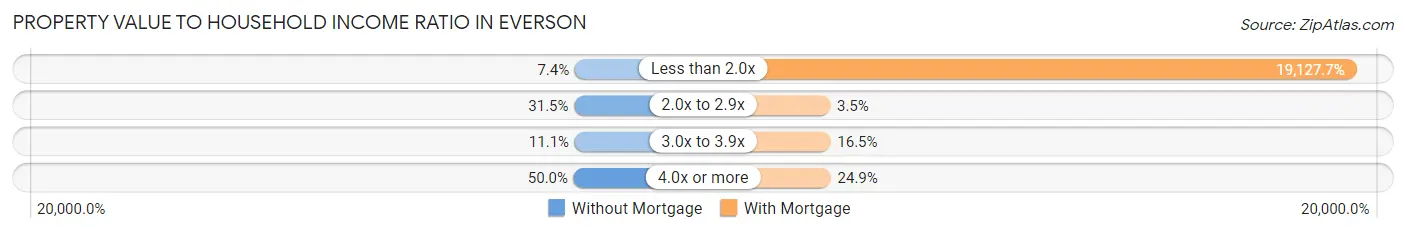
| Value-to-Income Ratio | Without Mortgage | With Mortgage |
| Less than 2.0x | 12 (7.4%) | 93,917 (19,127.7%) |
| 2.0x to 2.9x | 51 (31.5%) | 17 (3.5%) |
| 3.0x to 3.9x | 18 (11.1%) | 81 (16.5%) |
| 4.0x or more | 81 (50.0%) | 122 (24.8%) |
| Total | 162 (100.0%) | 491 (100.0%) |
Real Estate Taxes by Mortgage Status in Everson
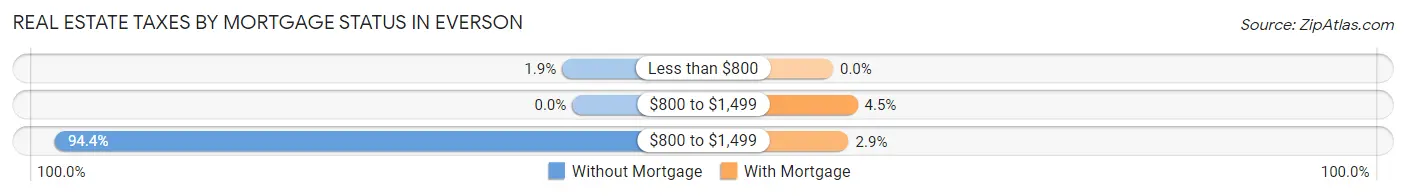
| Property Taxes | Without Mortgage | With Mortgage |
| Less than $800 | 3 (1.8%) | 0 (0.0%) |
| $800 to $1,499 | 0 (0.0%) | 22 (4.5%) |
| $800 to $1,499 | 153 (94.4%) | 14 (2.9%) |
| Total | 162 (100.0%) | 491 (100.0%) |
Health & Disability in Everson
Health Insurance Coverage by Age in Everson
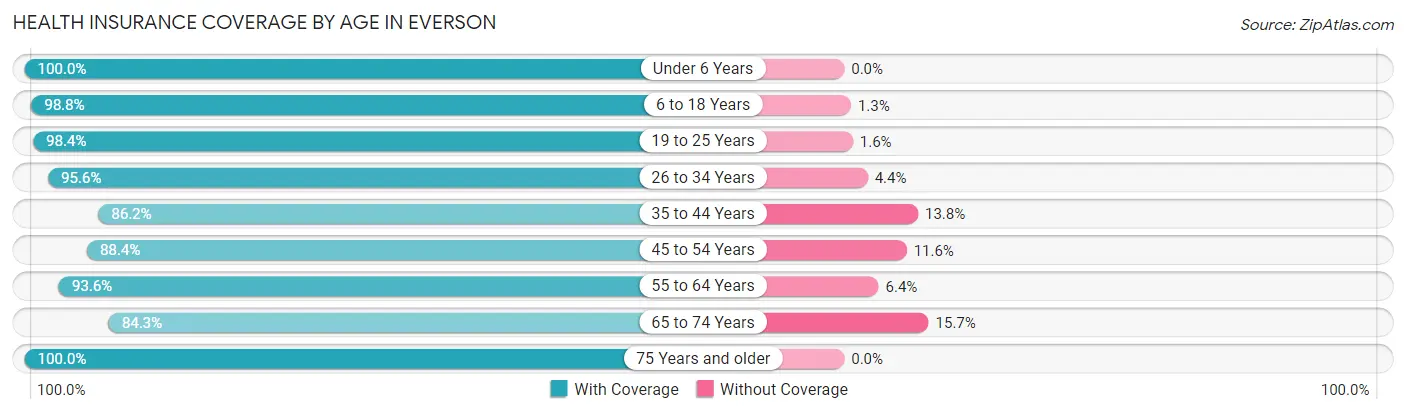
| Age Bracket | With Coverage | Without Coverage |
| Under 6 Years | 348 (100.0%) | 0 (0.0%) |
| 6 to 18 Years | 552 (98.8%) | 7 (1.3%) |
| 19 to 25 Years | 310 (98.4%) | 5 (1.6%) |
| 26 to 34 Years | 350 (95.6%) | 16 (4.4%) |
| 35 to 44 Years | 420 (86.2%) | 67 (13.8%) |
| 45 to 54 Years | 205 (88.4%) | 27 (11.6%) |
| 55 to 64 Years | 234 (93.6%) | 16 (6.4%) |
| 65 to 74 Years | 252 (84.3%) | 47 (15.7%) |
| 75 Years and older | 104 (100.0%) | 0 (0.0%) |
| Total | 2,775 (93.8%) | 185 (6.2%) |
Health Insurance Coverage by Citizenship Status in Everson
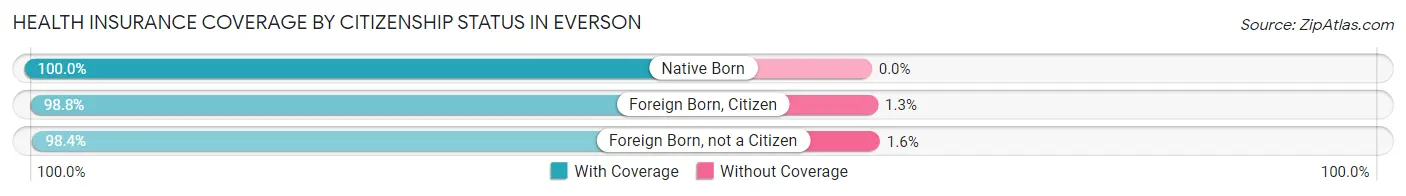
| Citizenship Status | With Coverage | Without Coverage |
| Native Born | 348 (100.0%) | 0 (0.0%) |
| Foreign Born, Citizen | 552 (98.8%) | 7 (1.3%) |
| Foreign Born, not a Citizen | 310 (98.4%) | 5 (1.6%) |
Health Insurance Coverage by Household Income in Everson
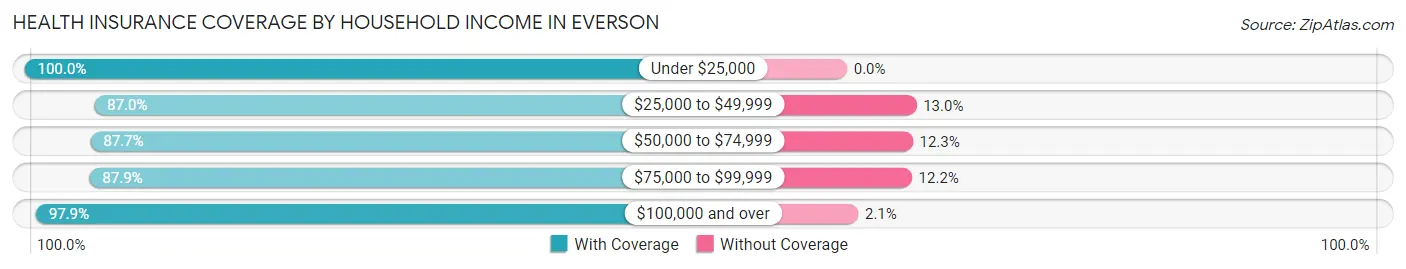
| Household Income | With Coverage | Without Coverage |
| Under $25,000 | 320 (100.0%) | 0 (0.0%) |
| $25,000 to $49,999 | 127 (87.0%) | 19 (13.0%) |
| $50,000 to $74,999 | 506 (87.7%) | 71 (12.3%) |
| $75,000 to $99,999 | 477 (87.8%) | 66 (12.1%) |
| $100,000 and over | 1,345 (97.9%) | 29 (2.1%) |
Public vs Private Health Insurance Coverage by Age in Everson
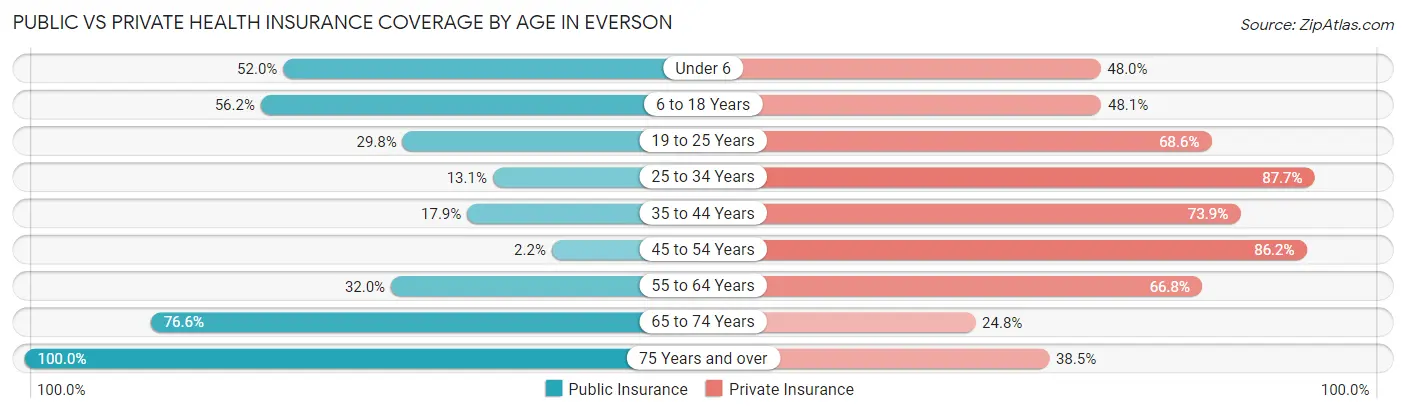
| Age Bracket | Public Insurance | Private Insurance |
| Under 6 | 181 (52.0%) | 167 (48.0%) |
| 6 to 18 Years | 314 (56.2%) | 269 (48.1%) |
| 19 to 25 Years | 94 (29.8%) | 216 (68.6%) |
| 25 to 34 Years | 48 (13.1%) | 321 (87.7%) |
| 35 to 44 Years | 87 (17.9%) | 360 (73.9%) |
| 45 to 54 Years | 5 (2.2%) | 200 (86.2%) |
| 55 to 64 Years | 80 (32.0%) | 167 (66.8%) |
| 65 to 74 Years | 229 (76.6%) | 74 (24.7%) |
| 75 Years and over | 104 (100.0%) | 40 (38.5%) |
| Total | 1,142 (38.6%) | 1,814 (61.3%) |
Disability Status by Sex by Age in Everson
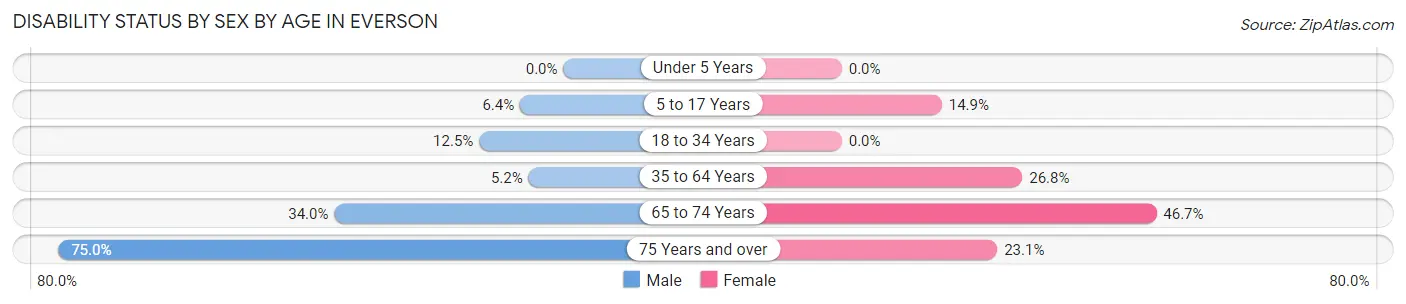
| Age Bracket | Male | Female |
| Under 5 Years | 0 (0.0%) | 0 (0.0%) |
| 5 to 17 Years | 22 (6.4%) | 34 (14.8%) |
| 18 to 34 Years | 45 (12.5%) | 0 (0.0%) |
| 35 to 64 Years | 20 (5.2%) | 156 (26.8%) |
| 65 to 74 Years | 50 (34.0%) | 71 (46.7%) |
| 75 Years and over | 39 (75.0%) | 12 (23.1%) |
Disability Class by Sex by Age in Everson
Disability Class: Hearing Difficulty
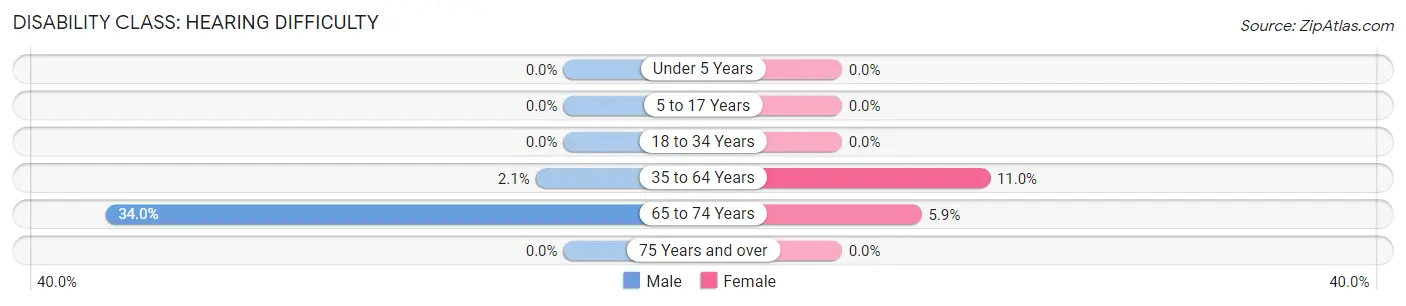
| Age Bracket | Male | Female |
| Under 5 Years | 0 (0.0%) | 0 (0.0%) |
| 5 to 17 Years | 0 (0.0%) | 0 (0.0%) |
| 18 to 34 Years | 0 (0.0%) | 0 (0.0%) |
| 35 to 64 Years | 8 (2.1%) | 64 (11.0%) |
| 65 to 74 Years | 50 (34.0%) | 9 (5.9%) |
| 75 Years and over | 0 (0.0%) | 0 (0.0%) |
Disability Class: Vision Difficulty
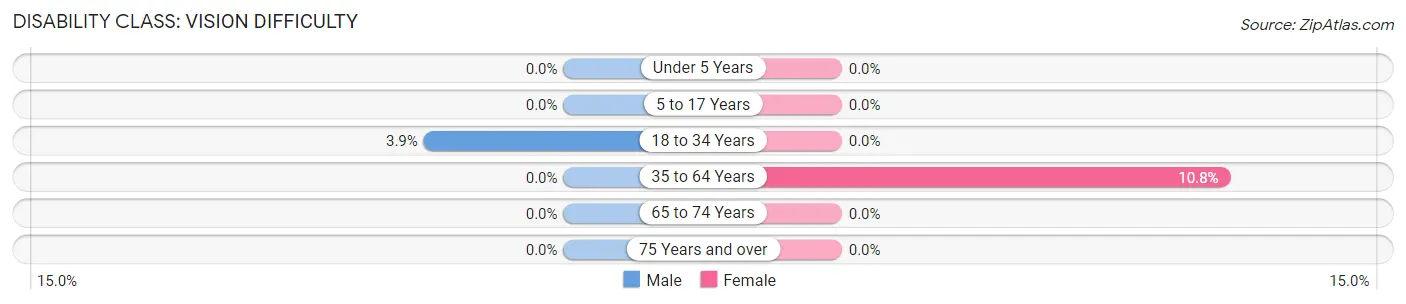
| Age Bracket | Male | Female |
| Under 5 Years | 0 (0.0%) | 0 (0.0%) |
| 5 to 17 Years | 0 (0.0%) | 0 (0.0%) |
| 18 to 34 Years | 14 (3.9%) | 0 (0.0%) |
| 35 to 64 Years | 0 (0.0%) | 63 (10.8%) |
| 65 to 74 Years | 0 (0.0%) | 0 (0.0%) |
| 75 Years and over | 0 (0.0%) | 0 (0.0%) |
Disability Class: Cognitive Difficulty
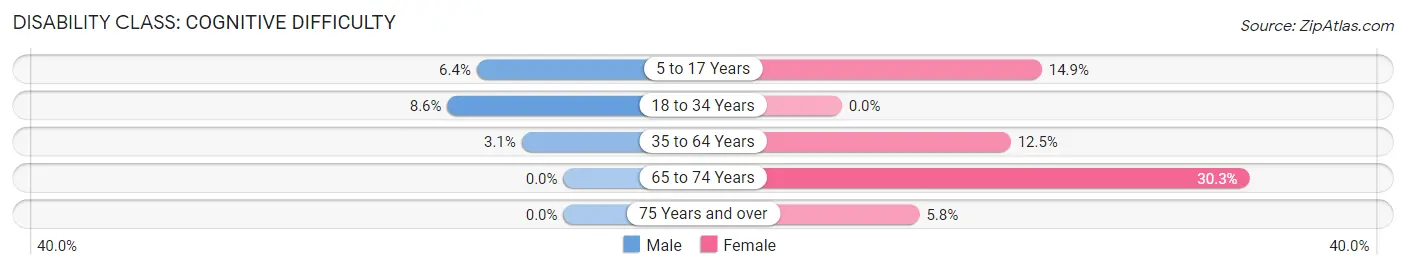
| Age Bracket | Male | Female |
| 5 to 17 Years | 22 (6.4%) | 34 (14.8%) |
| 18 to 34 Years | 31 (8.6%) | 0 (0.0%) |
| 35 to 64 Years | 12 (3.1%) | 73 (12.5%) |
| 65 to 74 Years | 0 (0.0%) | 46 (30.3%) |
| 75 Years and over | 0 (0.0%) | 3 (5.8%) |
Disability Class: Ambulatory Difficulty
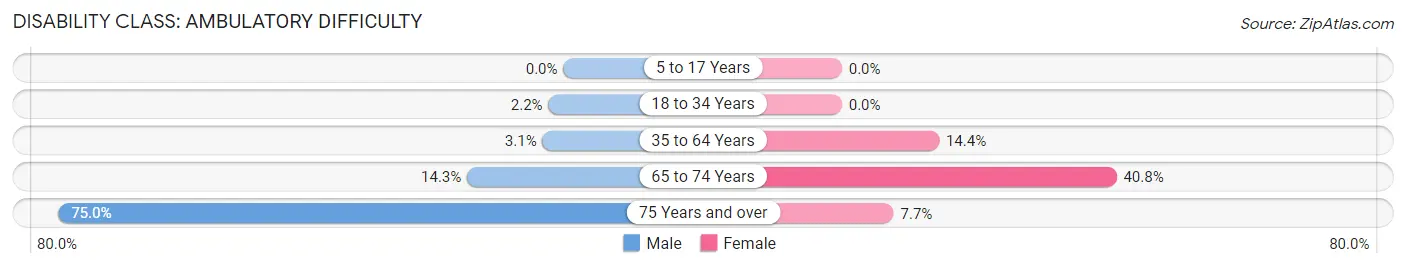
| Age Bracket | Male | Female |
| 5 to 17 Years | 0 (0.0%) | 0 (0.0%) |
| 18 to 34 Years | 8 (2.2%) | 0 (0.0%) |
| 35 to 64 Years | 12 (3.1%) | 84 (14.4%) |
| 65 to 74 Years | 21 (14.3%) | 62 (40.8%) |
| 75 Years and over | 39 (75.0%) | 4 (7.7%) |
Disability Class: Self-Care Difficulty
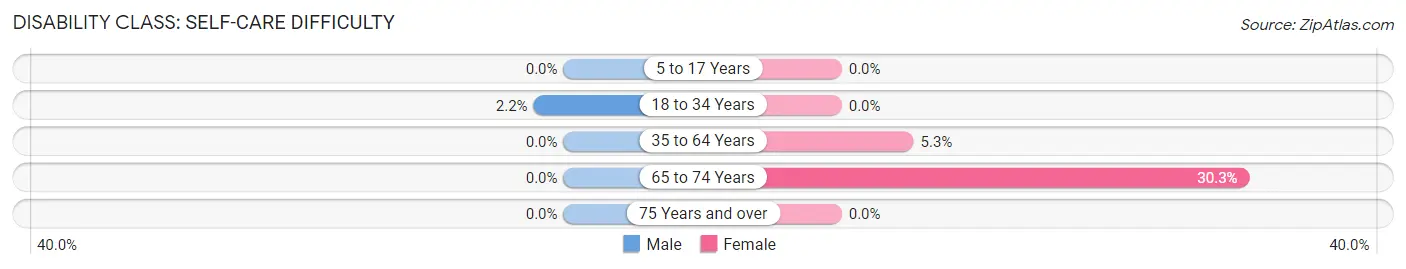
| Age Bracket | Male | Female |
| 5 to 17 Years | 0 (0.0%) | 0 (0.0%) |
| 18 to 34 Years | 8 (2.2%) | 0 (0.0%) |
| 35 to 64 Years | 0 (0.0%) | 31 (5.3%) |
| 65 to 74 Years | 0 (0.0%) | 46 (30.3%) |
| 75 Years and over | 0 (0.0%) | 0 (0.0%) |
Technology Access in Everson
Computing Device Access in Everson
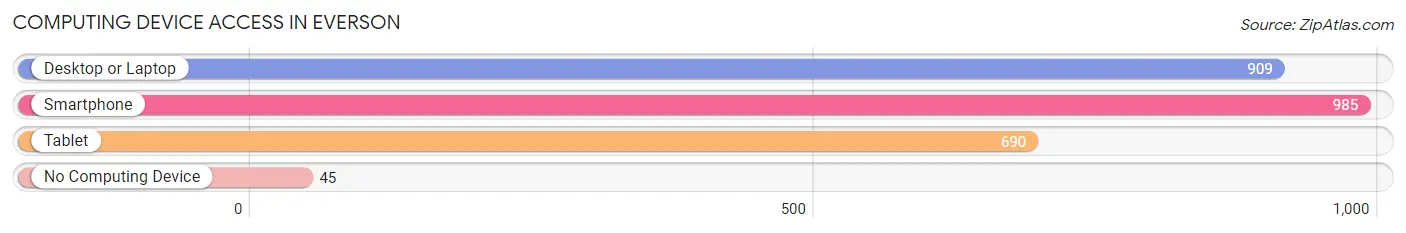
| Device Type | # Households | % Households |
| Desktop or Laptop | 909 | 87.0% |
| Smartphone | 985 | 94.3% |
| Tablet | 690 | 66.0% |
| No Computing Device | 45 | 4.3% |
| Total | 1,045 | 100.0% |
Internet Access in Everson
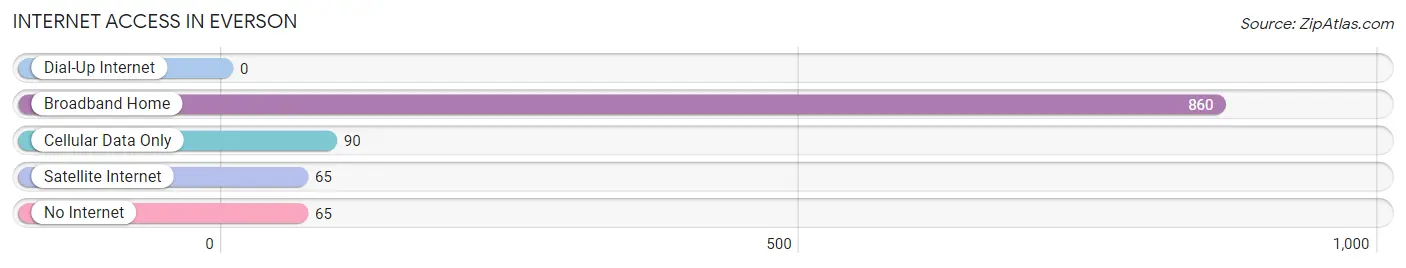
| Internet Type | # Households | % Households |
| Dial-Up Internet | 0 | 0.0% |
| Broadband Home | 860 | 82.3% |
| Cellular Data Only | 90 | 8.6% |
| Satellite Internet | 65 | 6.2% |
| No Internet | 65 | 6.2% |
| Total | 1,045 | 100.0% |
Everson Summary
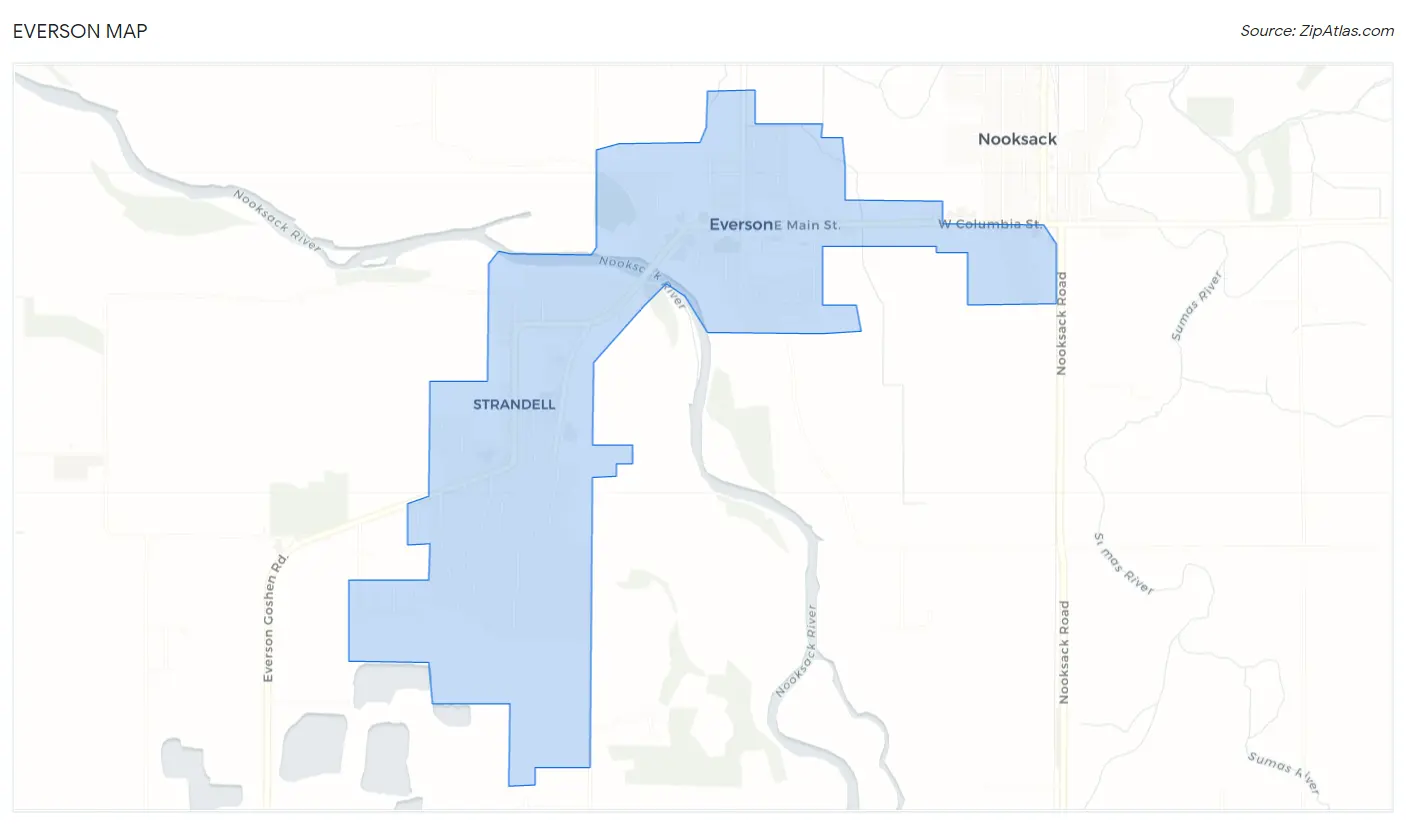
Everson is a small city located in Whatcom County, Washington, United States. It is situated in the Nooksack Valley, about 10 miles (16 km) east of Bellingham. The population was 1,914 at the 2010 census.
History
The area that is now Everson was first settled in the late 1800s by homesteaders. The town was officially incorporated in 1910 and named after Everson, Pennsylvania, the hometown of one of the first settlers.
The town was originally a farming community, but in the early 1900s, the lumber industry began to take off. The town was home to several sawmills and logging camps, and the population grew rapidly.
In the 1950s, the town began to diversify its economy. The first major employer was the Everson Canning Company, which opened in 1954 and was the largest employer in the area for many years. The company closed in the late 1990s, but the town has since seen a resurgence in the lumber industry and other businesses.
Geography
Everson is located in the Nooksack Valley, about 10 miles (16 km) east of Bellingham. The city is situated on the banks of the Nooksack River, which flows through the city. The city is surrounded by rolling hills and farmland.
The climate in Everson is mild and temperate. The average high temperature in the summer is around 75°F (24°C), and the average low temperature in the winter is around 35°F (2°C).
Economy
Everson’s economy is largely based on agriculture and forestry. The city is home to several farms, and the surrounding area is home to many timber companies. The city is also home to several small businesses, including restaurants, retail stores, and service providers.
The city is also home to several manufacturing companies, including a wood products company, a metal fabrication company, and a plastics company.
Demographics
As of the 2010 census, the population of Everson was 1,914. The racial makeup of the city was 87.3% White, 0.7% African American, 1.2% Native American, 0.7% Asian, 0.1% Pacific Islander, 6.2% from other races, and 3.9% from two or more races. Hispanic or Latino of any race were 11.2% of the population.
The median income for a household in the city was $41,250, and the median income for a family was $48,750. The per capita income for the city was $19,945. About 11.2% of families and 14.2% of the population were below the poverty line, including 19.2% of those under age 18 and 8.2% of those age 65 or over.
Everson is a small city with a rich history and a diverse economy. The city is home to many farms and timber companies, as well as several small businesses. The population is diverse, with a mix of races and ethnicities. The city has a mild climate and is a great place to live and work.
Common Questions
What is Per Capita Income in Everson?
Per Capita income in Everson is $32,295.
What is the Median Family Income in Everson?
Median Family Income in Everson is $87,050.
What is the Median Household income in Everson?
Median Household Income in Everson is $76,645.
What is Income or Wage Gap in Everson?
Income or Wage Gap in Everson is 37.5%.
Women in Everson earn 62.5 cents for every dollar earned by a man.
What is Inequality or Gini Index in Everson?
Inequality or Gini Index in Everson is 0.39.
What is the Total Population of Everson?
Total Population of Everson is 2,960.
What is the Total Male Population of Everson?
Total Male Population of Everson is 1,435.
What is the Total Female Population of Everson?
Total Female Population of Everson is 1,525.
What is the Ratio of Males per 100 Females in Everson?
There are 94.10 Males per 100 Females in Everson.
What is the Ratio of Females per 100 Males in Everson?
There are 106.27 Females per 100 Males in Everson.
What is the Median Population Age in Everson?
Median Population Age in Everson is 32.3 Years.
What is the Average Family Size in Everson
Average Family Size in Everson is 3.3 People.
What is the Average Household Size in Everson
Average Household Size in Everson is 2.8 People.
How Large is the Labor Force in Everson?
There are 1,395 People in the Labor Forcein in Everson.
What is the Percentage of People in the Labor Force in Everson?
64.4% of People are in the Labor Force in Everson.
What is the Unemployment Rate in Everson?
Unemployment Rate in Everson is 2.6%.