Zip Codes with the Highest Percentage of Population with a Degree in Physical and Health Sciences in Richland, WA
RELATED REPORTS & OPTIONS
Physical and Health Sciences
Richland
Compare Zip Codes
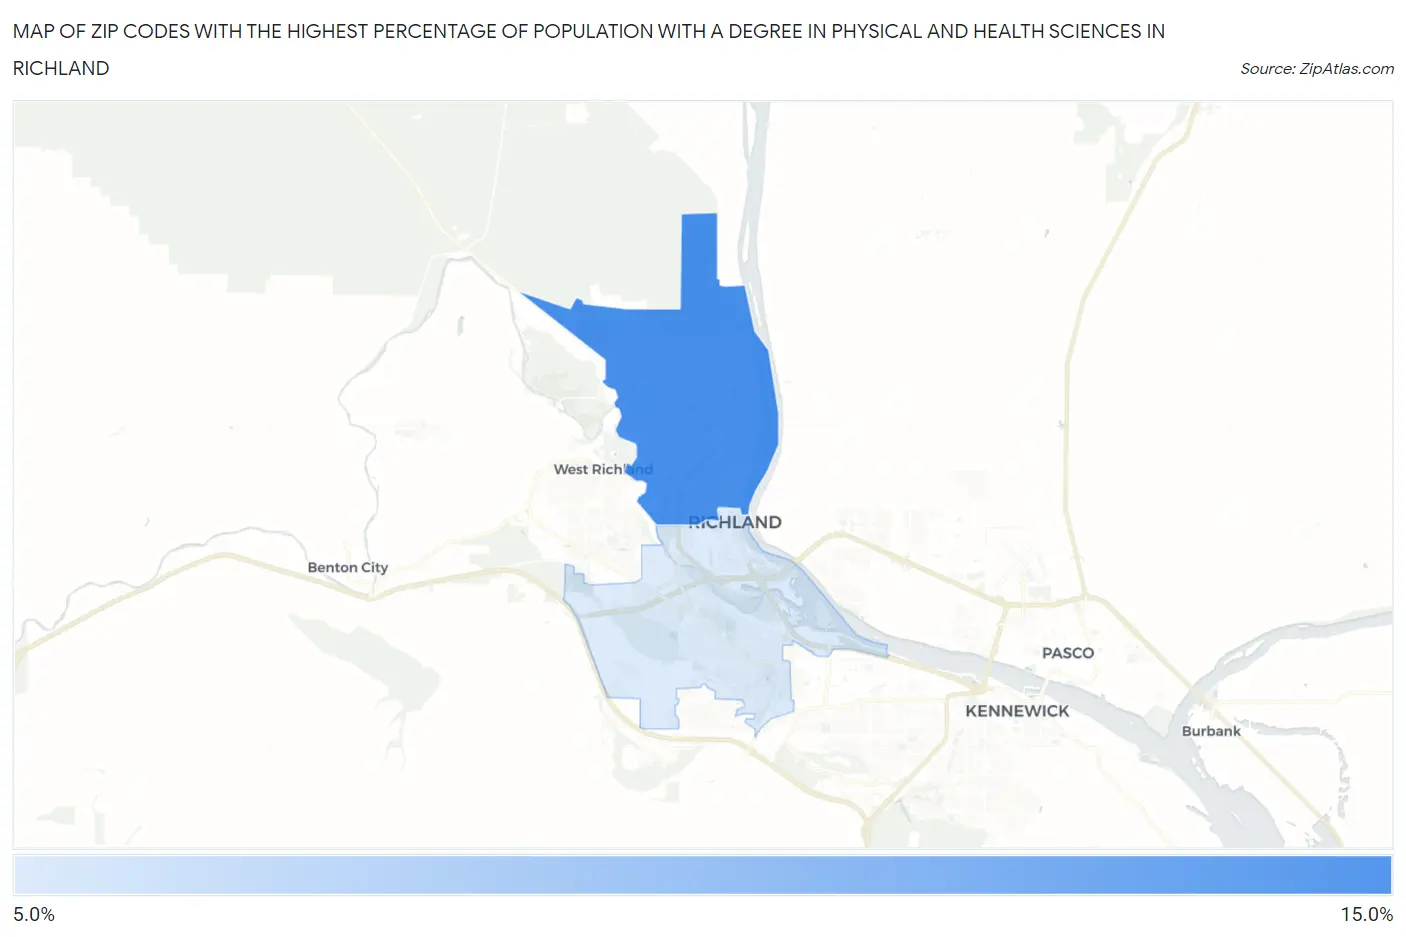
Map of Zip Codes with the Highest Percentage of Population with a Degree in Physical and Health Sciences in Richland
7.9%
10.8%
Zip Codes with the Highest Percentage of Population with a Degree in Physical and Health Sciences in Richland, WA
| Zip Code | % Graduates | vs State | vs National | |
| 1. | 99354 | 10.8% | 3.4%(+7.39)#31 | 3.1%(+7.67)#1,211 |
| 2. | 99352 | 7.9% | 3.4%(+4.49)#42 | 3.1%(+4.76)#2,069 |
1
Common Questions
What are the Top Zip Codes with the Highest Percentage of Population with a Degree in Physical and Health Sciences in Richland, WA?
Top Zip Codes with the Highest Percentage of Population with a Degree in Physical and Health Sciences in Richland, WA are:
What zip code has the Highest Percentage of Population with a Degree in Physical and Health Sciences in Richland, WA?
99354 has the Highest Percentage of Population with a Degree in Physical and Health Sciences in Richland, WA with 10.8%.
What is the Percentage of Population with a Degree in Physical and Health Sciences in Richland, WA?
Percentage of Population with a Degree in Physical and Health Sciences in Richland is 9.0%.
What is the Percentage of Population with a Degree in Physical and Health Sciences in Washington?
Percentage of Population with a Degree in Physical and Health Sciences in Washington is 3.4%.
What is the Percentage of Population with a Degree in Physical and Health Sciences in the United States?
Percentage of Population with a Degree in Physical and Health Sciences in the United States is 3.1%.