Zip Codes with the Highest Percentage of Population with a Degree in Physical and Health Sciences in Seattle, WA
RELATED REPORTS & OPTIONS
Physical and Health Sciences
Seattle
Compare Zip Codes
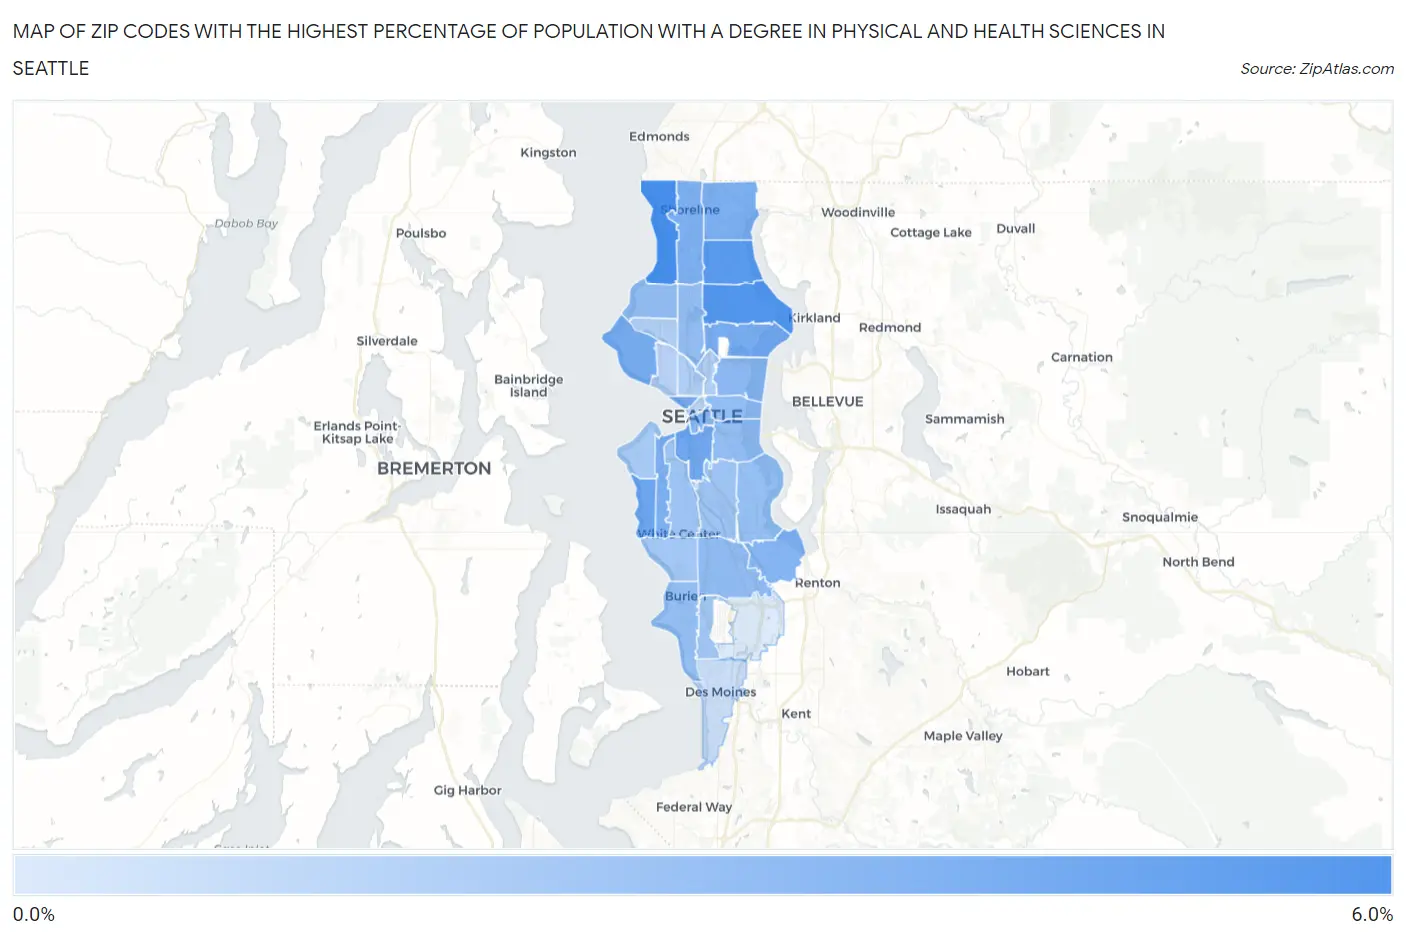
Map of Zip Codes with the Highest Percentage of Population with a Degree in Physical and Health Sciences in Seattle
0.94%
5.8%
Zip Codes with the Highest Percentage of Population with a Degree in Physical and Health Sciences in Seattle, WA
| Zip Code | % Graduates | vs State | vs National | |
| 1. | 98177 | 5.8% | 3.4%(+2.47)#75 | 3.1%(+2.74)#3,426 |
| 2. | 98115 | 5.5% | 3.4%(+2.11)#84 | 3.1%(+2.38)#3,859 |
| 3. | 98125 | 5.3% | 3.4%(+1.95)#90 | 3.1%(+2.22)#4,059 |
| 4. | 98136 | 4.5% | 3.4%(+1.14)#124 | 3.1%(+1.42)#5,495 |
| 5. | 98134 | 4.5% | 3.4%(+1.09)#128 | 3.1%(+1.36)#5,613 |
| 6. | 98105 | 4.2% | 3.4%(+0.867)#142 | 3.1%(+1.14)#6,117 |
| 7. | 98199 | 4.2% | 3.4%(+0.839)#144 | 3.1%(+1.11)#6,187 |
| 8. | 98121 | 4.1% | 3.4%(+0.772)#146 | 3.1%(+1.04)#6,342 |
| 9. | 98126 | 4.1% | 3.4%(+0.708)#149 | 3.1%(+0.980)#6,529 |
| 10. | 98155 | 4.1% | 3.4%(+0.684)#152 | 3.1%(+0.956)#6,584 |
| 11. | 98133 | 4.0% | 3.4%(+0.613)#158 | 3.1%(+0.885)#6,804 |
| 12. | 98178 | 3.8% | 3.4%(+0.380)#180 | 3.1%(+0.652)#7,529 |
| 13. | 98104 | 3.6% | 3.4%(+0.252)#190 | 3.1%(+0.524)#7,975 |
| 14. | 98112 | 3.5% | 3.4%(+0.159)#196 | 3.1%(+0.431)#8,311 |
| 15. | 98168 | 3.4% | 3.4%(+0.039)#206 | 3.1%(+0.311)#8,756 |
| 16. | 98122 | 3.3% | 3.4%(-0.028)#213 | 3.1%(+0.244)#9,016 |
| 17. | 98144 | 3.3% | 3.4%(-0.062)#220 | 3.1%(+0.210)#9,160 |
| 18. | 98117 | 3.3% | 3.4%(-0.067)#222 | 3.1%(+0.205)#9,179 |
| 19. | 98103 | 3.3% | 3.4%(-0.075)#223 | 3.1%(+0.197)#9,203 |
| 20. | 98118 | 3.3% | 3.4%(-0.095)#225 | 3.1%(+0.177)#9,280 |
| 21. | 98166 | 3.3% | 3.4%(-0.104)#227 | 3.1%(+0.168)#9,311 |
| 22. | 98108 | 3.0% | 3.4%(-0.411)#249 | 3.1%(-0.139)#10,599 |
| 23. | 98106 | 2.9% | 3.4%(-0.456)#253 | 3.1%(-0.184)#10,788 |
| 24. | 98148 | 2.8% | 3.4%(-0.593)#269 | 3.1%(-0.321)#11,427 |
| 25. | 98146 | 2.8% | 3.4%(-0.606)#273 | 3.1%(-0.334)#11,481 |
| 26. | 98116 | 2.7% | 3.4%(-0.694)#282 | 3.1%(-0.422)#11,889 |
| 27. | 98102 | 2.4% | 3.4%(-0.987)#303 | 3.1%(-0.715)#13,265 |
| 28. | 98109 | 2.4% | 3.4%(-0.998)#304 | 3.1%(-0.726)#13,320 |
| 29. | 98107 | 2.4% | 3.4%(-1.01)#306 | 3.1%(-0.742)#13,398 |
| 30. | 98119 | 2.1% | 3.4%(-1.23)#324 | 3.1%(-0.956)#14,395 |
| 31. | 98101 | 2.1% | 3.4%(-1.25)#328 | 3.1%(-0.981)#14,546 |
| 32. | 98198 | 1.6% | 3.4%(-1.81)#372 | 3.1%(-1.54)#17,052 |
| 33. | 98188 | 0.94% | 3.4%(-2.43)#411 | 3.1%(-2.16)#19,437 |
1
Common Questions
What are the Top 10 Zip Codes with the Highest Percentage of Population with a Degree in Physical and Health Sciences in Seattle, WA?
Top 10 Zip Codes with the Highest Percentage of Population with a Degree in Physical and Health Sciences in Seattle, WA are:
What zip code has the Highest Percentage of Population with a Degree in Physical and Health Sciences in Seattle, WA?
98177 has the Highest Percentage of Population with a Degree in Physical and Health Sciences in Seattle, WA with 5.8%.
What is the Percentage of Population with a Degree in Physical and Health Sciences in Seattle, WA?
Percentage of Population with a Degree in Physical and Health Sciences in Seattle is 3.6%.
What is the Percentage of Population with a Degree in Physical and Health Sciences in Washington?
Percentage of Population with a Degree in Physical and Health Sciences in Washington is 3.4%.
What is the Percentage of Population with a Degree in Physical and Health Sciences in the United States?
Percentage of Population with a Degree in Physical and Health Sciences in the United States is 3.1%.