Zip Codes with the Highest Percentage of Population with a Degree in Physical and Health Sciences in Puyallup, WA
RELATED REPORTS & OPTIONS
Physical and Health Sciences
Puyallup
Compare Zip Codes
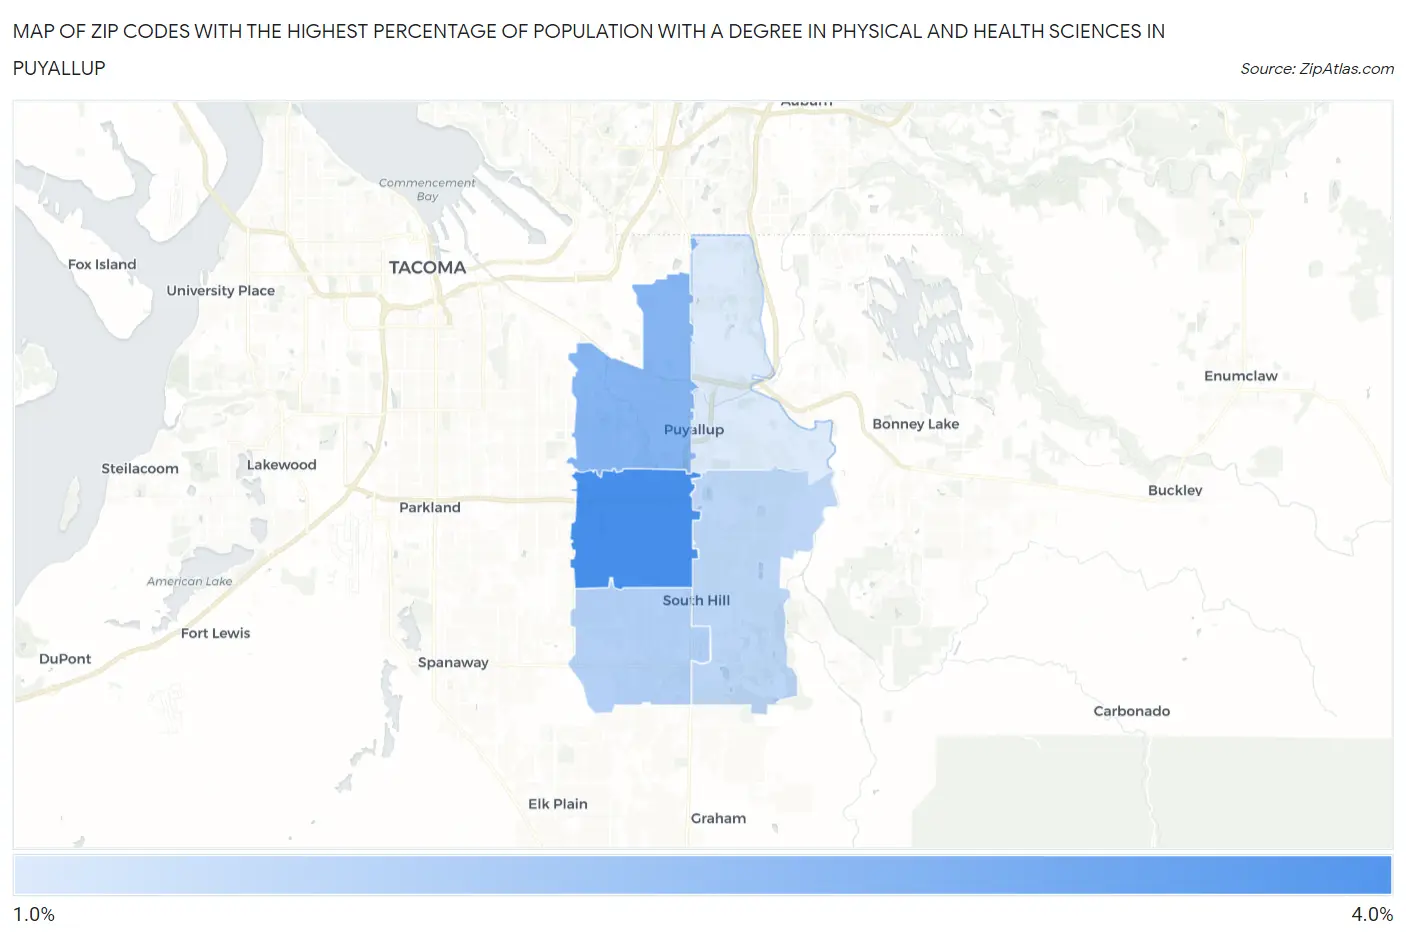
Map of Zip Codes with the Highest Percentage of Population with a Degree in Physical and Health Sciences in Puyallup
1.4%
3.9%
Zip Codes with the Highest Percentage of Population with a Degree in Physical and Health Sciences in Puyallup, WA
| Zip Code | % Graduates | vs State | vs National | |
| 1. | 98373 | 3.9% | 3.4%(+0.516)#165 | 3.1%(+0.788)#7,087 |
| 2. | 98371 | 2.9% | 3.4%(-0.513)#260 | 3.1%(-0.241)#11,036 |
| 3. | 98375 | 2.1% | 3.4%(-1.28)#332 | 3.1%(-1.01)#14,669 |
| 4. | 98374 | 2.0% | 3.4%(-1.41)#344 | 3.1%(-1.14)#15,270 |
| 5. | 98372 | 1.4% | 3.4%(-1.94)#380 | 3.1%(-1.66)#17,582 |
1
Common Questions
What are the Top 3 Zip Codes with the Highest Percentage of Population with a Degree in Physical and Health Sciences in Puyallup, WA?
Top 3 Zip Codes with the Highest Percentage of Population with a Degree in Physical and Health Sciences in Puyallup, WA are:
What zip code has the Highest Percentage of Population with a Degree in Physical and Health Sciences in Puyallup, WA?
98373 has the Highest Percentage of Population with a Degree in Physical and Health Sciences in Puyallup, WA with 3.9%.
What is the Percentage of Population with a Degree in Physical and Health Sciences in Puyallup, WA?
Percentage of Population with a Degree in Physical and Health Sciences in Puyallup is 1.3%.
What is the Percentage of Population with a Degree in Physical and Health Sciences in Washington?
Percentage of Population with a Degree in Physical and Health Sciences in Washington is 3.4%.
What is the Percentage of Population with a Degree in Physical and Health Sciences in the United States?
Percentage of Population with a Degree in Physical and Health Sciences in the United States is 3.1%.