Orchards, WA Map & Demographics
Orchards Map
Orchards Overview
$38,389
PER CAPITA INCOME
$92,263
AVG FAMILY INCOME
$88,199
AVG HOUSEHOLD INCOME
33.3%
WAGE / INCOME GAP [ % ]
66.7¢/ $1
WAGE / INCOME GAP [ $ ]
$7,774
FAMILY INCOME DEFICIT
0.41
INEQUALITY / GINI INDEX
29,214
TOTAL POPULATION
15,005
MALE POPULATION
14,209
FEMALE POPULATION
105.60
MALES / 100 FEMALES
94.70
FEMALES / 100 MALES
33.8
MEDIAN AGE
3.2
AVG FAMILY SIZE
2.9
AVG HOUSEHOLD SIZE
15,086
LABOR FORCE [ PEOPLE ]
69.2%
PERCENT IN LABOR FORCE
6.7%
UNEMPLOYMENT RATE
Income in Orchards
Income Overview in Orchards
Per Capita Income in Orchards is $38,389, while median incomes of families and households are $92,263 and $88,199 respectively.
| Characteristic | Number | Measure |
| Per Capita Income | 29,214 | $38,389 |
| Median Family Income | 7,551 | $92,263 |
| Mean Family Income | 7,551 | $114,396 |
| Median Household Income | 10,060 | $88,199 |
| Mean Household Income | 10,060 | $107,766 |
| Income Deficit | 7,551 | $7,774 |
| Wage / Income Gap (%) | 29,214 | 33.30% |
| Wage / Income Gap ($) | 29,214 | 66.70¢ per $1 |
| Gini / Inequality Index | 29,214 | 0.41 |
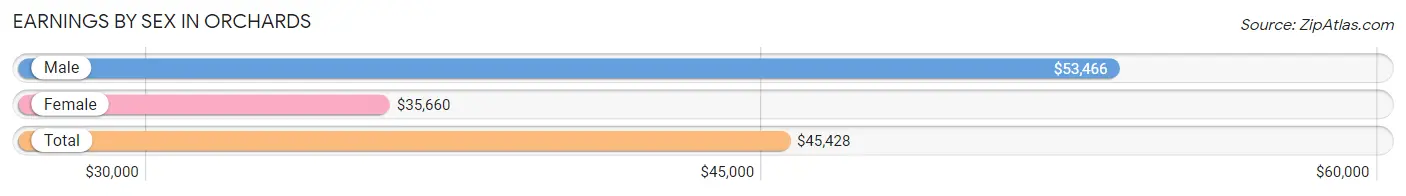
Earnings by Sex in Orchards
Average Earnings in Orchards are $45,428, $53,466 for men and $35,660 for women, a difference of 33.3%.
| Sex | Number | Average Earnings |
| Male | 8,498 (53.5%) | $53,466 |
| Female | 7,375 (46.5%) | $35,660 |
| Total | 15,873 (100.0%) | $45,428 |
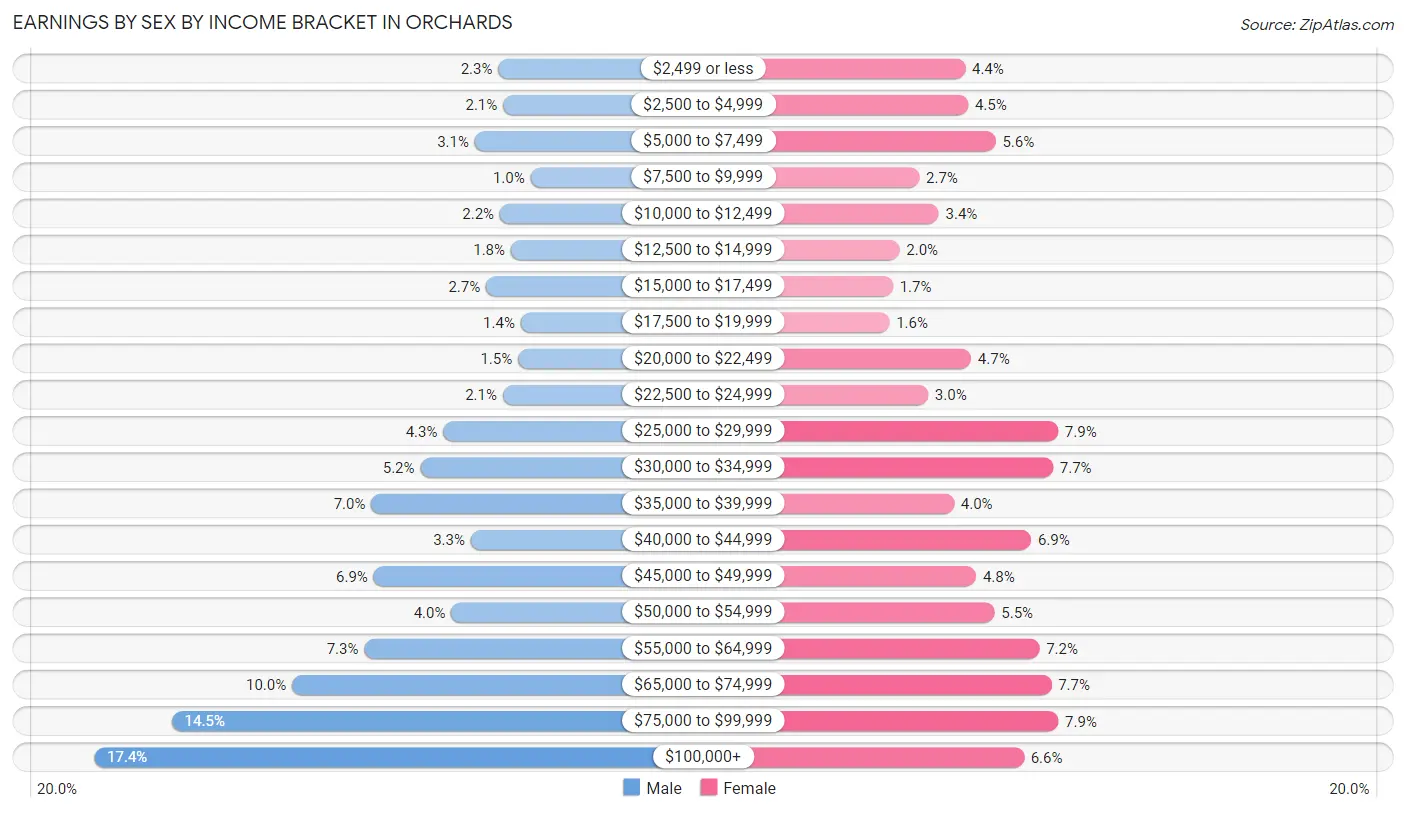
Earnings by Sex by Income Bracket in Orchards
The most common earnings brackets in Orchards are $100,000+ for men (1,479 | 17.4%) and $75,000 to $99,999 for women (584 | 7.9%).
| Income | Male | Female |
| $2,499 or less | 191 (2.2%) | 327 (4.4%) |
| $2,500 to $4,999 | 176 (2.1%) | 335 (4.5%) |
| $5,000 to $7,499 | 266 (3.1%) | 411 (5.6%) |
| $7,500 to $9,999 | 88 (1.0%) | 200 (2.7%) |
| $10,000 to $12,499 | 186 (2.2%) | 254 (3.4%) |
| $12,500 to $14,999 | 151 (1.8%) | 145 (2.0%) |
| $15,000 to $17,499 | 230 (2.7%) | 127 (1.7%) |
| $17,500 to $19,999 | 120 (1.4%) | 117 (1.6%) |
| $20,000 to $22,499 | 128 (1.5%) | 343 (4.6%) |
| $22,500 to $24,999 | 177 (2.1%) | 224 (3.0%) |
| $25,000 to $29,999 | 366 (4.3%) | 583 (7.9%) |
| $30,000 to $34,999 | 439 (5.2%) | 569 (7.7%) |
| $35,000 to $39,999 | 596 (7.0%) | 296 (4.0%) |
| $40,000 to $44,999 | 279 (3.3%) | 509 (6.9%) |
| $45,000 to $49,999 | 588 (6.9%) | 357 (4.8%) |
| $50,000 to $54,999 | 341 (4.0%) | 408 (5.5%) |
| $55,000 to $64,999 | 618 (7.3%) | 532 (7.2%) |
| $65,000 to $74,999 | 848 (10.0%) | 565 (7.7%) |
| $75,000 to $99,999 | 1,231 (14.5%) | 584 (7.9%) |
| $100,000+ | 1,479 (17.4%) | 489 (6.6%) |
| Total | 8,498 (100.0%) | 7,375 (100.0%) |
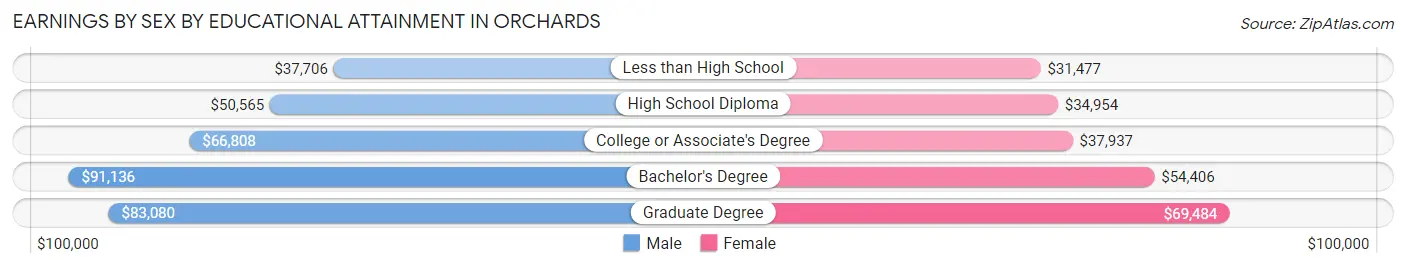
Earnings by Sex by Educational Attainment in Orchards
Average earnings in Orchards are $60,223 for men and $42,398 for women, a difference of 29.6%. Men with an educational attainment of bachelor's degree enjoy the highest average annual earnings of $91,136, while those with less than high school education earn the least with $37,706. Women with an educational attainment of graduate degree earn the most with the average annual earnings of $69,484, while those with less than high school education have the smallest earnings of $31,477.
| Educational Attainment | Male Income | Female Income |
| Less than High School | $37,706 | $31,477 |
| High School Diploma | $50,565 | $34,954 |
| College or Associate's Degree | $66,808 | $37,937 |
| Bachelor's Degree | $91,136 | $54,406 |
| Graduate Degree | $83,080 | $69,484 |
| Total | $60,223 | $42,398 |
Family Income in Orchards
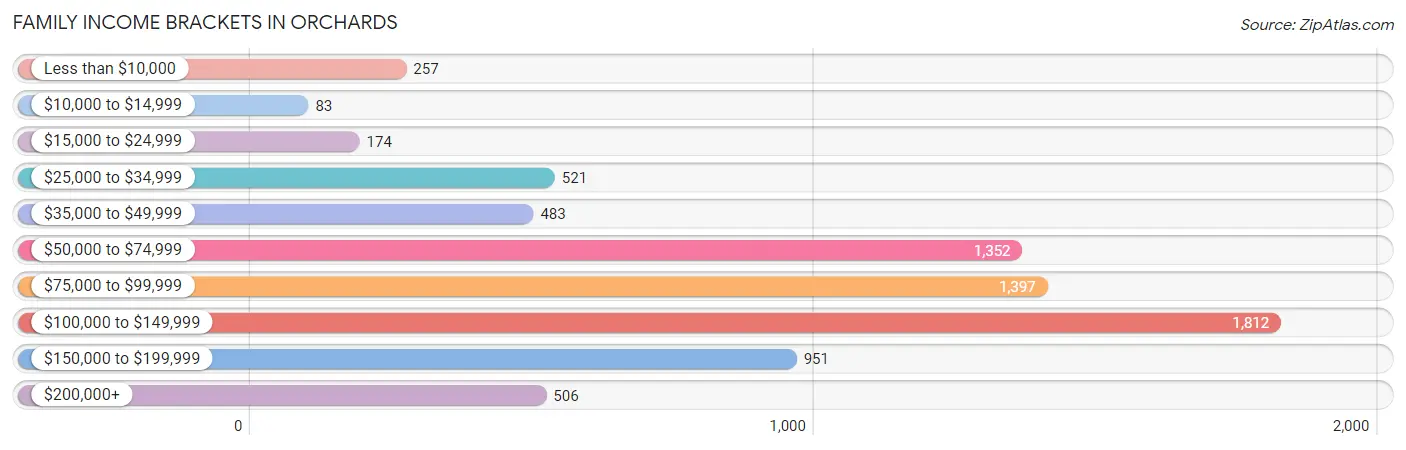
Family Income Brackets in Orchards
According to the Orchards family income data, there are 1,812 families falling into the $100,000 to $149,999 income range, which is the most common income bracket and makes up 24.0% of all families. Conversely, the $10,000 to $14,999 income bracket is the least frequent group with only 83 families (1.1%) belonging to this category.
| Income Bracket | # Families | % Families |
| Less than $10,000 | 257 | 3.4% |
| $10,000 to $14,999 | 83 | 1.1% |
| $15,000 to $24,999 | 174 | 2.3% |
| $25,000 to $34,999 | 521 | 6.9% |
| $35,000 to $49,999 | 483 | 6.4% |
| $50,000 to $74,999 | 1,352 | 17.9% |
| $75,000 to $99,999 | 1,397 | 18.5% |
| $100,000 to $149,999 | 1,812 | 24.0% |
| $150,000 to $199,999 | 951 | 12.6% |
| $200,000+ | 506 | 6.7% |
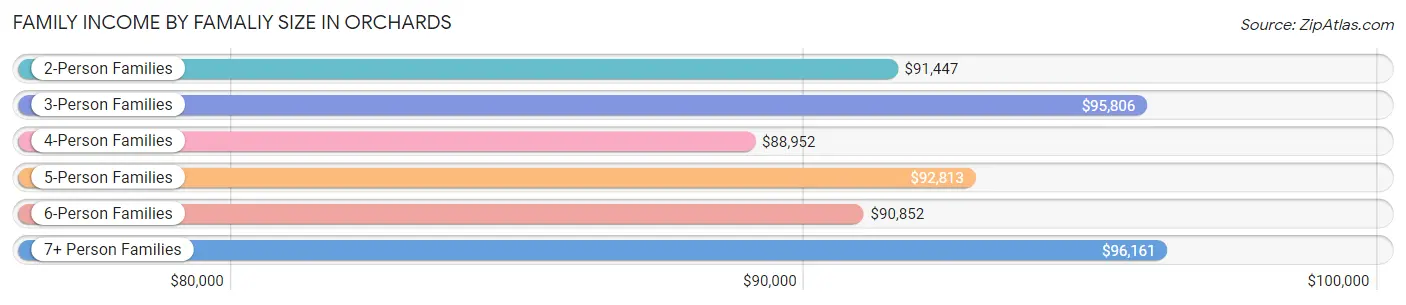
Family Income by Famaliy Size in Orchards
7+ person families (189 | 2.5%) account for the highest median family income in Orchards with $96,161 per family, while 2-person families (3,002 | 39.8%) have the highest median income of $45,724 per family member.
| Income Bracket | # Families | Median Income |
| 2-Person Families | 3,002 (39.8%) | $91,447 |
| 3-Person Families | 1,996 (26.4%) | $95,806 |
| 4-Person Families | 1,202 (15.9%) | $88,952 |
| 5-Person Families | 951 (12.6%) | $92,813 |
| 6-Person Families | 211 (2.8%) | $90,852 |
| 7+ Person Families | 189 (2.5%) | $96,161 |
| Total | 7,551 (100.0%) | $92,263 |
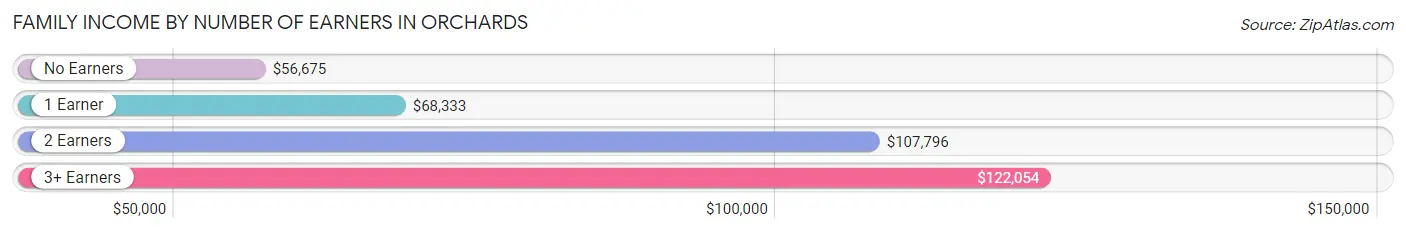
Family Income by Number of Earners in Orchards
The median family income in Orchards is $92,263, with families comprising 3+ earners (905) having the highest median family income of $122,054, while families with no earners (660) have the lowest median family income of $56,675, accounting for 12.0% and 8.7% of families, respectively.
| Number of Earners | # Families | Median Income |
| No Earners | 660 (8.7%) | $56,675 |
| 1 Earner | 2,758 (36.5%) | $68,333 |
| 2 Earners | 3,228 (42.7%) | $107,796 |
| 3+ Earners | 905 (12.0%) | $122,054 |
| Total | 7,551 (100.0%) | $92,263 |
Household Income in Orchards
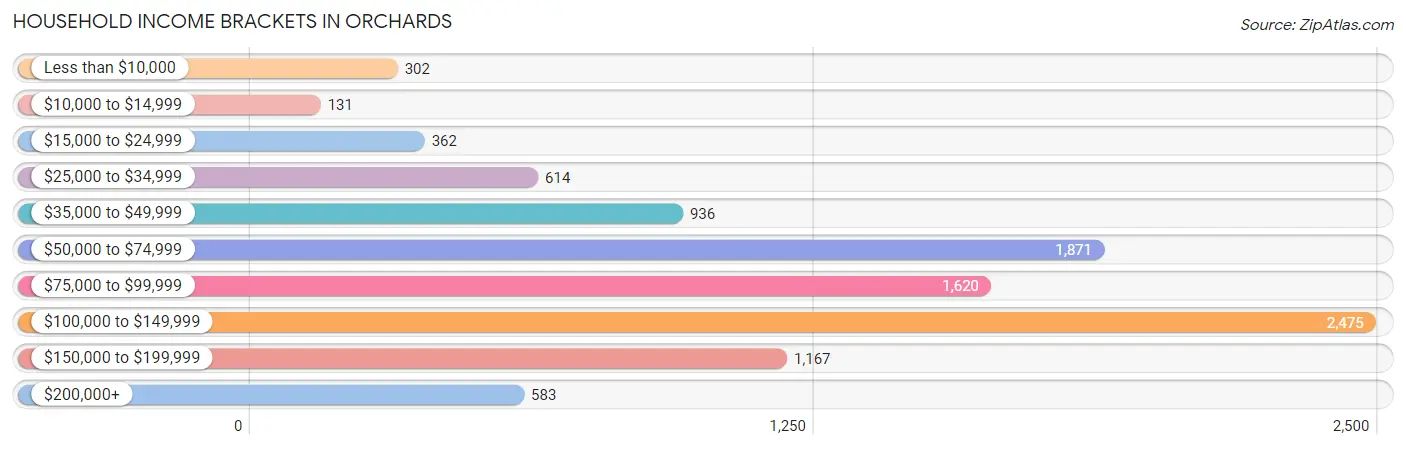
Household Income Brackets in Orchards
With 2,475 households falling in the category, the $100,000 to $149,999 income range is the most frequent in Orchards, accounting for 24.6% of all households. In contrast, only 131 households (1.3%) fall into the $10,000 to $14,999 income bracket, making it the least populous group.
| Income Bracket | # Households | % Households |
| Less than $10,000 | 302 | 3.0% |
| $10,000 to $14,999 | 131 | 1.3% |
| $15,000 to $24,999 | 362 | 3.6% |
| $25,000 to $34,999 | 614 | 6.1% |
| $35,000 to $49,999 | 936 | 9.3% |
| $50,000 to $74,999 | 1,871 | 18.6% |
| $75,000 to $99,999 | 1,620 | 16.1% |
| $100,000 to $149,999 | 2,475 | 24.6% |
| $150,000 to $199,999 | 1,167 | 11.6% |
| $200,000+ | 583 | 5.8% |
Household Income by Householder Age in Orchards
The median household income in Orchards is $88,199, with the highest median household income of $96,197 found in the 45 to 64 years age bracket for the primary householder. A total of 3,428 households (34.1%) fall into this category. Meanwhile, the 15 to 24 years age bracket for the primary householder has the lowest median household income of $67,524, with 461 households (4.6%) in this group.
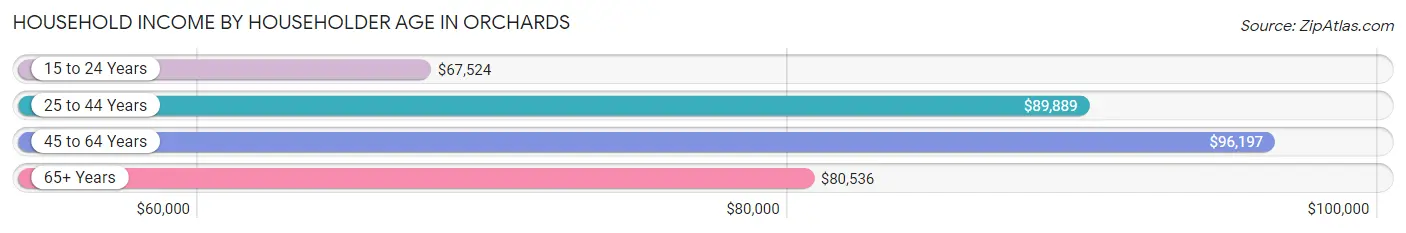
| Income Bracket | # Households | Median Income |
| 15 to 24 Years | 461 (4.6%) | $67,524 |
| 25 to 44 Years | 4,400 (43.7%) | $89,889 |
| 45 to 64 Years | 3,428 (34.1%) | $96,197 |
| 65+ Years | 1,771 (17.6%) | $80,536 |
| Total | 10,060 (100.0%) | $88,199 |
Poverty in Orchards
Income Below Poverty by Sex and Age in Orchards
With 10.5% poverty level for males and 13.4% for females among the residents of Orchards, 12 to 14 year old males and 15 year old females are the most vulnerable to poverty, with 151 males (22.2%) and 85 females (59.4%) in their respective age groups living below the poverty level.
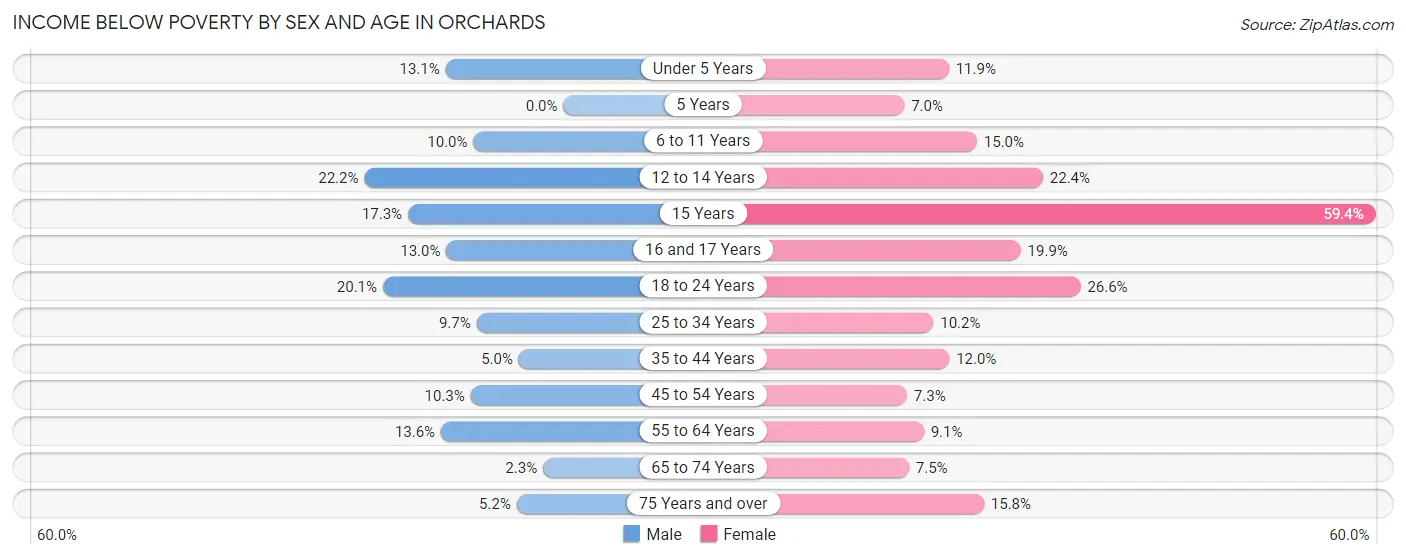
| Age Bracket | Male | Female |
| Under 5 Years | 105 (13.1%) | 103 (11.9%) |
| 5 Years | 0 (0.0%) | 33 (7.0%) |
| 6 to 11 Years | 183 (10.0%) | 190 (15.0%) |
| 12 to 14 Years | 151 (22.2%) | 137 (22.4%) |
| 15 Years | 49 (17.3%) | 85 (59.4%) |
| 16 and 17 Years | 24 (13.0%) | 96 (19.9%) |
| 18 to 24 Years | 283 (20.1%) | 361 (26.6%) |
| 25 to 34 Years | 200 (9.7%) | 221 (10.2%) |
| 35 to 44 Years | 122 (5.0%) | 272 (12.0%) |
| 45 to 54 Years | 173 (10.3%) | 111 (7.2%) |
| 55 to 64 Years | 226 (13.6%) | 140 (9.1%) |
| 65 to 74 Years | 24 (2.3%) | 70 (7.5%) |
| 75 Years and over | 25 (5.2%) | 81 (15.8%) |
| Total | 1,565 (10.5%) | 1,900 (13.4%) |
Income Above Poverty by Sex and Age in Orchards
According to the poverty statistics in Orchards, males aged 5 years and females aged 5 years are the age groups that are most secure financially, with 100.0% of males and 93.0% of females in these age groups living above the poverty line.
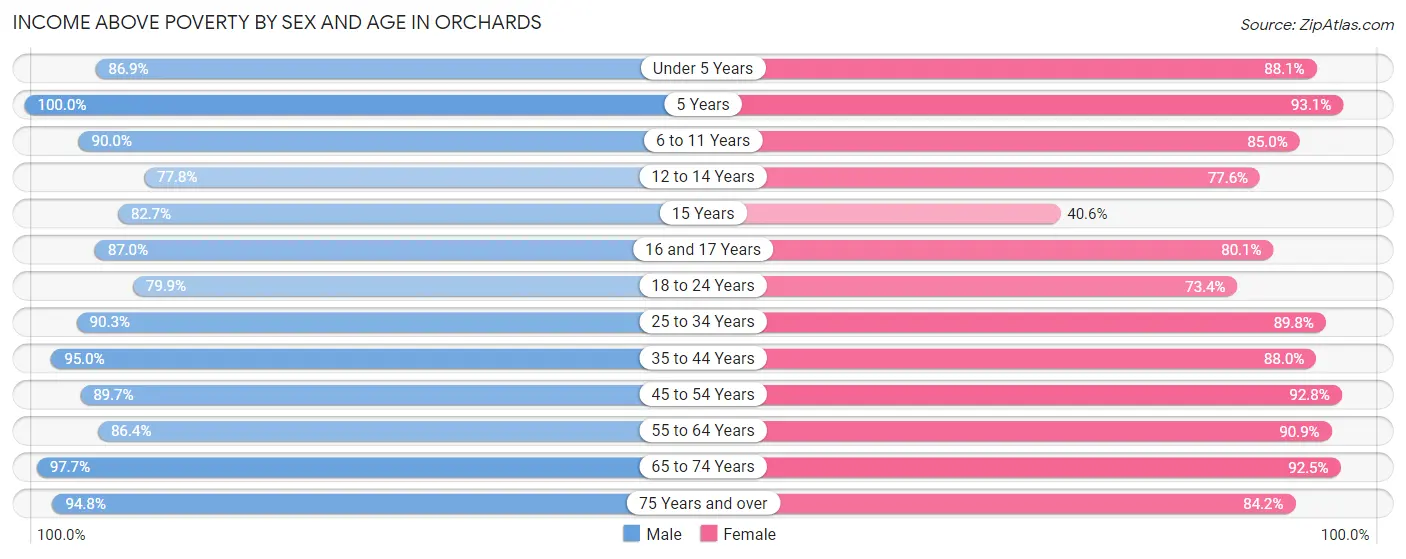
| Age Bracket | Male | Female |
| Under 5 Years | 695 (86.9%) | 762 (88.1%) |
| 5 Years | 352 (100.0%) | 442 (93.0%) |
| 6 to 11 Years | 1,643 (90.0%) | 1,073 (85.0%) |
| 12 to 14 Years | 530 (77.8%) | 475 (77.6%) |
| 15 Years | 234 (82.7%) | 58 (40.6%) |
| 16 and 17 Years | 160 (87.0%) | 386 (80.1%) |
| 18 to 24 Years | 1,125 (79.9%) | 997 (73.4%) |
| 25 to 34 Years | 1,868 (90.3%) | 1,948 (89.8%) |
| 35 to 44 Years | 2,339 (95.0%) | 2,003 (88.0%) |
| 45 to 54 Years | 1,502 (89.7%) | 1,421 (92.7%) |
| 55 to 64 Years | 1,432 (86.4%) | 1,395 (90.9%) |
| 65 to 74 Years | 1,031 (97.7%) | 867 (92.5%) |
| 75 Years and over | 457 (94.8%) | 431 (84.2%) |
| Total | 13,368 (89.5%) | 12,258 (86.6%) |
Income Below Poverty Among Married-Couple Families in Orchards
The poverty statistics for married-couple families in Orchards show that 6.5% or 333 of the total 5,132 families live below the poverty line. Families with 5 or more children have the highest poverty rate of 16.9%, comprising of 11 families. On the other hand, families with no children have the lowest poverty rate of 3.4%, which includes 92 families.
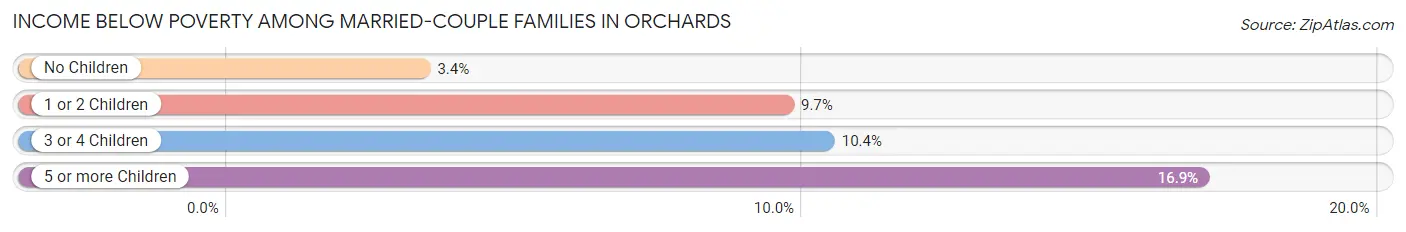
| Children | Above Poverty | Below Poverty |
| No Children | 2,651 (96.7%) | 92 (3.4%) |
| 1 or 2 Children | 1,456 (90.3%) | 156 (9.7%) |
| 3 or 4 Children | 638 (89.6%) | 74 (10.4%) |
| 5 or more Children | 54 (83.1%) | 11 (16.9%) |
| Total | 4,799 (93.5%) | 333 (6.5%) |
Income Below Poverty Among Single-Parent Households in Orchards
According to the poverty data in Orchards, 20.8% or 169 single-father households and 16.6% or 267 single-mother households are living below the poverty line. Among single-father households, those with 1 or 2 children have the highest poverty rate, with 144 households (33.5%) experiencing poverty. Likewise, among single-mother households, those with 1 or 2 children have the highest poverty rate, with 251 households (22.5%) falling below the poverty line.
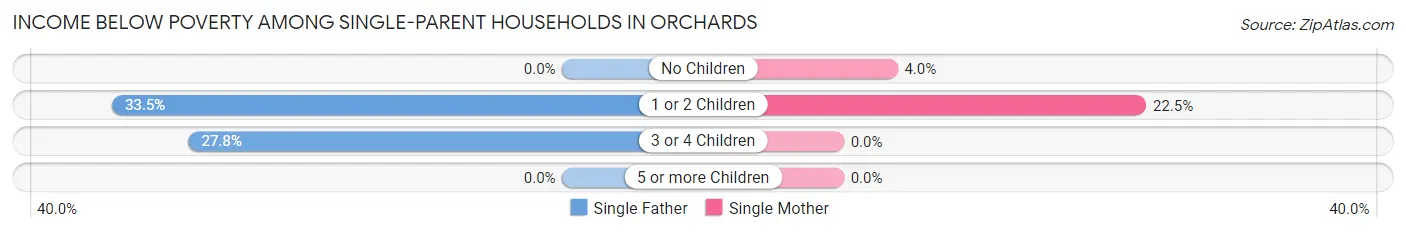
| Children | Single Father | Single Mother |
| No Children | 0 (0.0%) | 16 (4.0%) |
| 1 or 2 Children | 144 (33.5%) | 251 (22.5%) |
| 3 or 4 Children | 25 (27.8%) | 0 (0.0%) |
| 5 or more Children | 0 (0.0%) | 0 (0.0%) |
| Total | 169 (20.8%) | 267 (16.6%) |
Income Below Poverty Among Married-Couple vs Single-Parent Households in Orchards
The poverty data for Orchards shows that 333 of the married-couple family households (6.5%) and 436 of the single-parent households (18.0%) are living below the poverty level. Within the married-couple family households, those with 5 or more children have the highest poverty rate, with 11 households (16.9%) falling below the poverty line. Among the single-parent households, those with 1 or 2 children have the highest poverty rate, with 395 household (25.6%) living below poverty.
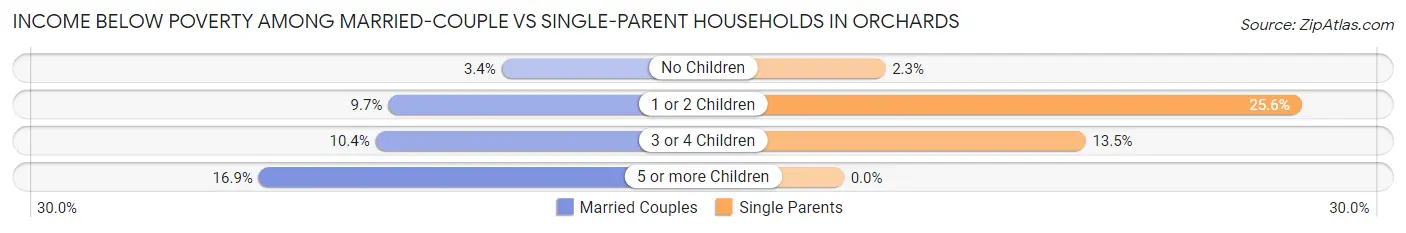
| Children | Married-Couple Families | Single-Parent Households |
| No Children | 92 (3.4%) | 16 (2.3%) |
| 1 or 2 Children | 156 (9.7%) | 395 (25.6%) |
| 3 or 4 Children | 74 (10.4%) | 25 (13.5%) |
| 5 or more Children | 11 (16.9%) | 0 (0.0%) |
| Total | 333 (6.5%) | 436 (18.0%) |
Race in Orchards
The most populous races in Orchards are White / Caucasian (21,706 | 74.3%), Two or more Races (4,515 | 15.4%), and Hispanic or Latino (4,176 | 14.3%).
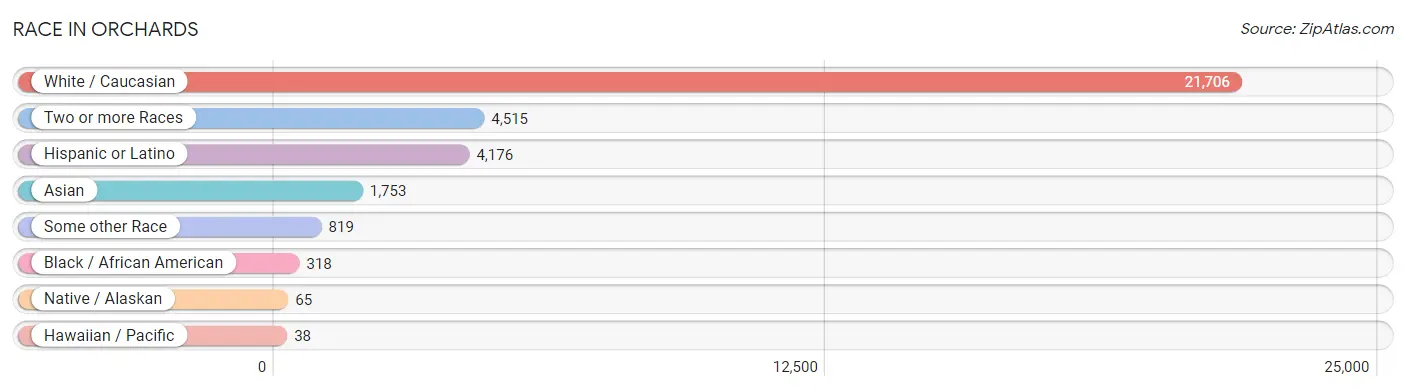
| Race | # Population | % Population |
| Asian | 1,753 | 6.0% |
| Black / African American | 318 | 1.1% |
| Hawaiian / Pacific | 38 | 0.1% |
| Hispanic or Latino | 4,176 | 14.3% |
| Native / Alaskan | 65 | 0.2% |
| White / Caucasian | 21,706 | 74.3% |
| Two or more Races | 4,515 | 15.4% |
| Some other Race | 819 | 2.8% |
| Total | 29,214 | 100.0% |
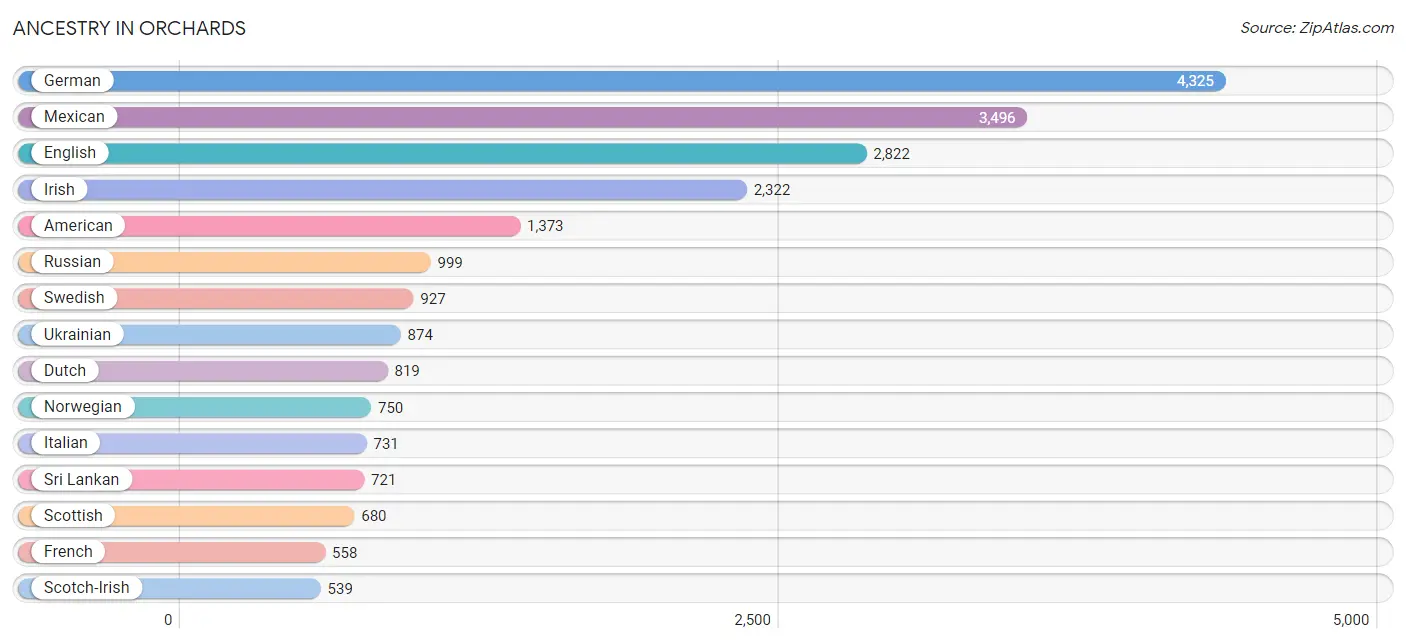
Ancestry in Orchards
The most populous ancestries reported in Orchards are German (4,325 | 14.8%), Mexican (3,496 | 12.0%), English (2,822 | 9.7%), Irish (2,322 | 8.0%), and American (1,373 | 4.7%), together accounting for 49.1% of all Orchards residents.
| Ancestry | # Population | % Population |
| African | 13 | 0.0% |
| Alaska Native | 8 | 0.0% |
| Albanian | 2 | 0.0% |
| Alsatian | 11 | 0.0% |
| American | 1,373 | 4.7% |
| Arab | 151 | 0.5% |
| Argentinean | 17 | 0.1% |
| Australian | 38 | 0.1% |
| Austrian | 76 | 0.3% |
| Belgian | 12 | 0.0% |
| Bhutanese | 130 | 0.4% |
| British | 300 | 1.0% |
| Burmese | 238 | 0.8% |
| Canadian | 47 | 0.2% |
| Central American | 165 | 0.6% |
| Central American Indian | 11 | 0.0% |
| Cherokee | 46 | 0.2% |
| Chickasaw | 18 | 0.1% |
| Chilean | 105 | 0.4% |
| Chippewa | 10 | 0.0% |
| Choctaw | 23 | 0.1% |
| Colombian | 11 | 0.0% |
| Creek | 41 | 0.1% |
| Cuban | 12 | 0.0% |
| Czech | 73 | 0.3% |
| Danish | 197 | 0.7% |
| Dutch | 819 | 2.8% |
| Eastern European | 122 | 0.4% |
| English | 2,822 | 9.7% |
| European | 473 | 1.6% |
| Fijian | 5 | 0.0% |
| Filipino | 52 | 0.2% |
| Finnish | 158 | 0.5% |
| French | 558 | 1.9% |
| French Canadian | 72 | 0.3% |
| German | 4,325 | 14.8% |
| Greek | 142 | 0.5% |
| Guamanian / Chamorro | 215 | 0.7% |
| Guatemalan | 142 | 0.5% |
| Hungarian | 113 | 0.4% |
| Indian (Asian) | 161 | 0.5% |
| Iranian | 48 | 0.2% |
| Irish | 2,322 | 8.0% |
| Italian | 731 | 2.5% |
| Japanese | 265 | 0.9% |
| Korean | 460 | 1.6% |
| Lebanese | 33 | 0.1% |
| Malaysian | 32 | 0.1% |
| Maltese | 9 | 0.0% |
| Mexican | 3,496 | 12.0% |
| Mexican American Indian | 24 | 0.1% |
| Native Hawaiian | 102 | 0.4% |
| Navajo | 9 | 0.0% |
| Nepalese | 64 | 0.2% |
| Nigerian | 21 | 0.1% |
| Norwegian | 750 | 2.6% |
| Pakistani | 26 | 0.1% |
| Palestinian | 15 | 0.1% |
| Panamanian | 17 | 0.1% |
| Peruvian | 8 | 0.0% |
| Polish | 238 | 0.8% |
| Portuguese | 65 | 0.2% |
| Puerto Rican | 11 | 0.0% |
| Romanian | 89 | 0.3% |
| Russian | 999 | 3.4% |
| Salvadoran | 6 | 0.0% |
| Samoan | 172 | 0.6% |
| Scandinavian | 163 | 0.6% |
| Scotch-Irish | 539 | 1.8% |
| Scottish | 680 | 2.3% |
| Serbian | 27 | 0.1% |
| Sioux | 91 | 0.3% |
| Slavic | 28 | 0.1% |
| Slovak | 6 | 0.0% |
| South American | 141 | 0.5% |
| Spaniard | 263 | 0.9% |
| Spanish | 61 | 0.2% |
| Sri Lankan | 721 | 2.5% |
| Subsaharan African | 34 | 0.1% |
| Swedish | 927 | 3.2% |
| Swiss | 228 | 0.8% |
| Thai | 359 | 1.2% |
| Turkish | 168 | 0.6% |
| Ukrainian | 874 | 3.0% |
| Welsh | 250 | 0.9% |
| Yaqui | 11 | 0.0% |
| Yugoslavian | 365 | 1.3% | View All 87 Rows |
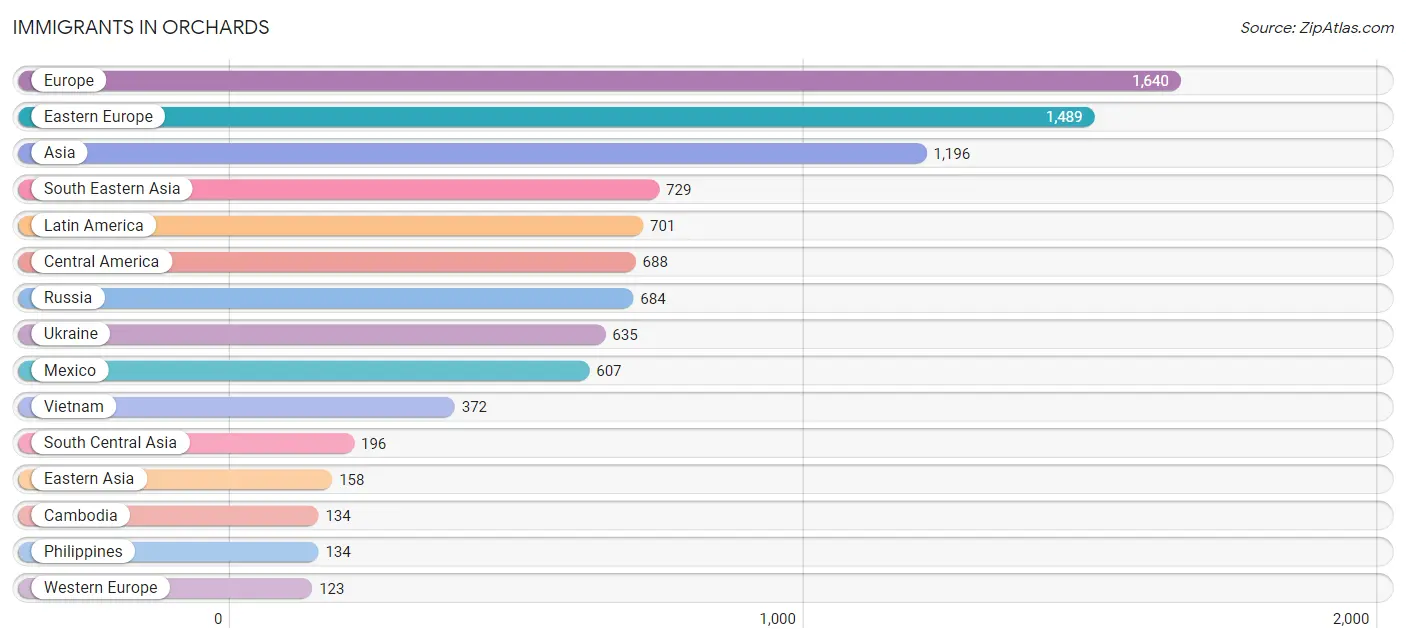
Immigrants in Orchards
The most numerous immigrant groups reported in Orchards came from Europe (1,640 | 5.6%), Eastern Europe (1,489 | 5.1%), Asia (1,196 | 4.1%), South Eastern Asia (729 | 2.5%), and Latin America (701 | 2.4%), together accounting for 19.7% of all Orchards residents.
| Immigration Origin | # Population | % Population |
| Africa | 15 | 0.1% |
| Asia | 1,196 | 4.1% |
| Bangladesh | 83 | 0.3% |
| Bosnia and Herzegovina | 108 | 0.4% |
| Cambodia | 134 | 0.5% |
| Canada | 65 | 0.2% |
| Central America | 688 | 2.4% |
| Chile | 13 | 0.0% |
| China | 50 | 0.2% |
| Eastern Asia | 158 | 0.5% |
| Eastern Europe | 1,489 | 5.1% |
| Egypt | 2 | 0.0% |
| El Salvador | 6 | 0.0% |
| Europe | 1,640 | 5.6% |
| Fiji | 17 | 0.1% |
| France | 15 | 0.1% |
| Germany | 108 | 0.4% |
| Guatemala | 58 | 0.2% |
| Hong Kong | 20 | 0.1% |
| Iran | 48 | 0.2% |
| Japan | 23 | 0.1% |
| Korea | 85 | 0.3% |
| Laos | 64 | 0.2% |
| Latin America | 701 | 2.4% |
| Mexico | 607 | 2.1% |
| Moldova | 17 | 0.1% |
| Northern Africa | 2 | 0.0% |
| Northern Europe | 28 | 0.1% |
| Norway | 10 | 0.0% |
| Oceania | 22 | 0.1% |
| Panama | 17 | 0.1% |
| Philippines | 134 | 0.5% |
| Romania | 25 | 0.1% |
| Russia | 684 | 2.3% |
| Serbia | 14 | 0.1% |
| South Africa | 13 | 0.0% |
| South America | 13 | 0.0% |
| South Central Asia | 196 | 0.7% |
| South Eastern Asia | 729 | 2.5% |
| Syria | 13 | 0.0% |
| Taiwan | 16 | 0.1% |
| Thailand | 25 | 0.1% |
| Ukraine | 635 | 2.2% |
| Uzbekistan | 65 | 0.2% |
| Vietnam | 372 | 1.3% |
| Western Asia | 113 | 0.4% |
| Western Europe | 123 | 0.4% | View All 47 Rows |
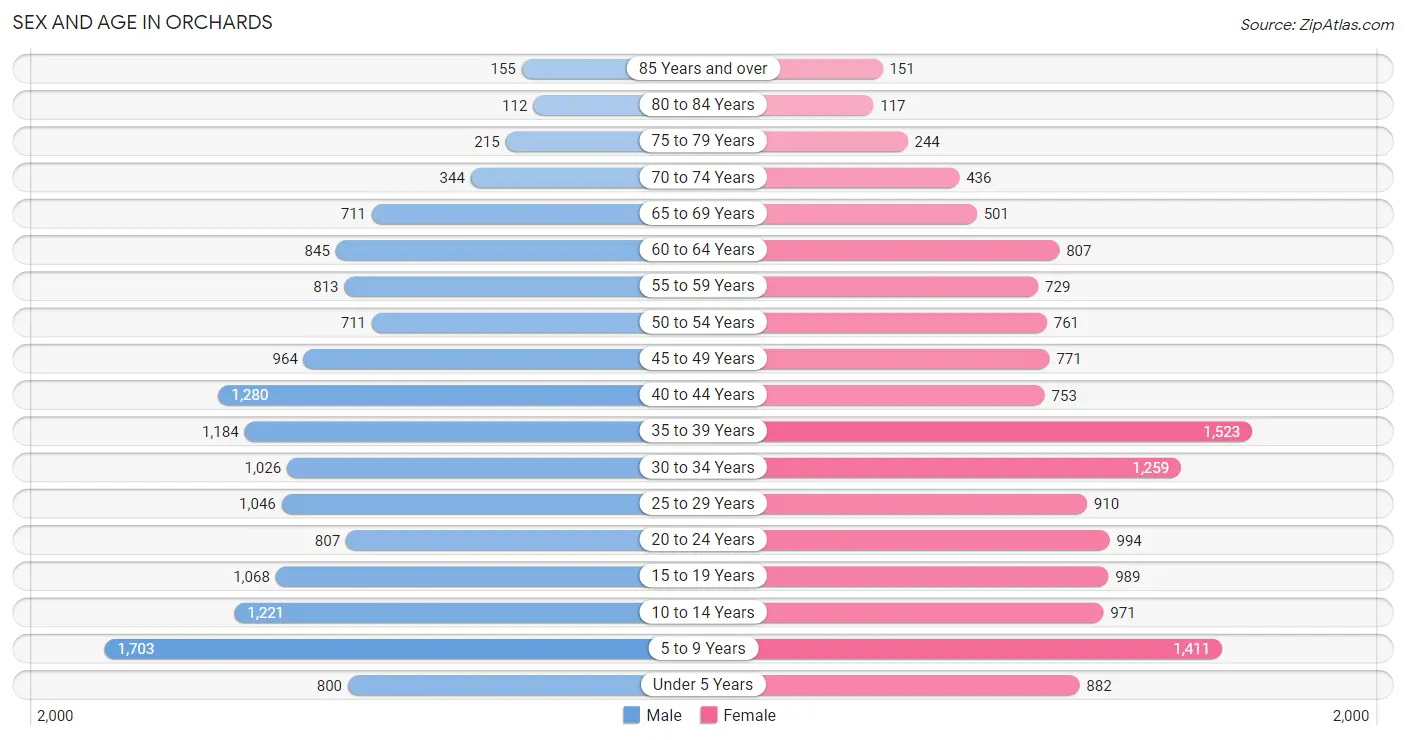
Sex and Age in Orchards
Sex and Age in Orchards
The most populous age groups in Orchards are 5 to 9 Years (1,703 | 11.4%) for men and 35 to 39 Years (1,523 | 10.7%) for women.
| Age Bracket | Male | Female |
| Under 5 Years | 800 (5.3%) | 882 (6.2%) |
| 5 to 9 Years | 1,703 (11.4%) | 1,411 (9.9%) |
| 10 to 14 Years | 1,221 (8.1%) | 971 (6.8%) |
| 15 to 19 Years | 1,068 (7.1%) | 989 (7.0%) |
| 20 to 24 Years | 807 (5.4%) | 994 (7.0%) |
| 25 to 29 Years | 1,046 (7.0%) | 910 (6.4%) |
| 30 to 34 Years | 1,026 (6.8%) | 1,259 (8.9%) |
| 35 to 39 Years | 1,184 (7.9%) | 1,523 (10.7%) |
| 40 to 44 Years | 1,280 (8.5%) | 753 (5.3%) |
| 45 to 49 Years | 964 (6.4%) | 771 (5.4%) |
| 50 to 54 Years | 711 (4.7%) | 761 (5.4%) |
| 55 to 59 Years | 813 (5.4%) | 729 (5.1%) |
| 60 to 64 Years | 845 (5.6%) | 807 (5.7%) |
| 65 to 69 Years | 711 (4.7%) | 501 (3.5%) |
| 70 to 74 Years | 344 (2.3%) | 436 (3.1%) |
| 75 to 79 Years | 215 (1.4%) | 244 (1.7%) |
| 80 to 84 Years | 112 (0.7%) | 117 (0.8%) |
| 85 Years and over | 155 (1.0%) | 151 (1.1%) |
| Total | 15,005 (100.0%) | 14,209 (100.0%) |
Families and Households in Orchards
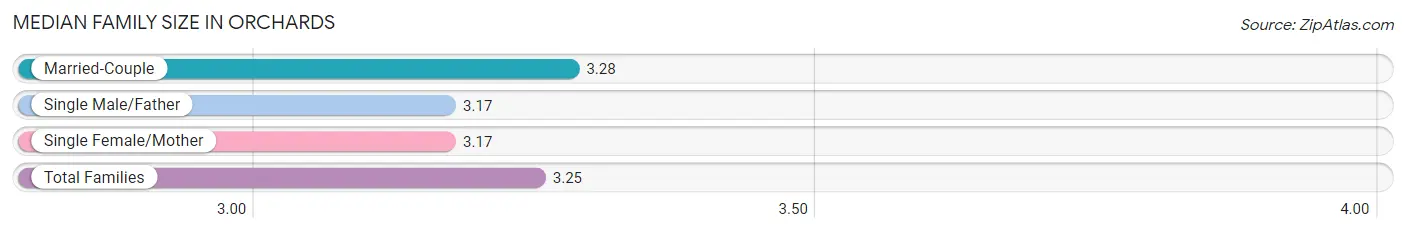
Median Family Size in Orchards
The median family size in Orchards is 3.25 persons per family, with married-couple families (5,132 | 68.0%) accounting for the largest median family size of 3.28 persons per family. On the other hand, single male/father families (811 | 10.7%) represent the smallest median family size with 3.17 persons per family.
| Family Type | # Families | Family Size |
| Married-Couple | 5,132 (68.0%) | 3.28 |
| Single Male/Father | 811 (10.7%) | 3.17 |
| Single Female/Mother | 1,608 (21.3%) | 3.17 |
| Total Families | 7,551 (100.0%) | 3.25 |
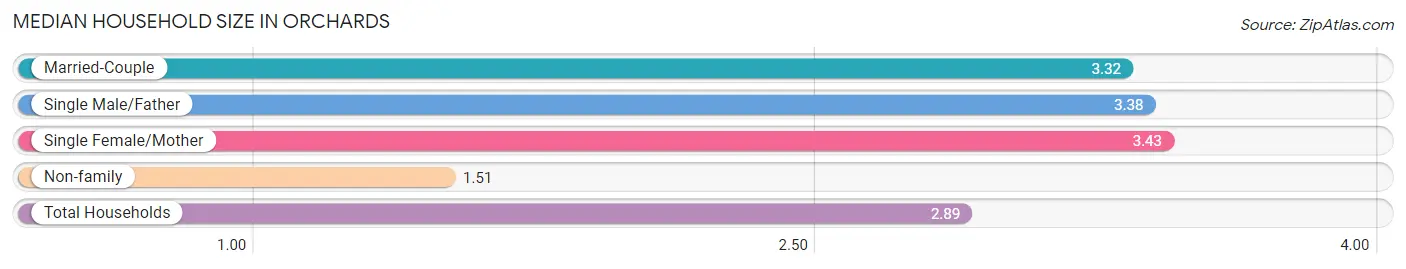
Median Household Size in Orchards
The median household size in Orchards is 2.89 persons per household, with single female/mother households (1,608 | 16.0%) accounting for the largest median household size of 3.43 persons per household. non-family households (2,509 | 24.9%) represent the smallest median household size with 1.51 persons per household.
| Household Type | # Households | Household Size |
| Married-Couple | 5,132 (51.0%) | 3.32 |
| Single Male/Father | 811 (8.1%) | 3.38 |
| Single Female/Mother | 1,608 (16.0%) | 3.43 |
| Non-family | 2,509 (24.9%) | 1.51 |
| Total Households | 10,060 (100.0%) | 2.89 |
Household Size by Marriage Status in Orchards
Out of a total of 10,060 households in Orchards, 7,551 (75.1%) are family households, while 2,509 (24.9%) are nonfamily households. The most numerous type of family households are 2-person households, comprising 2,833, and the most common type of nonfamily households are 1-person households, comprising 1,613.
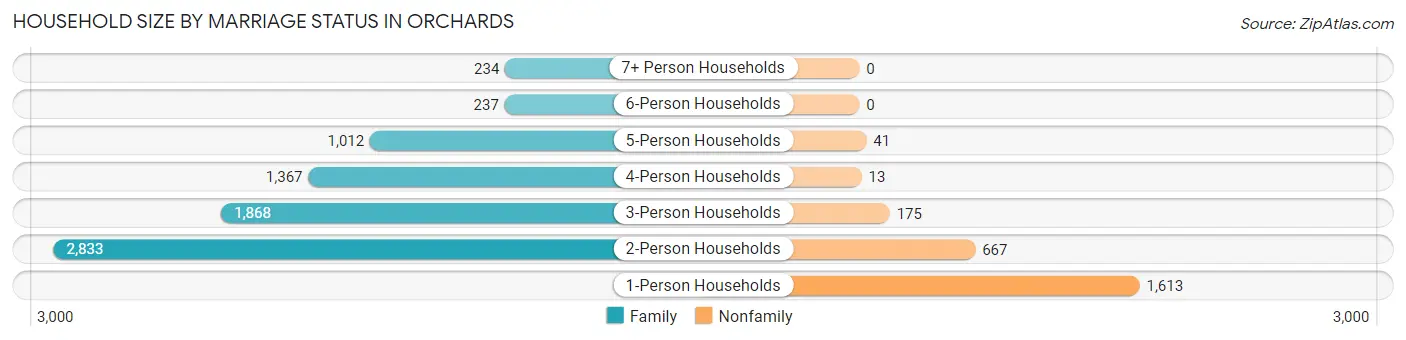
| Household Size | Family Households | Nonfamily Households |
| 1-Person Households | - | 1,613 (16.0%) |
| 2-Person Households | 2,833 (28.2%) | 667 (6.6%) |
| 3-Person Households | 1,868 (18.6%) | 175 (1.7%) |
| 4-Person Households | 1,367 (13.6%) | 13 (0.1%) |
| 5-Person Households | 1,012 (10.1%) | 41 (0.4%) |
| 6-Person Households | 237 (2.4%) | 0 (0.0%) |
| 7+ Person Households | 234 (2.3%) | 0 (0.0%) |
| Total | 7,551 (75.1%) | 2,509 (24.9%) |
Female Fertility in Orchards
Fertility by Age in Orchards
Average fertility rate in Orchards is 57.0 births per 1,000 women. Women in the age bracket of 20 to 34 years have the highest fertility rate with 93.0 births per 1,000 women. Women in the age bracket of 20 to 34 years acount for 70.4% of all women with births.
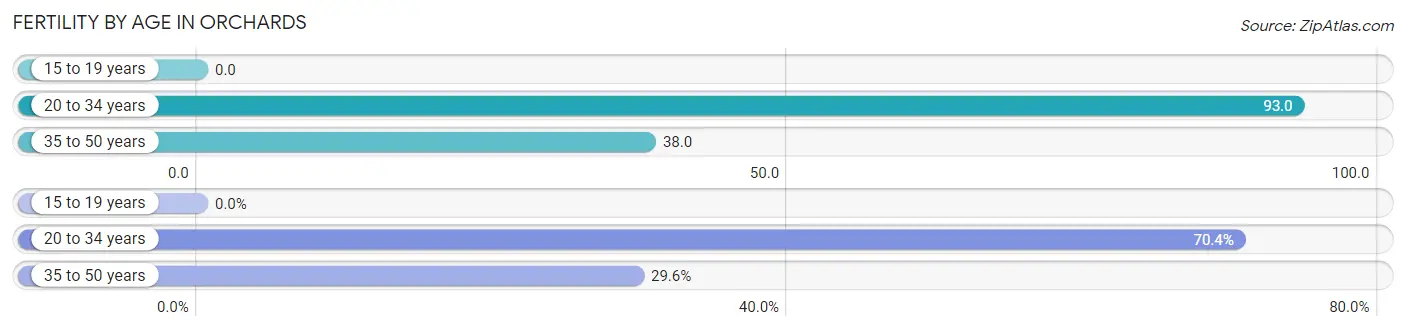
| Age Bracket | Women with Births | Births / 1,000 Women |
| 15 to 19 years | 0 (0.0%) | 0.0 |
| 20 to 34 years | 295 (70.4%) | 93.0 |
| 35 to 50 years | 124 (29.6%) | 38.0 |
| Total | 419 (100.0%) | 57.0 |
Fertility by Age by Marriage Status in Orchards
83.8% of women with births (419) in Orchards are married. The highest percentage of unmarried women with births falls into 20 to 34 years age bracket with 21.4% of them unmarried at the time of birth, while the lowest percentage of unmarried women with births belong to 35 to 50 years age bracket with 4.0% of them unmarried.
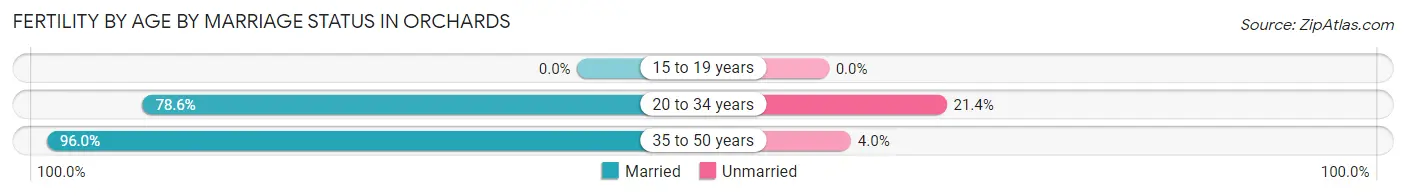
| Age Bracket | Married | Unmarried |
| 15 to 19 years | 0 (0.0%) | 0 (0.0%) |
| 20 to 34 years | 232 (78.6%) | 63 (21.4%) |
| 35 to 50 years | 119 (96.0%) | 5 (4.0%) |
| Total | 351 (83.8%) | 68 (16.2%) |
Fertility by Education in Orchards
Average fertility rate in Orchards is 57.0 births per 1,000 women. Women with the education attainment of bachelor's degree have the highest fertility rate of 114.0 births per 1,000 women, while women with the education attainment of less than high school have the lowest fertility at 22.0 births per 1,000 women. Women with the education attainment of college or associate's degree represent 36.0% of all women with births.
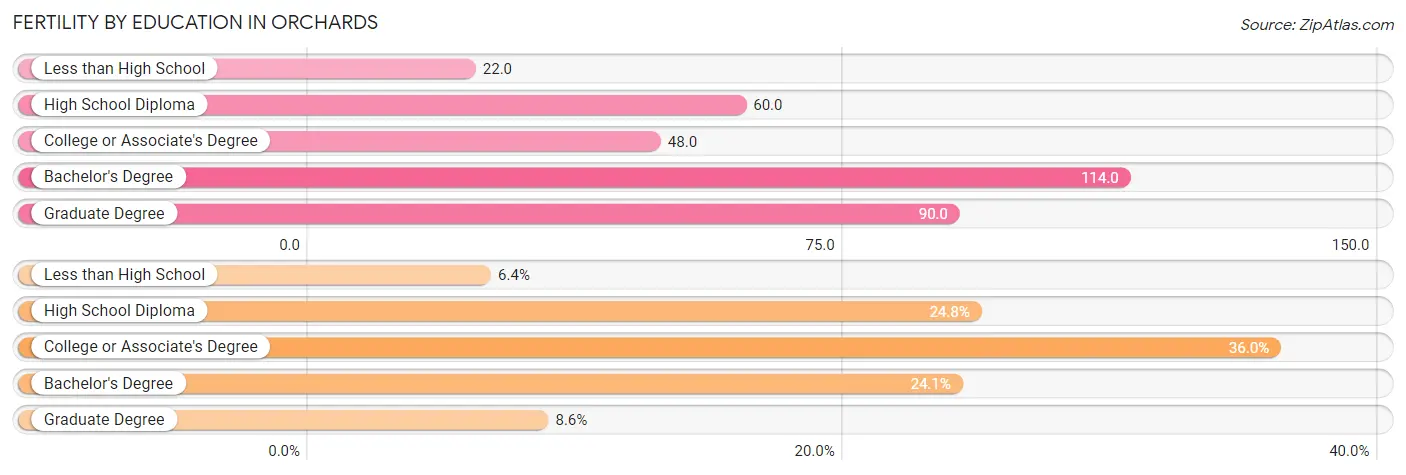
| Educational Attainment | Women with Births | Births / 1,000 Women |
| Less than High School | 27 (6.4%) | 22.0 |
| High School Diploma | 104 (24.8%) | 60.0 |
| College or Associate's Degree | 151 (36.0%) | 48.0 |
| Bachelor's Degree | 101 (24.1%) | 114.0 |
| Graduate Degree | 36 (8.6%) | 90.0 |
| Total | 419 (100.0%) | 57.0 |
Fertility by Education by Marriage Status in Orchards
16.2% of women with births in Orchards are unmarried. Women with the educational attainment of graduate degree are most likely to be married with 100.0% of them married at childbirth, while women with the educational attainment of less than high school are least likely to be married with 37.0% of them unmarried at childbirth.
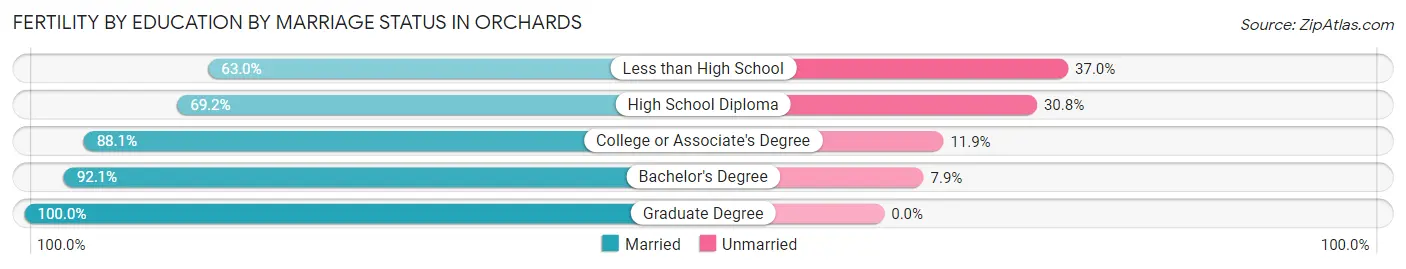
| Educational Attainment | Married | Unmarried |
| Less than High School | 17 (63.0%) | 10 (37.0%) |
| High School Diploma | 72 (69.2%) | 32 (30.8%) |
| College or Associate's Degree | 133 (88.1%) | 18 (11.9%) |
| Bachelor's Degree | 93 (92.1%) | 8 (7.9%) |
| Graduate Degree | 36 (100.0%) | 0 (0.0%) |
| Total | 351 (83.8%) | 68 (16.2%) |
Employment Characteristics in Orchards
Employment by Class of Employer in Orchards
Among the 13,678 employed individuals in Orchards, private company employees (10,316 | 75.4%), local government employees (972 | 7.1%), and not-for-profit organizations (818 | 6.0%) make up the most common classes of employment.
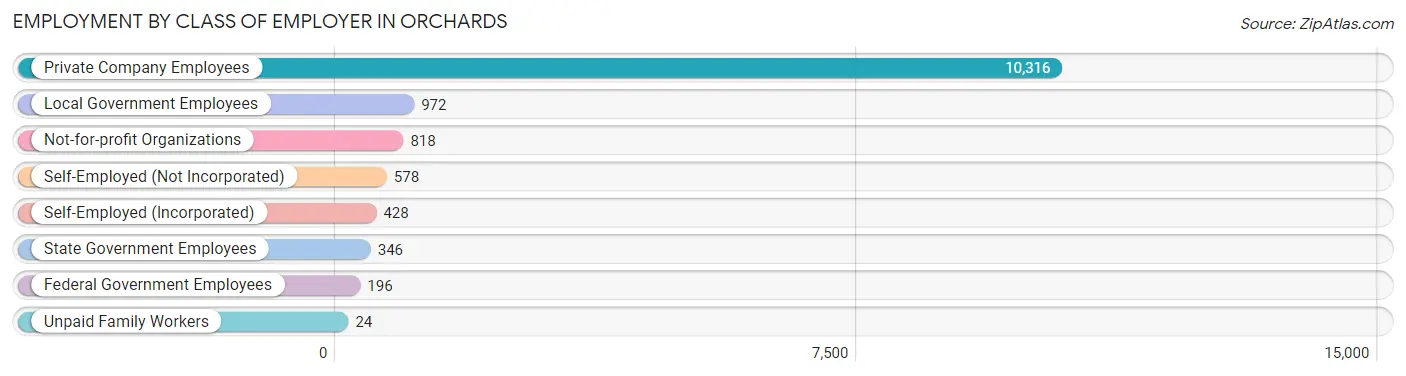
| Employer Class | # Employees | % Employees |
| Private Company Employees | 10,316 | 75.4% |
| Self-Employed (Incorporated) | 428 | 3.1% |
| Self-Employed (Not Incorporated) | 578 | 4.2% |
| Not-for-profit Organizations | 818 | 6.0% |
| Local Government Employees | 972 | 7.1% |
| State Government Employees | 346 | 2.5% |
| Federal Government Employees | 196 | 1.4% |
| Unpaid Family Workers | 24 | 0.2% |
| Total | 13,678 | 100.0% |
Employment Status by Age in Orchards
According to the labor force statistics for Orchards, out of the total population over 16 years of age (21,800), 69.2% or 15,086 individuals are in the labor force, with 6.7% or 1,011 of them unemployed. The age group with the highest labor force participation rate is 45 to 54 years, with 87.2% or 2,797 individuals in the labor force. Within the labor force, the 20 to 24 years age range has the highest percentage of unemployed individuals, with 17.9% or 274 of them being unemployed.
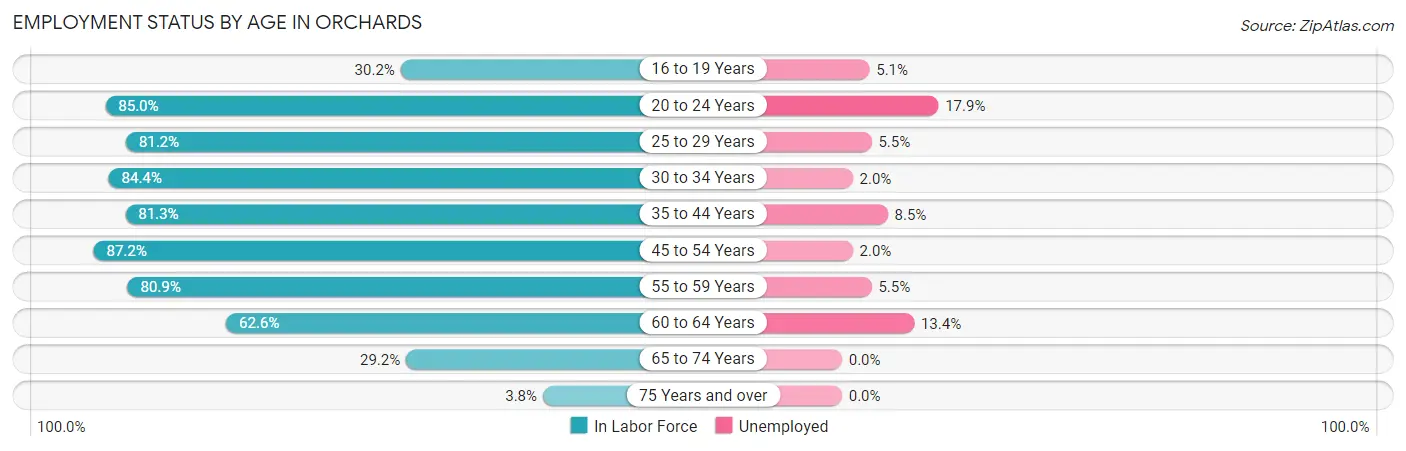
| Age Bracket | In Labor Force | Unemployed |
| 16 to 19 Years | 493 (30.2%) | 25 (5.1%) |
| 20 to 24 Years | 1,531 (85.0%) | 274 (17.9%) |
| 25 to 29 Years | 1,588 (81.2%) | 87 (5.5%) |
| 30 to 34 Years | 1,929 (84.4%) | 39 (2.0%) |
| 35 to 44 Years | 3,854 (81.3%) | 328 (8.5%) |
| 45 to 54 Years | 2,797 (87.2%) | 56 (2.0%) |
| 55 to 59 Years | 1,247 (80.9%) | 69 (5.5%) |
| 60 to 64 Years | 1,034 (62.6%) | 139 (13.4%) |
| 65 to 74 Years | 582 (29.2%) | 0 (0.0%) |
| 75 Years and over | 38 (3.8%) | 0 (0.0%) |
| Total | 15,086 (69.2%) | 1,011 (6.7%) |
Employment Status by Educational Attainment in Orchards
According to labor force statistics for Orchards, 80.9% of individuals (12,444) out of the total population between 25 and 64 years of age (15,382) are in the labor force, with 5.7% or 709 of them being unemployed. The group with the highest labor force participation rate are those with the educational attainment of bachelor's degree or higher, with 89.3% or 2,972 individuals in the labor force. Within the labor force, individuals with college / associate degree education have the highest percentage of unemployment, with 8.5% or 413 of them being unemployed.
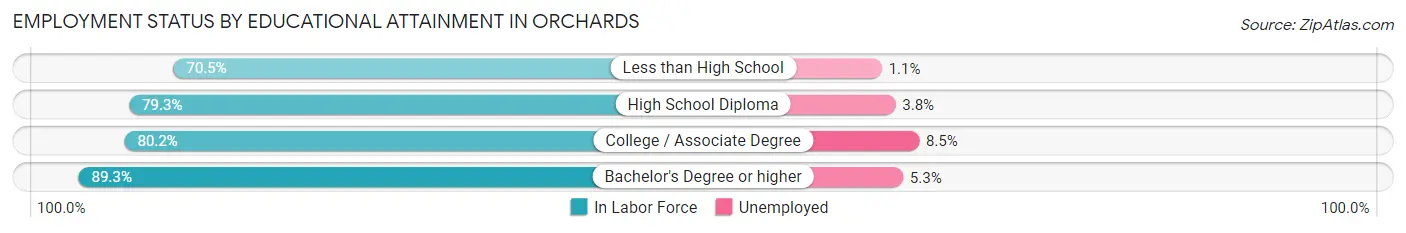
| Educational Attainment | In Labor Force | Unemployed |
| Less than High School | 1,127 (70.5%) | 18 (1.1%) |
| High School Diploma | 3,492 (79.3%) | 167 (3.8%) |
| College / Associate Degree | 4,855 (80.2%) | 515 (8.5%) |
| Bachelor's Degree or higher | 2,972 (89.3%) | 176 (5.3%) |
| Total | 12,444 (80.9%) | 877 (5.7%) |
Employment Occupations by Sex in Orchards
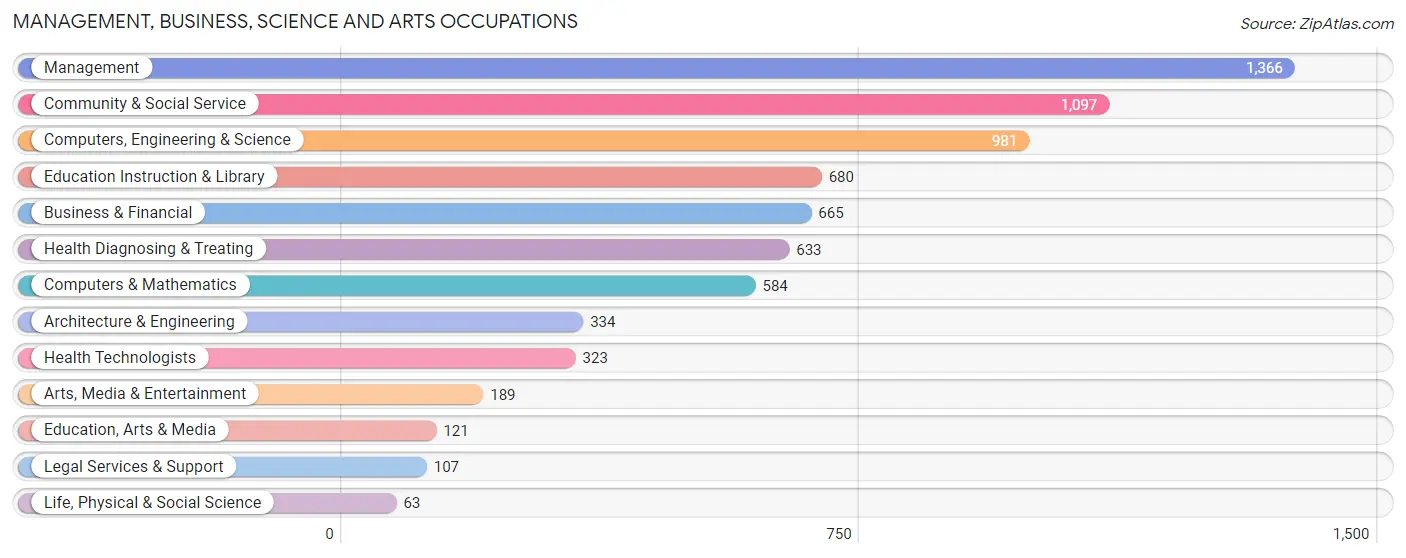
Management, Business, Science and Arts Occupations
The most common Management, Business, Science and Arts occupations in Orchards are Management (1,366 | 9.7%), Community & Social Service (1,097 | 7.8%), Computers, Engineering & Science (981 | 7.0%), Education Instruction & Library (680 | 4.8%), and Business & Financial (665 | 4.7%).
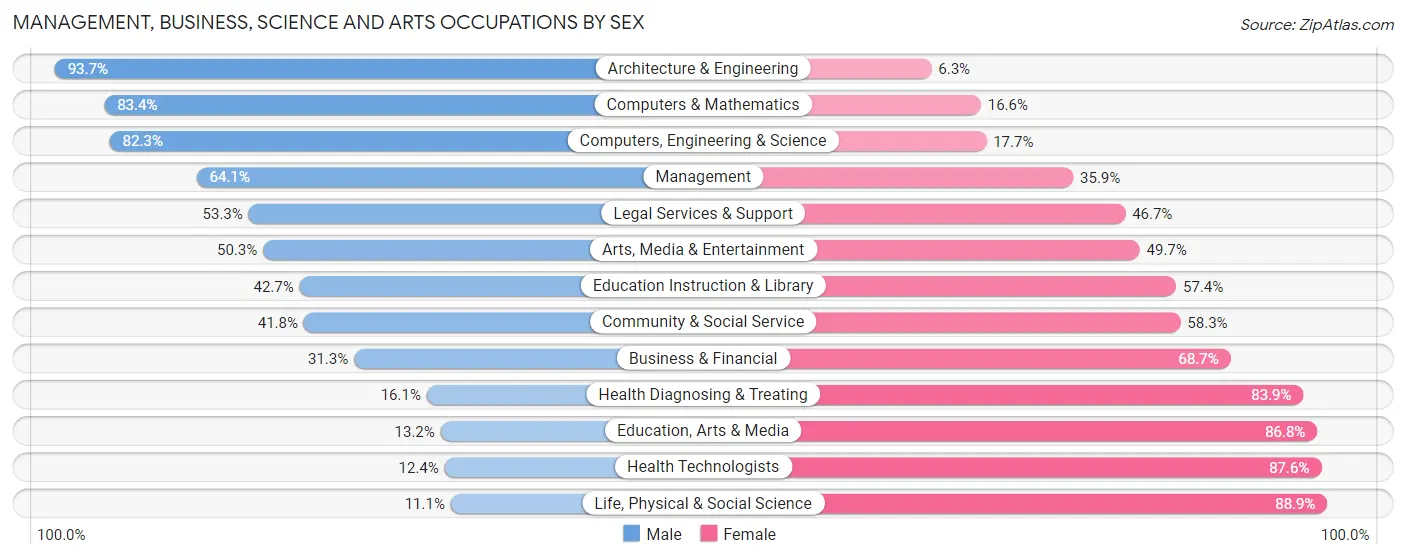
Management, Business, Science and Arts Occupations by Sex
Within the Management, Business, Science and Arts occupations in Orchards, the most male-oriented occupations are Architecture & Engineering (93.7%), Computers & Mathematics (83.4%), and Computers, Engineering & Science (82.3%), while the most female-oriented occupations are Life, Physical & Social Science (88.9%), Health Technologists (87.6%), and Education, Arts & Media (86.8%).
| Occupation | Male | Female |
| Management | 876 (64.1%) | 490 (35.9%) |
| Business & Financial | 208 (31.3%) | 457 (68.7%) |
| Computers, Engineering & Science | 807 (82.3%) | 174 (17.7%) |
| Computers & Mathematics | 487 (83.4%) | 97 (16.6%) |
| Architecture & Engineering | 313 (93.7%) | 21 (6.3%) |
| Life, Physical & Social Science | 7 (11.1%) | 56 (88.9%) |
| Community & Social Service | 458 (41.7%) | 639 (58.3%) |
| Education, Arts & Media | 16 (13.2%) | 105 (86.8%) |
| Legal Services & Support | 57 (53.3%) | 50 (46.7%) |
| Education Instruction & Library | 290 (42.6%) | 390 (57.4%) |
| Arts, Media & Entertainment | 95 (50.3%) | 94 (49.7%) |
| Health Diagnosing & Treating | 102 (16.1%) | 531 (83.9%) |
| Health Technologists | 40 (12.4%) | 283 (87.6%) |
| Total (Category) | 2,451 (51.7%) | 2,291 (48.3%) |
| Total (Overall) | 7,670 (54.5%) | 6,407 (45.5%) |
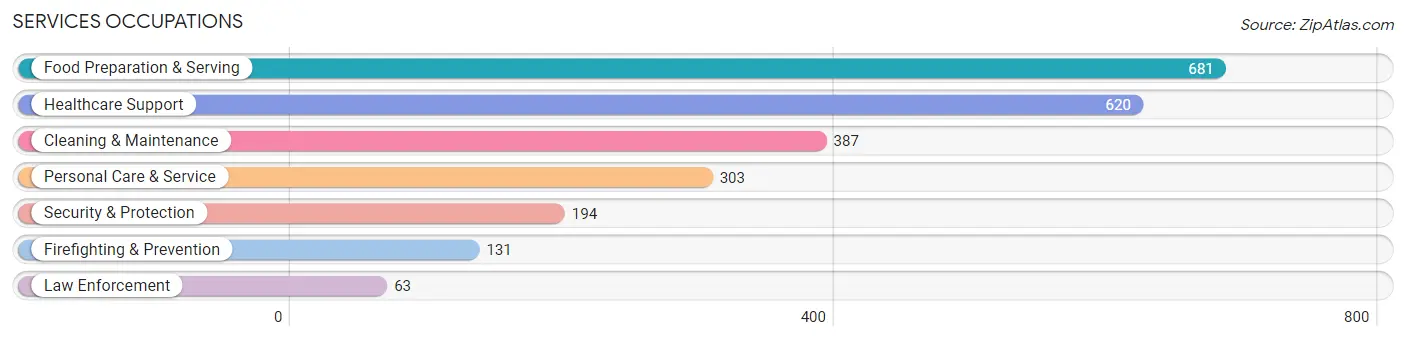
Services Occupations
The most common Services occupations in Orchards are Food Preparation & Serving (681 | 4.8%), Healthcare Support (620 | 4.4%), Cleaning & Maintenance (387 | 2.8%), Personal Care & Service (303 | 2.1%), and Security & Protection (194 | 1.4%).
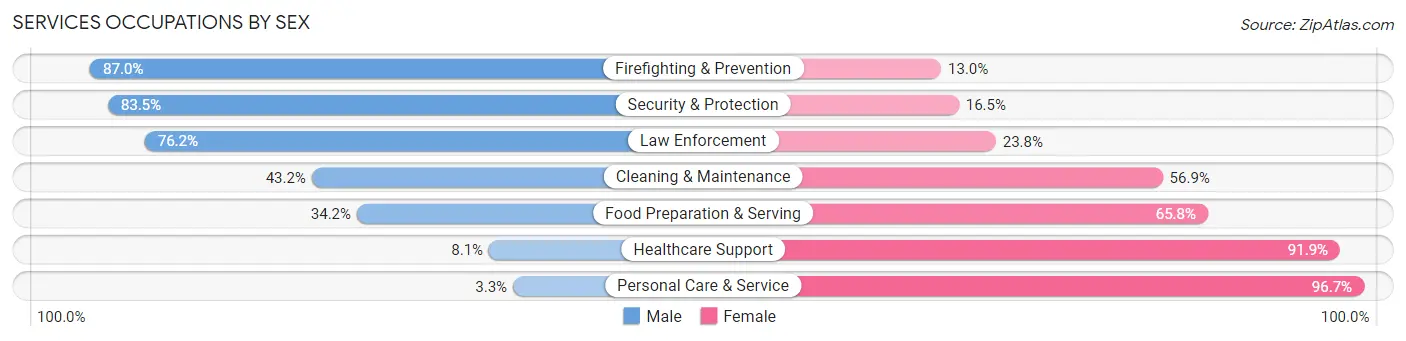
Services Occupations by Sex
Within the Services occupations in Orchards, the most male-oriented occupations are Firefighting & Prevention (87.0%), Security & Protection (83.5%), and Law Enforcement (76.2%), while the most female-oriented occupations are Personal Care & Service (96.7%), Healthcare Support (91.9%), and Food Preparation & Serving (65.8%).
| Occupation | Male | Female |
| Healthcare Support | 50 (8.1%) | 570 (91.9%) |
| Security & Protection | 162 (83.5%) | 32 (16.5%) |
| Firefighting & Prevention | 114 (87.0%) | 17 (13.0%) |
| Law Enforcement | 48 (76.2%) | 15 (23.8%) |
| Food Preparation & Serving | 233 (34.2%) | 448 (65.8%) |
| Cleaning & Maintenance | 167 (43.1%) | 220 (56.9%) |
| Personal Care & Service | 10 (3.3%) | 293 (96.7%) |
| Total (Category) | 622 (28.5%) | 1,563 (71.5%) |
| Total (Overall) | 7,670 (54.5%) | 6,407 (45.5%) |
Sales and Office Occupations
The most common Sales and Office occupations in Orchards are Office & Administration (1,506 | 10.7%), and Sales & Related (1,172 | 8.3%).

Sales and Office Occupations by Sex

| Occupation | Male | Female |
| Sales & Related | 582 (49.7%) | 590 (50.3%) |
| Office & Administration | 272 (18.1%) | 1,234 (81.9%) |
| Total (Category) | 854 (31.9%) | 1,824 (68.1%) |
| Total (Overall) | 7,670 (54.5%) | 6,407 (45.5%) |
Natural Resources, Construction and Maintenance Occupations
The most common Natural Resources, Construction and Maintenance occupations in Orchards are Construction & Extraction (780 | 5.5%), Installation, Maintenance & Repair (625 | 4.4%), and Farming, Fishing & Forestry (190 | 1.3%).
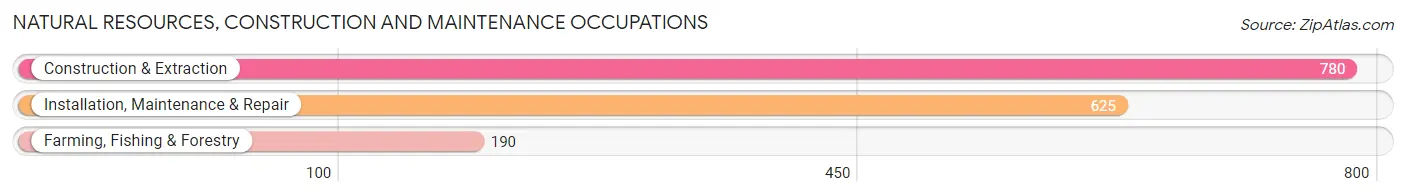
Natural Resources, Construction and Maintenance Occupations by Sex
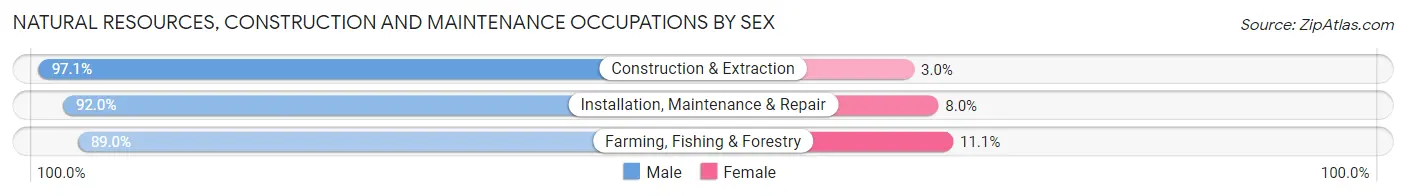
| Occupation | Male | Female |
| Farming, Fishing & Forestry | 169 (88.9%) | 21 (11.1%) |
| Construction & Extraction | 757 (97.1%) | 23 (2.9%) |
| Installation, Maintenance & Repair | 575 (92.0%) | 50 (8.0%) |
| Total (Category) | 1,501 (94.1%) | 94 (5.9%) |
| Total (Overall) | 7,670 (54.5%) | 6,407 (45.5%) |
Production, Transportation and Moving Occupations
The most common Production, Transportation and Moving occupations in Orchards are Production (1,201 | 8.5%), Transportation (877 | 6.2%), and Material Moving (799 | 5.7%).
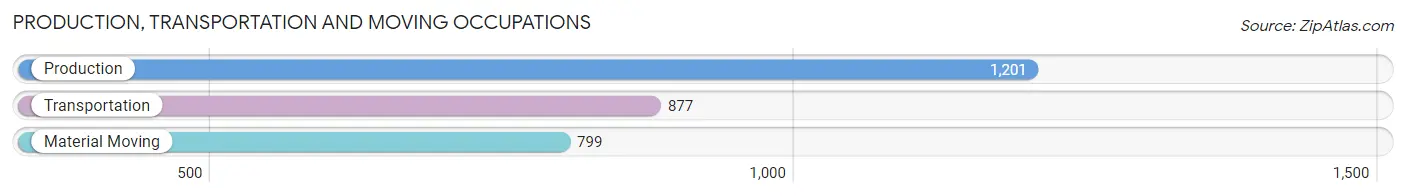
Production, Transportation and Moving Occupations by Sex
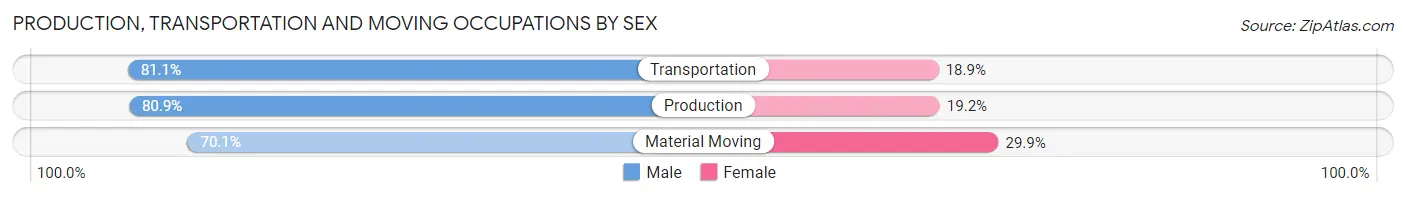
| Occupation | Male | Female |
| Production | 971 (80.8%) | 230 (19.2%) |
| Transportation | 711 (81.1%) | 166 (18.9%) |
| Material Moving | 560 (70.1%) | 239 (29.9%) |
| Total (Category) | 2,242 (77.9%) | 635 (22.1%) |
| Total (Overall) | 7,670 (54.5%) | 6,407 (45.5%) |
Employment Industries by Sex in Orchards
Employment Industries in Orchards
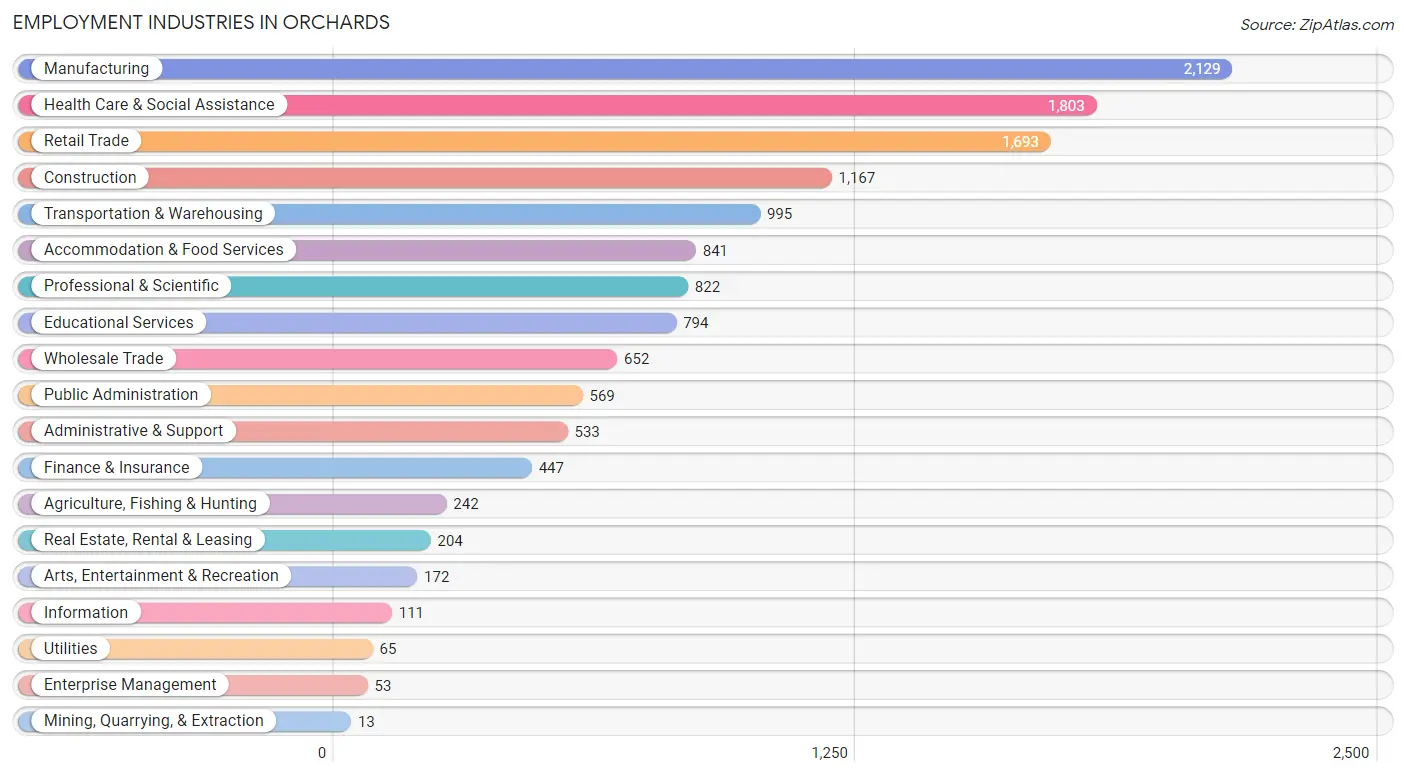
The major employment industries in Orchards include Manufacturing (2,129 | 15.1%), Health Care & Social Assistance (1,803 | 12.8%), Retail Trade (1,693 | 12.0%), Construction (1,167 | 8.3%), and Transportation & Warehousing (995 | 7.1%).
Employment Industries by Sex in Orchards
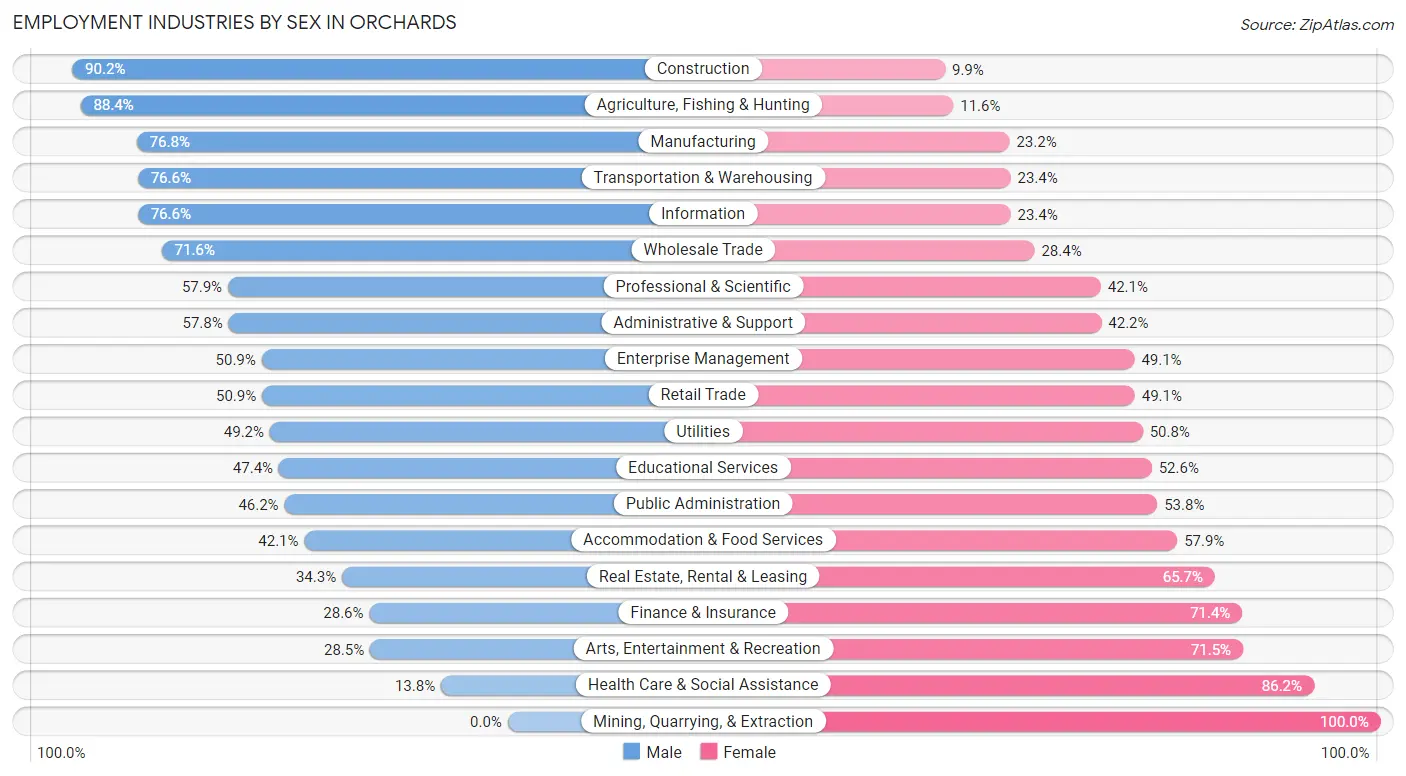
The Orchards industries that see more men than women are Construction (90.1%), Agriculture, Fishing & Hunting (88.4%), and Manufacturing (76.8%), whereas the industries that tend to have a higher number of women are Mining, Quarrying, & Extraction (100.0%), Health Care & Social Assistance (86.2%), and Arts, Entertainment & Recreation (71.5%).
| Industry | Male | Female |
| Agriculture, Fishing & Hunting | 214 (88.4%) | 28 (11.6%) |
| Mining, Quarrying, & Extraction | 0 (0.0%) | 13 (100.0%) |
| Construction | 1,052 (90.1%) | 115 (9.9%) |
| Manufacturing | 1,635 (76.8%) | 494 (23.2%) |
| Wholesale Trade | 467 (71.6%) | 185 (28.4%) |
| Retail Trade | 861 (50.9%) | 832 (49.1%) |
| Transportation & Warehousing | 762 (76.6%) | 233 (23.4%) |
| Utilities | 32 (49.2%) | 33 (50.8%) |
| Information | 85 (76.6%) | 26 (23.4%) |
| Finance & Insurance | 128 (28.6%) | 319 (71.4%) |
| Real Estate, Rental & Leasing | 70 (34.3%) | 134 (65.7%) |
| Professional & Scientific | 476 (57.9%) | 346 (42.1%) |
| Enterprise Management | 27 (50.9%) | 26 (49.1%) |
| Administrative & Support | 308 (57.8%) | 225 (42.2%) |
| Educational Services | 376 (47.4%) | 418 (52.6%) |
| Health Care & Social Assistance | 249 (13.8%) | 1,554 (86.2%) |
| Arts, Entertainment & Recreation | 49 (28.5%) | 123 (71.5%) |
| Accommodation & Food Services | 354 (42.1%) | 487 (57.9%) |
| Public Administration | 263 (46.2%) | 306 (53.8%) |
| Total | 7,670 (54.5%) | 6,407 (45.5%) |
Education in Orchards
School Enrollment in Orchards
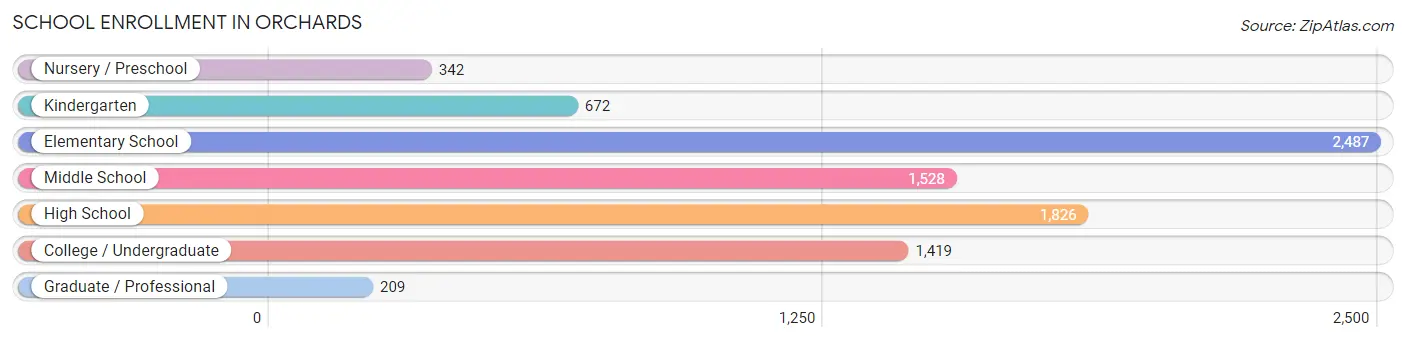
The most common levels of schooling among the 8,483 students in Orchards are elementary school (2,487 | 29.3%), high school (1,826 | 21.5%), and middle school (1,528 | 18.0%).
| School Level | # Students | % Students |
| Nursery / Preschool | 342 | 4.0% |
| Kindergarten | 672 | 7.9% |
| Elementary School | 2,487 | 29.3% |
| Middle School | 1,528 | 18.0% |
| High School | 1,826 | 21.5% |
| College / Undergraduate | 1,419 | 16.7% |
| Graduate / Professional | 209 | 2.5% |
| Total | 8,483 | 100.0% |
School Enrollment by Age by Funding Source in Orchards
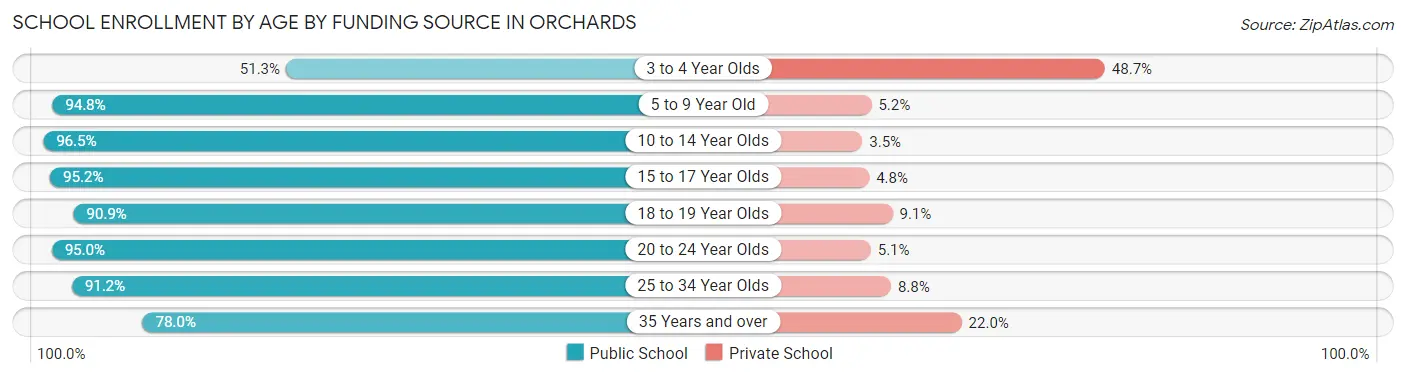
Out of a total of 8,483 students who are enrolled in schools in Orchards, 602 (7.1%) attend a private institution, while the remaining 7,881 (92.9%) are enrolled in public schools. The age group of 3 to 4 year olds has the highest likelihood of being enrolled in private schools, with 91 (48.7% in the age bracket) enrolled. Conversely, the age group of 10 to 14 year olds has the lowest likelihood of being enrolled in a private school, with 2,054 (96.5% in the age bracket) attending a public institution.
| Age Bracket | Public School | Private School |
| 3 to 4 Year Olds | 96 (51.3%) | 91 (48.7%) |
| 5 to 9 Year Old | 2,785 (94.8%) | 152 (5.2%) |
| 10 to 14 Year Olds | 2,054 (96.5%) | 74 (3.5%) |
| 15 to 17 Year Olds | 1,020 (95.2%) | 51 (4.8%) |
| 18 to 19 Year Olds | 679 (90.9%) | 68 (9.1%) |
| 20 to 24 Year Olds | 470 (95.0%) | 25 (5.1%) |
| 25 to 34 Year Olds | 414 (91.2%) | 40 (8.8%) |
| 35 Years and over | 362 (78.0%) | 102 (22.0%) |
| Total | 7,881 (92.9%) | 602 (7.1%) |
Educational Attainment by Field of Study in Orchards
Business (1,064 | 24.2%), education (567 | 12.9%), engineering (507 | 11.5%), liberal arts & history (327 | 7.4%), and arts & humanities (307 | 7.0%) are the most common fields of study among 4,395 individuals in Orchards who have obtained a bachelor's degree or higher.
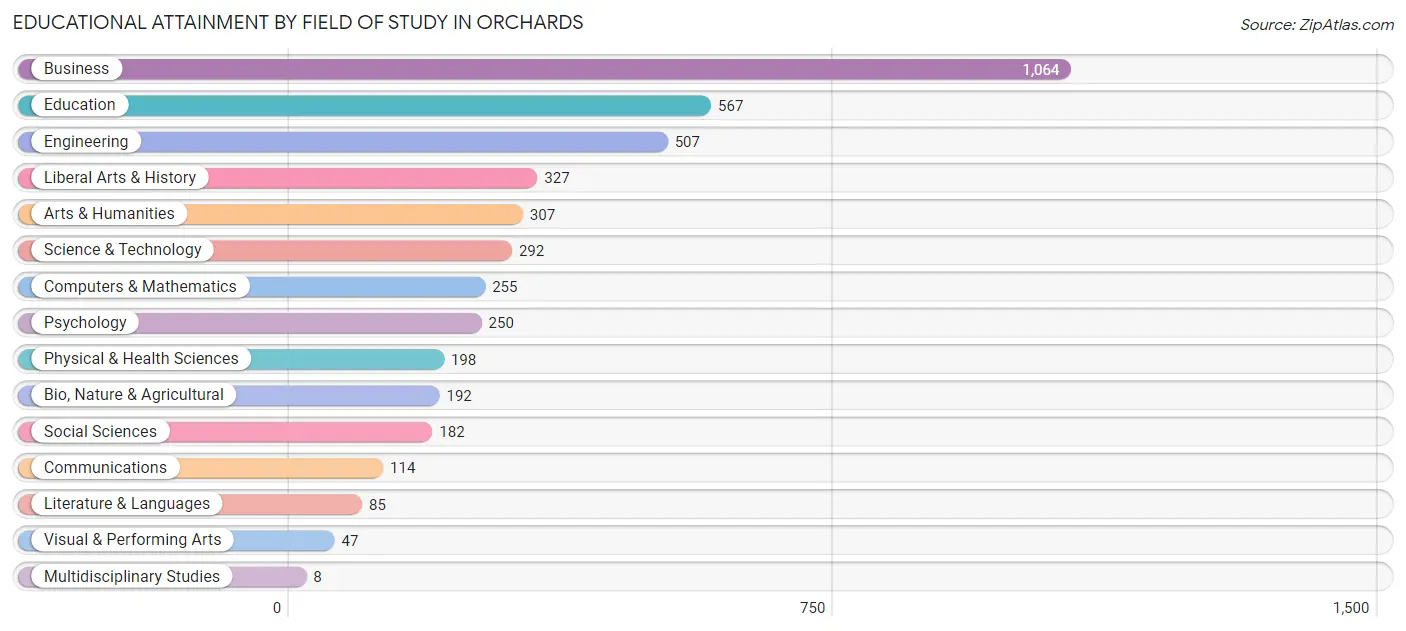
| Field of Study | # Graduates | % Graduates |
| Computers & Mathematics | 255 | 5.8% |
| Bio, Nature & Agricultural | 192 | 4.4% |
| Physical & Health Sciences | 198 | 4.5% |
| Psychology | 250 | 5.7% |
| Social Sciences | 182 | 4.1% |
| Engineering | 507 | 11.5% |
| Multidisciplinary Studies | 8 | 0.2% |
| Science & Technology | 292 | 6.6% |
| Business | 1,064 | 24.2% |
| Education | 567 | 12.9% |
| Literature & Languages | 85 | 1.9% |
| Liberal Arts & History | 327 | 7.4% |
| Visual & Performing Arts | 47 | 1.1% |
| Communications | 114 | 2.6% |
| Arts & Humanities | 307 | 7.0% |
| Total | 4,395 | 100.0% |
Transportation & Commute in Orchards
Vehicle Availability by Sex in Orchards
The most prevalent vehicle ownership categories in Orchards are males with 2 vehicles (3,045, accounting for 40.8%) and females with 2 vehicles (2,607, making up 49.1%).
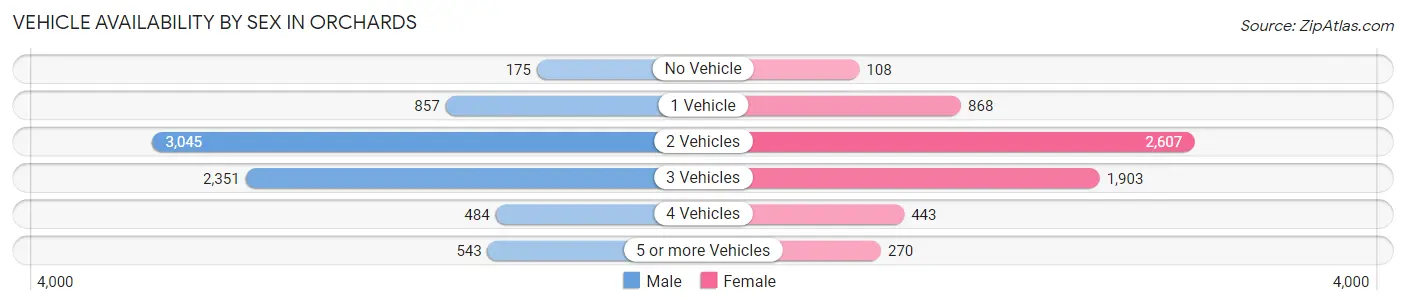
| Vehicles Available | Male | Female |
| No Vehicle | 175 (2.4%) | 108 (1.7%) |
| 1 Vehicle | 857 (11.5%) | 868 (14.0%) |
| 2 Vehicles | 3,045 (40.8%) | 2,607 (42.1%) |
| 3 Vehicles | 2,351 (31.5%) | 1,903 (30.7%) |
| 4 Vehicles | 484 (6.5%) | 443 (7.1%) |
| 5 or more Vehicles | 543 (7.3%) | 270 (4.4%) |
| Total | 7,455 (100.0%) | 6,199 (100.0%) |
Commute Time in Orchards
The most frequently occuring commute durations in Orchards are 20 to 24 minutes (2,691 commuters, 22.0%), 15 to 19 minutes (1,913 commuters, 15.6%), and 30 to 34 minutes (1,576 commuters, 12.9%).
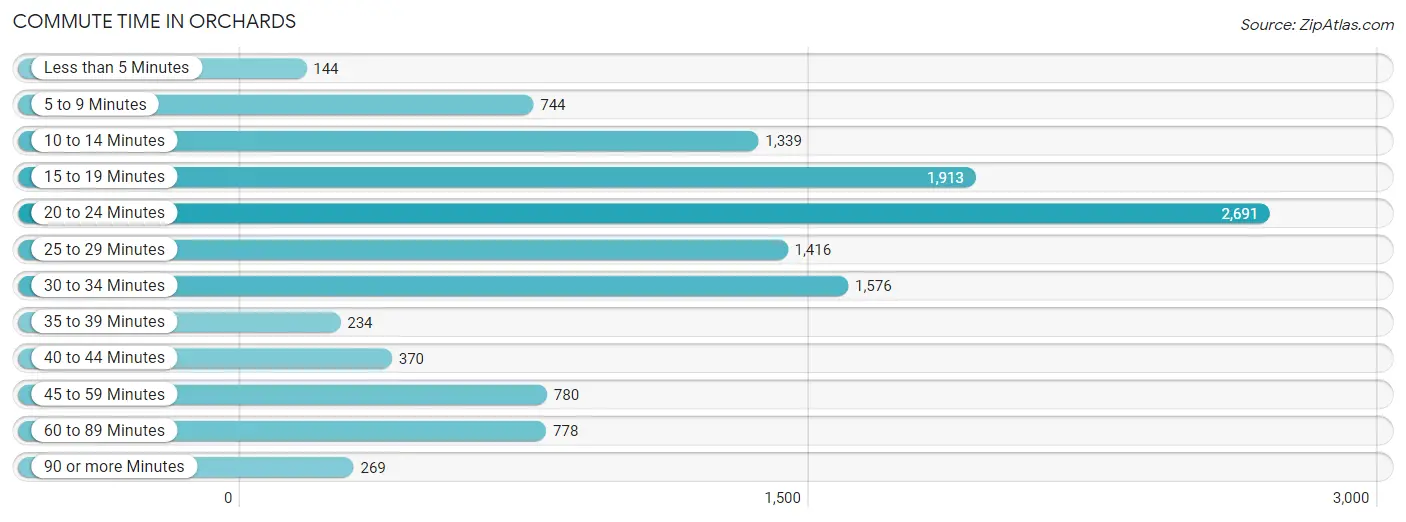
| Commute Time | # Commuters | % Commuters |
| Less than 5 Minutes | 144 | 1.2% |
| 5 to 9 Minutes | 744 | 6.1% |
| 10 to 14 Minutes | 1,339 | 10.9% |
| 15 to 19 Minutes | 1,913 | 15.6% |
| 20 to 24 Minutes | 2,691 | 22.0% |
| 25 to 29 Minutes | 1,416 | 11.6% |
| 30 to 34 Minutes | 1,576 | 12.9% |
| 35 to 39 Minutes | 234 | 1.9% |
| 40 to 44 Minutes | 370 | 3.0% |
| 45 to 59 Minutes | 780 | 6.4% |
| 60 to 89 Minutes | 778 | 6.4% |
| 90 or more Minutes | 269 | 2.2% |
Commute Time by Sex in Orchards
The most common commute times in Orchards are 20 to 24 minutes (1,400 commuters, 20.9%) for males and 20 to 24 minutes (1,291 commuters, 23.2%) for females.
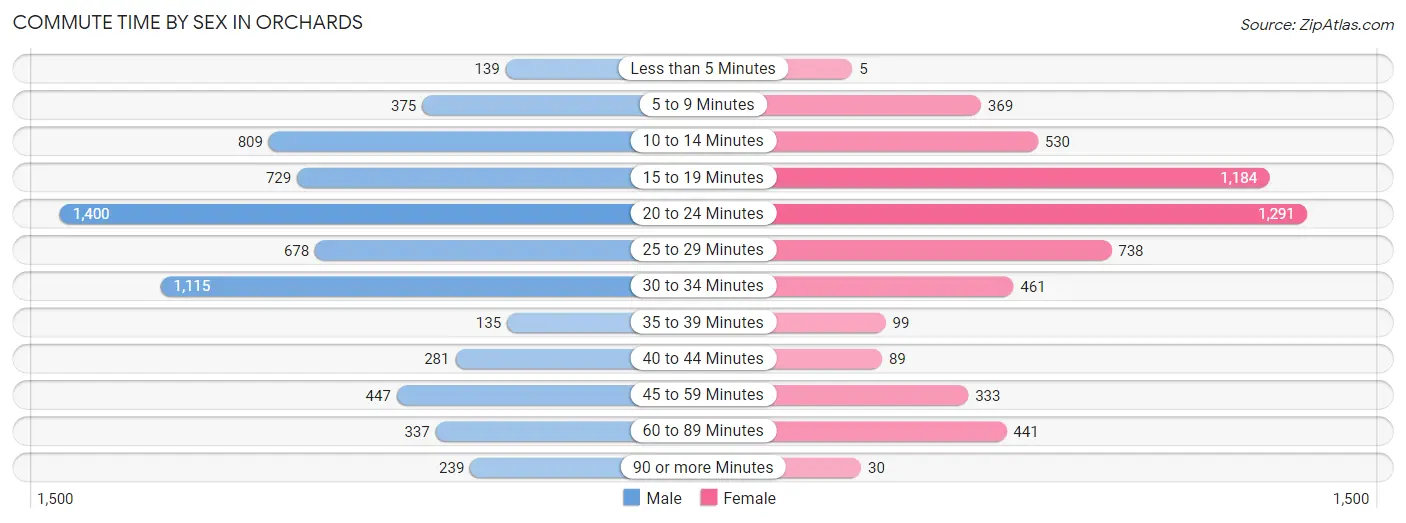
| Commute Time | Male | Female |
| Less than 5 Minutes | 139 (2.1%) | 5 (0.1%) |
| 5 to 9 Minutes | 375 (5.6%) | 369 (6.6%) |
| 10 to 14 Minutes | 809 (12.1%) | 530 (9.5%) |
| 15 to 19 Minutes | 729 (10.9%) | 1,184 (21.3%) |
| 20 to 24 Minutes | 1,400 (20.9%) | 1,291 (23.2%) |
| 25 to 29 Minutes | 678 (10.1%) | 738 (13.3%) |
| 30 to 34 Minutes | 1,115 (16.7%) | 461 (8.3%) |
| 35 to 39 Minutes | 135 (2.0%) | 99 (1.8%) |
| 40 to 44 Minutes | 281 (4.2%) | 89 (1.6%) |
| 45 to 59 Minutes | 447 (6.7%) | 333 (6.0%) |
| 60 to 89 Minutes | 337 (5.0%) | 441 (7.9%) |
| 90 or more Minutes | 239 (3.6%) | 30 (0.5%) |
Time of Departure to Work by Sex in Orchards
The most frequent times of departure to work in Orchards are 6:30 AM to 6:59 AM (898, 13.4%) for males and 7:00 AM to 7:29 AM (1,002, 18.0%) for females.
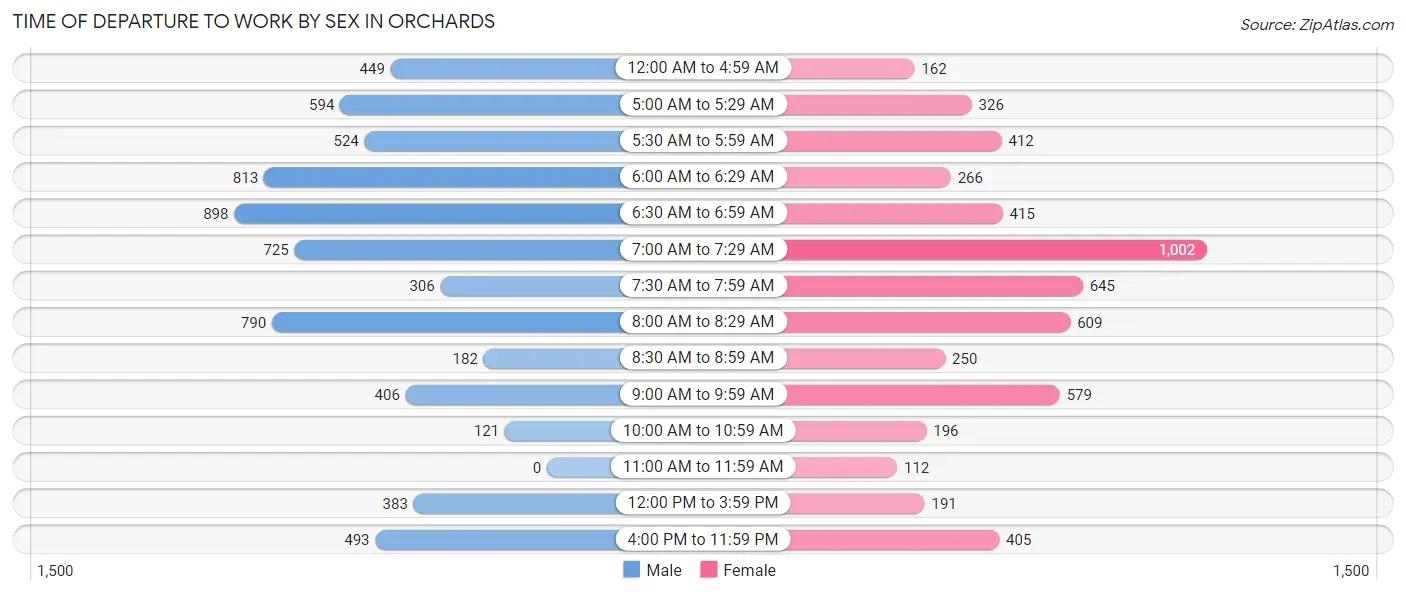
| Time of Departure | Male | Female |
| 12:00 AM to 4:59 AM | 449 (6.7%) | 162 (2.9%) |
| 5:00 AM to 5:29 AM | 594 (8.9%) | 326 (5.9%) |
| 5:30 AM to 5:59 AM | 524 (7.8%) | 412 (7.4%) |
| 6:00 AM to 6:29 AM | 813 (12.2%) | 266 (4.8%) |
| 6:30 AM to 6:59 AM | 898 (13.4%) | 415 (7.4%) |
| 7:00 AM to 7:29 AM | 725 (10.8%) | 1,002 (18.0%) |
| 7:30 AM to 7:59 AM | 306 (4.6%) | 645 (11.6%) |
| 8:00 AM to 8:29 AM | 790 (11.8%) | 609 (10.9%) |
| 8:30 AM to 8:59 AM | 182 (2.7%) | 250 (4.5%) |
| 9:00 AM to 9:59 AM | 406 (6.1%) | 579 (10.4%) |
| 10:00 AM to 10:59 AM | 121 (1.8%) | 196 (3.5%) |
| 11:00 AM to 11:59 AM | 0 (0.0%) | 112 (2.0%) |
| 12:00 PM to 3:59 PM | 383 (5.7%) | 191 (3.4%) |
| 4:00 PM to 11:59 PM | 493 (7.4%) | 405 (7.3%) |
| Total | 6,684 (100.0%) | 5,570 (100.0%) |
Housing Occupancy in Orchards
Occupancy by Ownership in Orchards
Of the total 10,060 dwellings in Orchards, owner-occupied units account for 6,764 (67.2%), while renter-occupied units make up 3,296 (32.8%).
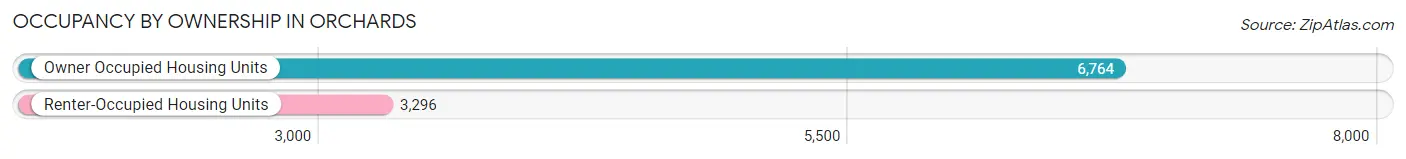
| Occupancy | # Housing Units | % Housing Units |
| Owner Occupied Housing Units | 6,764 | 67.2% |
| Renter-Occupied Housing Units | 3,296 | 32.8% |
| Total Occupied Housing Units | 10,060 | 100.0% |
Occupancy by Household Size in Orchards
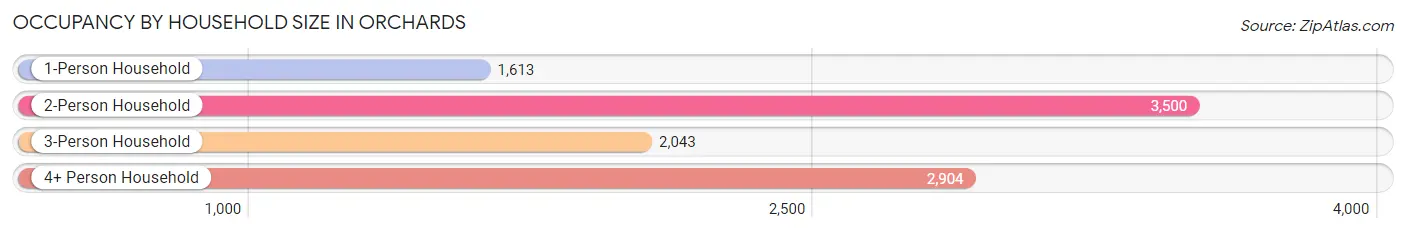
| Household Size | # Housing Units | % Housing Units |
| 1-Person Household | 1,613 | 16.0% |
| 2-Person Household | 3,500 | 34.8% |
| 3-Person Household | 2,043 | 20.3% |
| 4+ Person Household | 2,904 | 28.9% |
| Total Housing Units | 10,060 | 100.0% |
Occupancy by Ownership by Household Size in Orchards
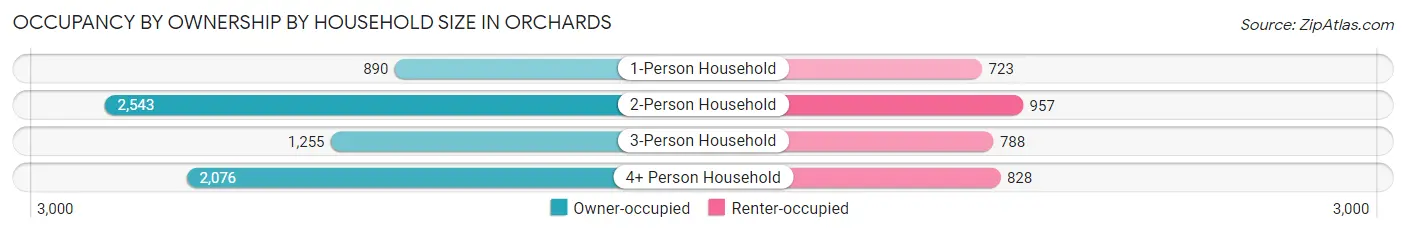
| Household Size | Owner-occupied | Renter-occupied |
| 1-Person Household | 890 (55.2%) | 723 (44.8%) |
| 2-Person Household | 2,543 (72.7%) | 957 (27.3%) |
| 3-Person Household | 1,255 (61.4%) | 788 (38.6%) |
| 4+ Person Household | 2,076 (71.5%) | 828 (28.5%) |
| Total Housing Units | 6,764 (67.2%) | 3,296 (32.8%) |
Occupancy by Educational Attainment in Orchards
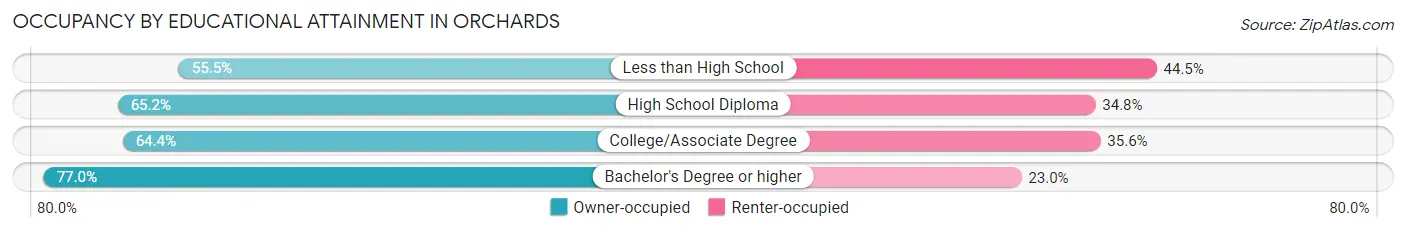
| Household Size | Owner-occupied | Renter-occupied |
| Less than High School | 473 (55.5%) | 379 (44.5%) |
| High School Diploma | 1,589 (65.2%) | 847 (34.8%) |
| College/Associate Degree | 2,621 (64.4%) | 1,447 (35.6%) |
| Bachelor's Degree or higher | 2,081 (77.0%) | 623 (23.0%) |
Occupancy by Age of Householder in Orchards
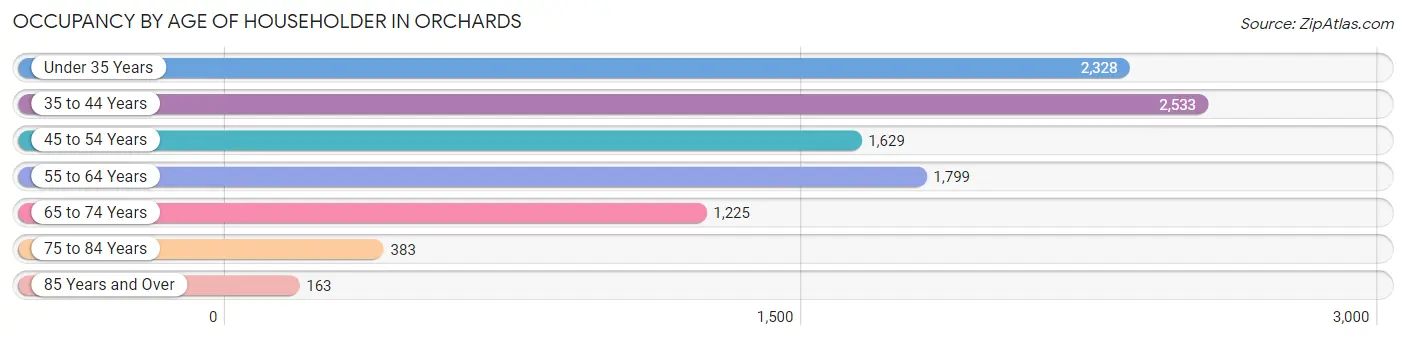
| Age Bracket | # Households | % Households |
| Under 35 Years | 2,328 | 23.1% |
| 35 to 44 Years | 2,533 | 25.2% |
| 45 to 54 Years | 1,629 | 16.2% |
| 55 to 64 Years | 1,799 | 17.9% |
| 65 to 74 Years | 1,225 | 12.2% |
| 75 to 84 Years | 383 | 3.8% |
| 85 Years and Over | 163 | 1.6% |
| Total | 10,060 | 100.0% |
Housing Finances in Orchards
Median Income by Occupancy in Orchards
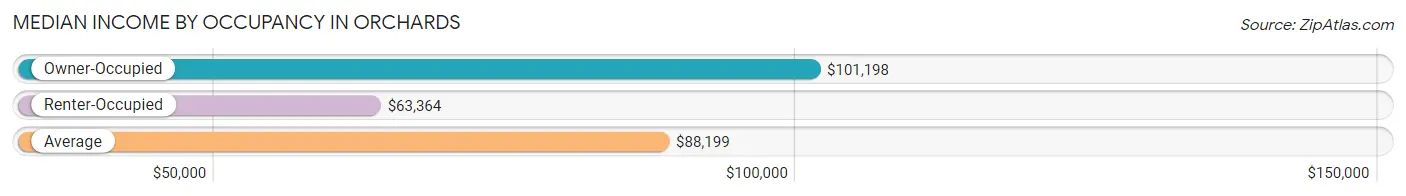
| Occupancy Type | # Households | Median Income |
| Owner-Occupied | 6,764 (67.2%) | $101,198 |
| Renter-Occupied | 3,296 (32.8%) | $63,364 |
| Average | 10,060 (100.0%) | $88,199 |
Occupancy by Householder Income Bracket in Orchards
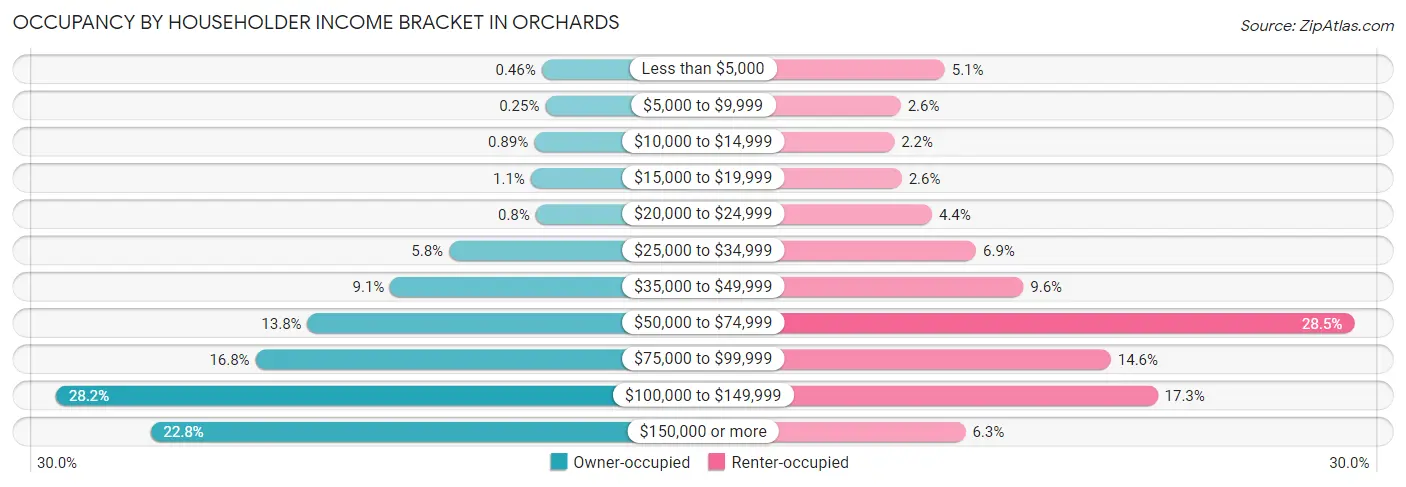
| Income Bracket | Owner-occupied | Renter-occupied |
| Less than $5,000 | 31 (0.5%) | 168 (5.1%) |
| $5,000 to $9,999 | 17 (0.3%) | 85 (2.6%) |
| $10,000 to $14,999 | 60 (0.9%) | 73 (2.2%) |
| $15,000 to $19,999 | 73 (1.1%) | 87 (2.6%) |
| $20,000 to $24,999 | 54 (0.8%) | 144 (4.4%) |
| $25,000 to $34,999 | 389 (5.8%) | 227 (6.9%) |
| $35,000 to $49,999 | 616 (9.1%) | 316 (9.6%) |
| $50,000 to $74,999 | 936 (13.8%) | 939 (28.5%) |
| $75,000 to $99,999 | 1,137 (16.8%) | 481 (14.6%) |
| $100,000 to $149,999 | 1,908 (28.2%) | 569 (17.3%) |
| $150,000 or more | 1,543 (22.8%) | 207 (6.3%) |
| Total | 6,764 (100.0%) | 3,296 (100.0%) |
Monthly Housing Cost Tiers in Orchards
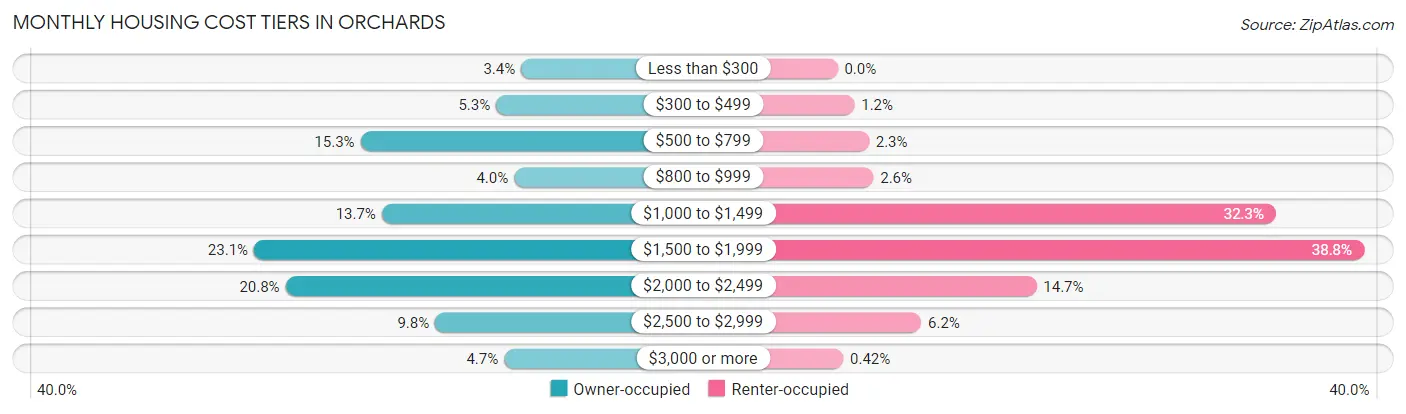
| Monthly Cost | Owner-occupied | Renter-occupied |
| Less than $300 | 233 (3.4%) | 0 (0.0%) |
| $300 to $499 | 357 (5.3%) | 41 (1.2%) |
| $500 to $799 | 1,033 (15.3%) | 76 (2.3%) |
| $800 to $999 | 267 (4.0%) | 87 (2.6%) |
| $1,000 to $1,499 | 927 (13.7%) | 1,064 (32.3%) |
| $1,500 to $1,999 | 1,563 (23.1%) | 1,278 (38.8%) |
| $2,000 to $2,499 | 1,406 (20.8%) | 483 (14.6%) |
| $2,500 to $2,999 | 661 (9.8%) | 203 (6.2%) |
| $3,000 or more | 317 (4.7%) | 14 (0.4%) |
| Total | 6,764 (100.0%) | 3,296 (100.0%) |
Physical Housing Characteristics in Orchards
Housing Structures in Orchards
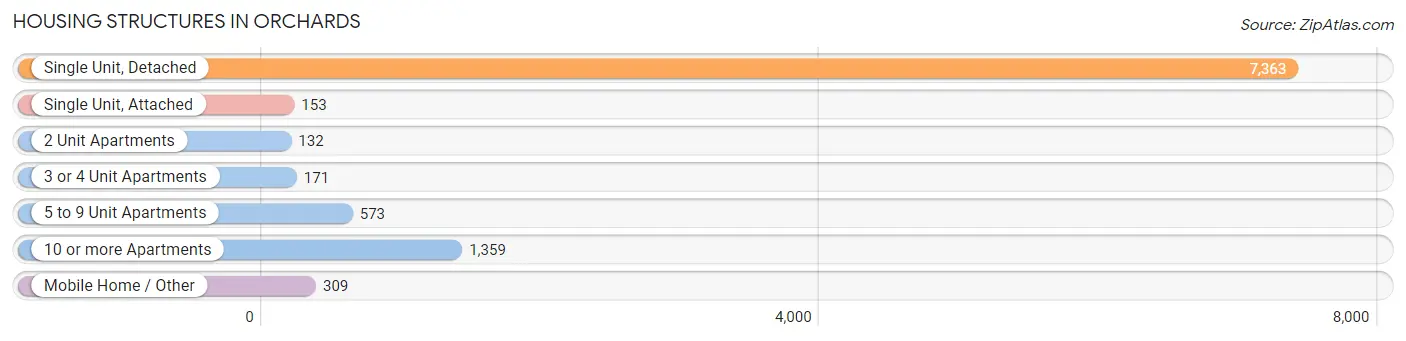
| Structure Type | # Housing Units | % Housing Units |
| Single Unit, Detached | 7,363 | 73.2% |
| Single Unit, Attached | 153 | 1.5% |
| 2 Unit Apartments | 132 | 1.3% |
| 3 or 4 Unit Apartments | 171 | 1.7% |
| 5 to 9 Unit Apartments | 573 | 5.7% |
| 10 or more Apartments | 1,359 | 13.5% |
| Mobile Home / Other | 309 | 3.1% |
| Total | 10,060 | 100.0% |
Housing Structures by Occupancy in Orchards
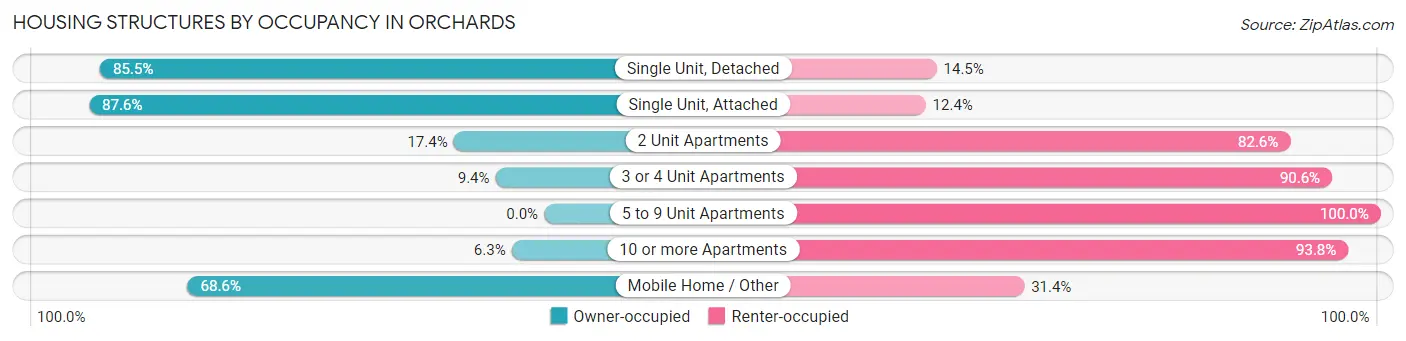
| Structure Type | Owner-occupied | Renter-occupied |
| Single Unit, Detached | 6,294 (85.5%) | 1,069 (14.5%) |
| Single Unit, Attached | 134 (87.6%) | 19 (12.4%) |
| 2 Unit Apartments | 23 (17.4%) | 109 (82.6%) |
| 3 or 4 Unit Apartments | 16 (9.4%) | 155 (90.6%) |
| 5 to 9 Unit Apartments | 0 (0.0%) | 573 (100.0%) |
| 10 or more Apartments | 85 (6.2%) | 1,274 (93.8%) |
| Mobile Home / Other | 212 (68.6%) | 97 (31.4%) |
| Total | 6,764 (67.2%) | 3,296 (32.8%) |
Housing Structures by Number of Rooms in Orchards
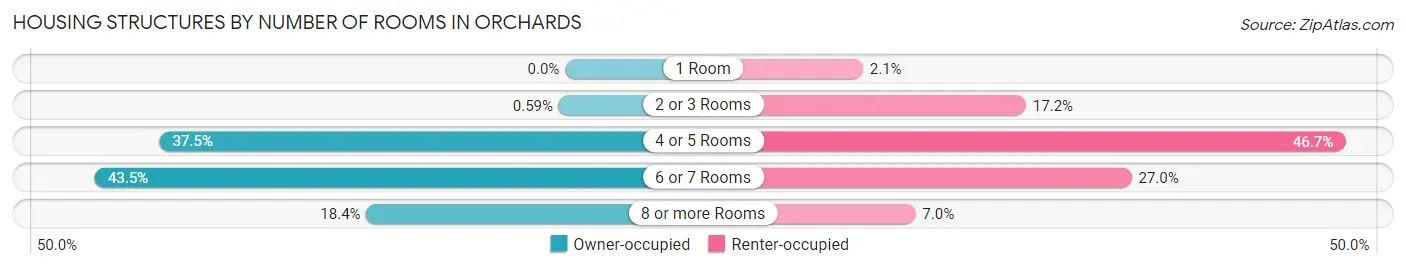
| Number of Rooms | Owner-occupied | Renter-occupied |
| 1 Room | 0 (0.0%) | 70 (2.1%) |
| 2 or 3 Rooms | 40 (0.6%) | 567 (17.2%) |
| 4 or 5 Rooms | 2,538 (37.5%) | 1,540 (46.7%) |
| 6 or 7 Rooms | 2,942 (43.5%) | 889 (27.0%) |
| 8 or more Rooms | 1,244 (18.4%) | 230 (7.0%) |
| Total | 6,764 (100.0%) | 3,296 (100.0%) |
Housing Structure by Heating Type in Orchards
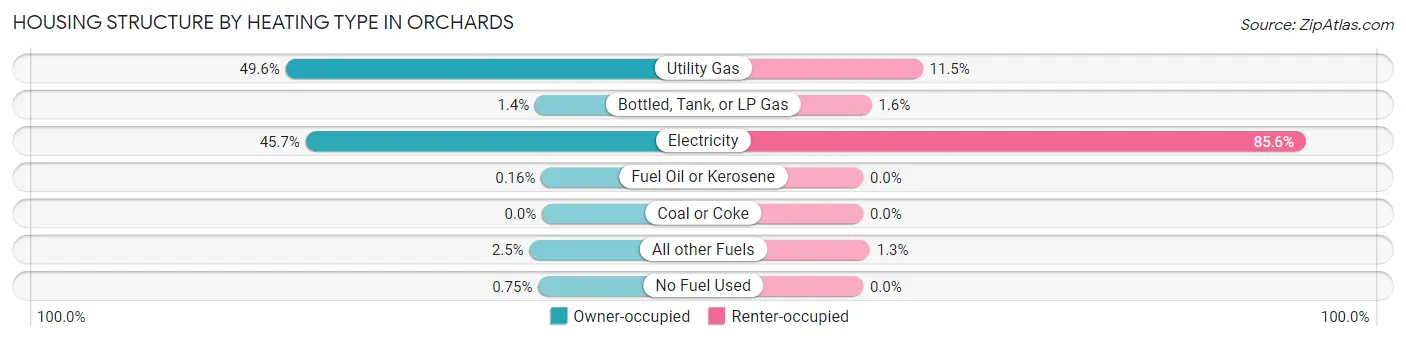
| Heating Type | Owner-occupied | Renter-occupied |
| Utility Gas | 3,353 (49.6%) | 379 (11.5%) |
| Bottled, Tank, or LP Gas | 93 (1.4%) | 54 (1.6%) |
| Electricity | 3,090 (45.7%) | 2,820 (85.6%) |
| Fuel Oil or Kerosene | 11 (0.2%) | 0 (0.0%) |
| Coal or Coke | 0 (0.0%) | 0 (0.0%) |
| All other Fuels | 166 (2.5%) | 43 (1.3%) |
| No Fuel Used | 51 (0.7%) | 0 (0.0%) |
| Total | 6,764 (100.0%) | 3,296 (100.0%) |
Household Vehicle Usage in Orchards
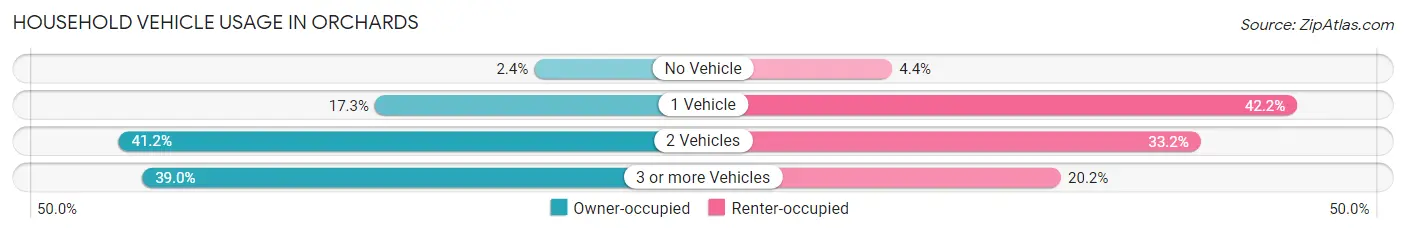
| Vehicles per Household | Owner-occupied | Renter-occupied |
| No Vehicle | 165 (2.4%) | 146 (4.4%) |
| 1 Vehicle | 1,171 (17.3%) | 1,391 (42.2%) |
| 2 Vehicles | 2,789 (41.2%) | 1,094 (33.2%) |
| 3 or more Vehicles | 2,639 (39.0%) | 665 (20.2%) |
| Total | 6,764 (100.0%) | 3,296 (100.0%) |
Real Estate & Mortgages in Orchards
Real Estate and Mortgage Overview in Orchards
| Characteristic | Without Mortgage | With Mortgage |
| Housing Units | 1,748 | 5,016 |
| Median Property Value | $372,300 | $392,100 |
| Median Household Income | $75,391 | $1,329 |
| Monthly Housing Costs | $590 | $296 |
| Real Estate Taxes | $3,234 | $91 |
Property Value by Mortgage Status in Orchards
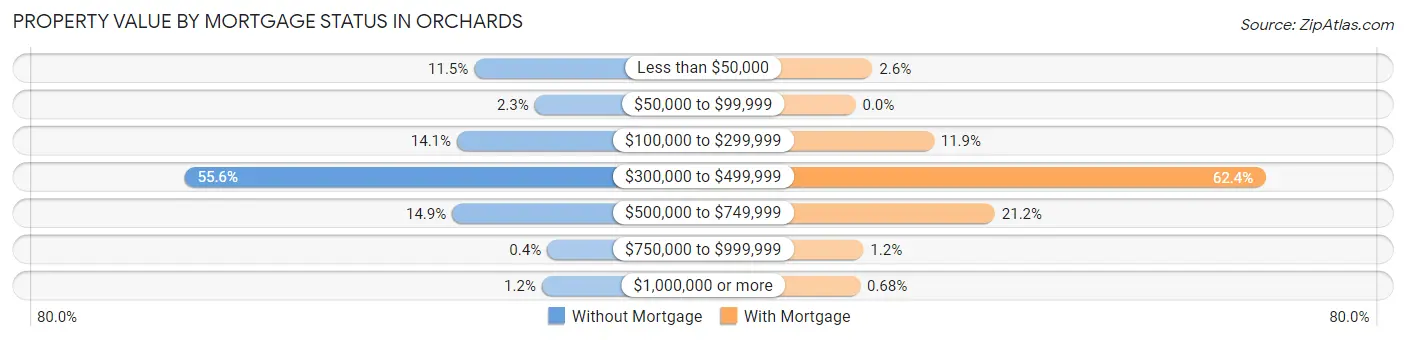
| Property Value | Without Mortgage | With Mortgage |
| Less than $50,000 | 201 (11.5%) | 129 (2.6%) |
| $50,000 to $99,999 | 40 (2.3%) | 0 (0.0%) |
| $100,000 to $299,999 | 247 (14.1%) | 598 (11.9%) |
| $300,000 to $499,999 | 972 (55.6%) | 3,130 (62.4%) |
| $500,000 to $749,999 | 260 (14.9%) | 1,065 (21.2%) |
| $750,000 to $999,999 | 7 (0.4%) | 60 (1.2%) |
| $1,000,000 or more | 21 (1.2%) | 34 (0.7%) |
| Total | 1,748 (100.0%) | 5,016 (100.0%) |
Household Income by Mortgage Status in Orchards
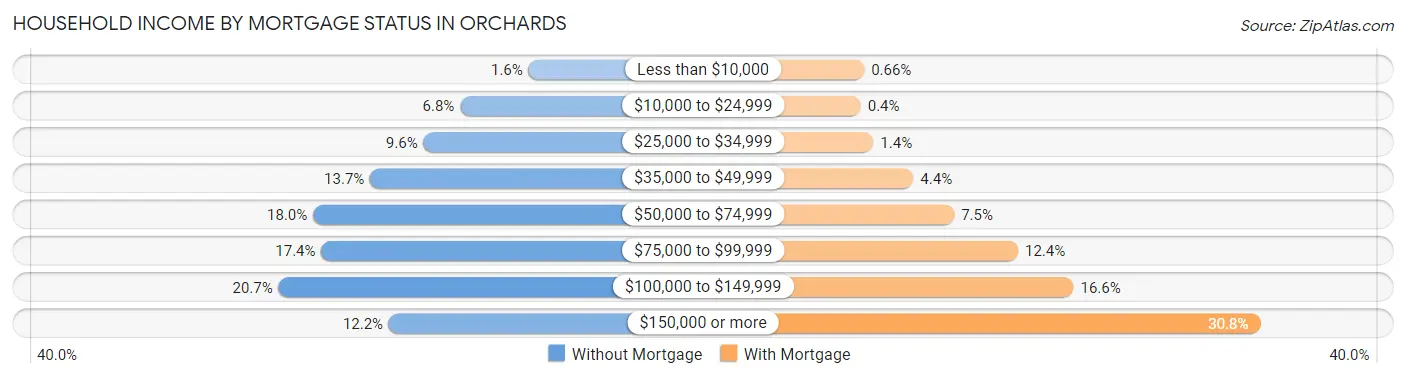
| Household Income | Without Mortgage | With Mortgage |
| Less than $10,000 | 28 (1.6%) | 33 (0.7%) |
| $10,000 to $24,999 | 119 (6.8%) | 20 (0.4%) |
| $25,000 to $34,999 | 168 (9.6%) | 68 (1.4%) |
| $35,000 to $49,999 | 239 (13.7%) | 221 (4.4%) |
| $50,000 to $74,999 | 315 (18.0%) | 377 (7.5%) |
| $75,000 to $99,999 | 304 (17.4%) | 621 (12.4%) |
| $100,000 to $149,999 | 361 (20.6%) | 833 (16.6%) |
| $150,000 or more | 214 (12.2%) | 1,547 (30.8%) |
| Total | 1,748 (100.0%) | 5,016 (100.0%) |
Property Value to Household Income Ratio in Orchards
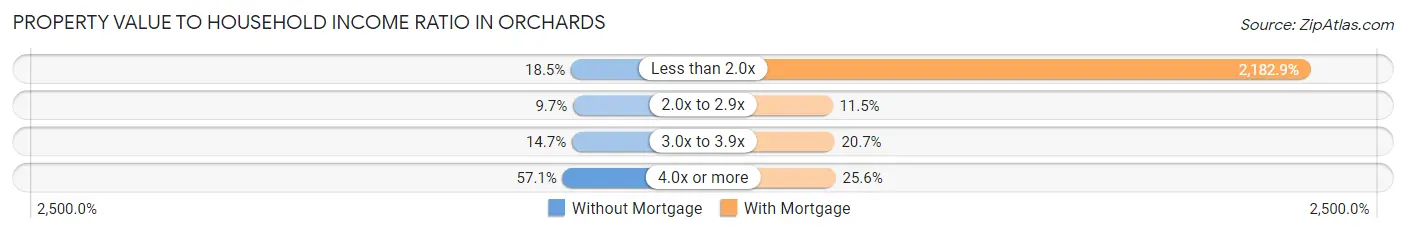
| Value-to-Income Ratio | Without Mortgage | With Mortgage |
| Less than 2.0x | 324 (18.5%) | 109,493 (2,182.9%) |
| 2.0x to 2.9x | 169 (9.7%) | 575 (11.5%) |
| 3.0x to 3.9x | 257 (14.7%) | 1,036 (20.6%) |
| 4.0x or more | 998 (57.1%) | 1,283 (25.6%) |
| Total | 1,748 (100.0%) | 5,016 (100.0%) |
Real Estate Taxes by Mortgage Status in Orchards
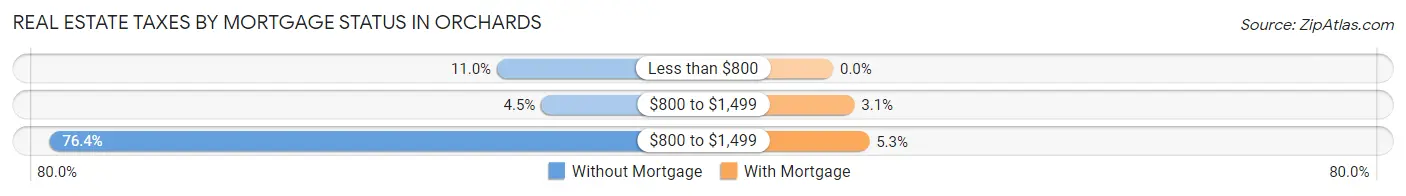
| Property Taxes | Without Mortgage | With Mortgage |
| Less than $800 | 192 (11.0%) | 0 (0.0%) |
| $800 to $1,499 | 79 (4.5%) | 156 (3.1%) |
| $800 to $1,499 | 1,335 (76.4%) | 265 (5.3%) |
| Total | 1,748 (100.0%) | 5,016 (100.0%) |
Health & Disability in Orchards
Health Insurance Coverage by Age in Orchards
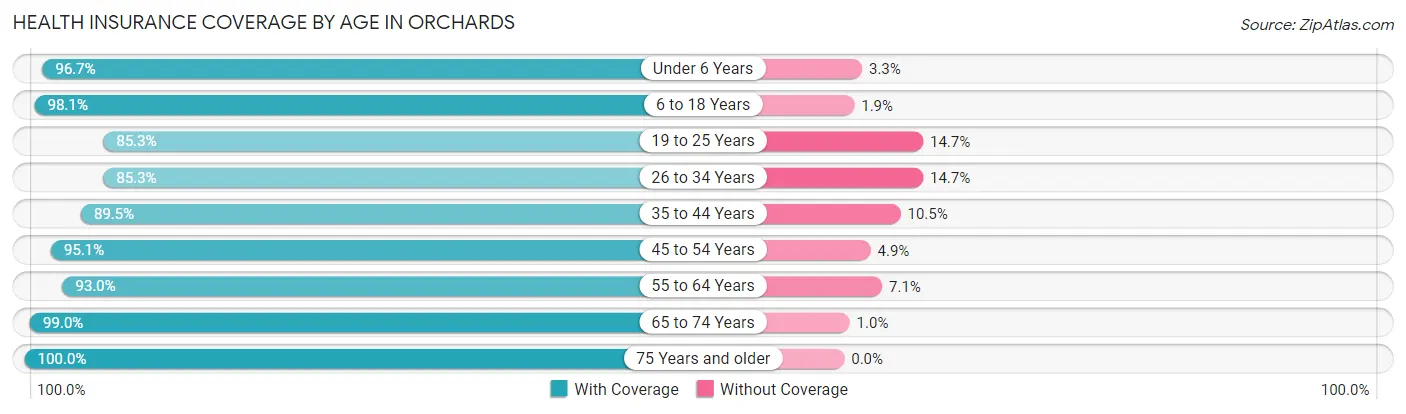
| Age Bracket | With Coverage | Without Coverage |
| Under 6 Years | 2,426 (96.7%) | 83 (3.3%) |
| 6 to 18 Years | 6,077 (98.1%) | 115 (1.9%) |
| 19 to 25 Years | 2,017 (85.3%) | 347 (14.7%) |
| 26 to 34 Years | 3,428 (85.3%) | 590 (14.7%) |
| 35 to 44 Years | 4,239 (89.5%) | 497 (10.5%) |
| 45 to 54 Years | 3,050 (95.1%) | 157 (4.9%) |
| 55 to 64 Years | 2,968 (92.9%) | 225 (7.0%) |
| 65 to 74 Years | 1,972 (99.0%) | 20 (1.0%) |
| 75 Years and older | 994 (100.0%) | 0 (0.0%) |
| Total | 27,171 (93.0%) | 2,034 (7.0%) |
Health Insurance Coverage by Citizenship Status in Orchards
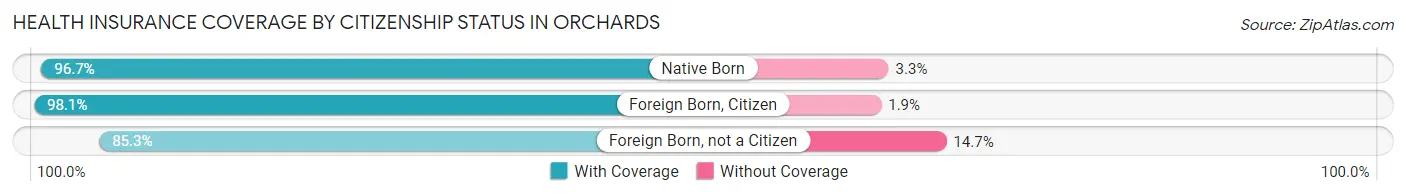
| Citizenship Status | With Coverage | Without Coverage |
| Native Born | 2,426 (96.7%) | 83 (3.3%) |
| Foreign Born, Citizen | 6,077 (98.1%) | 115 (1.9%) |
| Foreign Born, not a Citizen | 2,017 (85.3%) | 347 (14.7%) |
Health Insurance Coverage by Household Income in Orchards
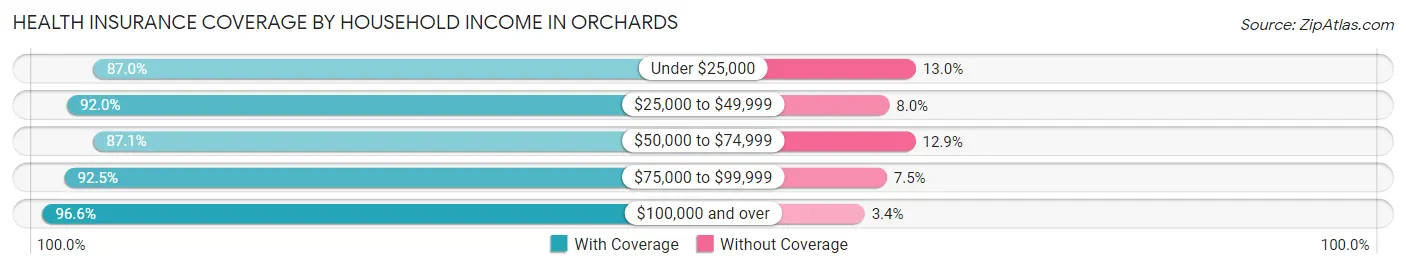
| Household Income | With Coverage | Without Coverage |
| Under $25,000 | 1,128 (87.0%) | 168 (13.0%) |
| $25,000 to $49,999 | 3,890 (92.0%) | 337 (8.0%) |
| $50,000 to $74,999 | 4,805 (87.1%) | 711 (12.9%) |
| $75,000 to $99,999 | 4,602 (92.5%) | 373 (7.5%) |
| $100,000 and over | 12,620 (96.6%) | 439 (3.4%) |
Public vs Private Health Insurance Coverage by Age in Orchards
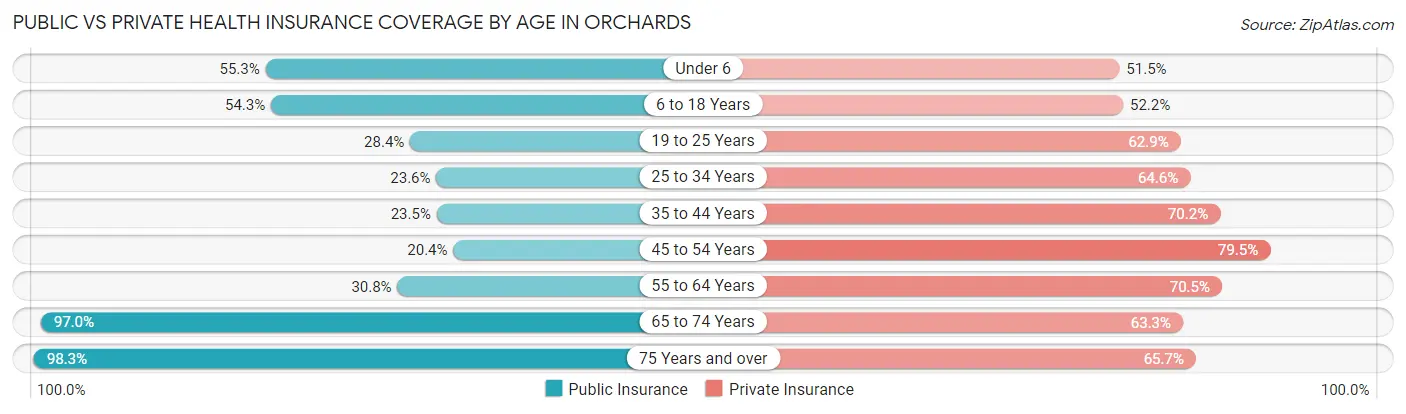
| Age Bracket | Public Insurance | Private Insurance |
| Under 6 | 1,387 (55.3%) | 1,293 (51.5%) |
| 6 to 18 Years | 3,360 (54.3%) | 3,232 (52.2%) |
| 19 to 25 Years | 672 (28.4%) | 1,486 (62.9%) |
| 25 to 34 Years | 947 (23.6%) | 2,597 (64.6%) |
| 35 to 44 Years | 1,113 (23.5%) | 3,324 (70.2%) |
| 45 to 54 Years | 655 (20.4%) | 2,549 (79.5%) |
| 55 to 64 Years | 983 (30.8%) | 2,252 (70.5%) |
| 65 to 74 Years | 1,932 (97.0%) | 1,261 (63.3%) |
| 75 Years and over | 977 (98.3%) | 653 (65.7%) |
| Total | 12,026 (41.2%) | 18,647 (63.8%) |
Disability Status by Sex by Age in Orchards
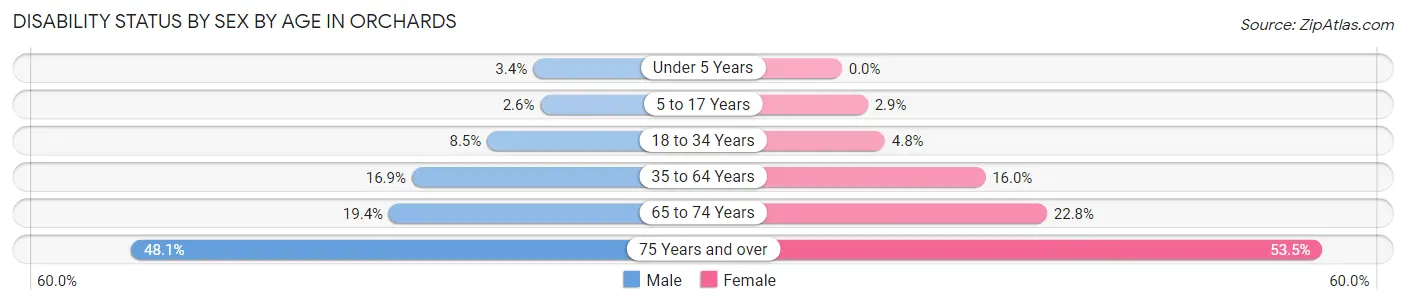
| Age Bracket | Male | Female |
| Under 5 Years | 27 (3.4%) | 0 (0.0%) |
| 5 to 17 Years | 87 (2.6%) | 87 (2.9%) |
| 18 to 34 Years | 295 (8.5%) | 169 (4.8%) |
| 35 to 64 Years | 978 (16.9%) | 853 (16.0%) |
| 65 to 74 Years | 205 (19.4%) | 214 (22.8%) |
| 75 Years and over | 232 (48.1%) | 274 (53.5%) |
Disability Class by Sex by Age in Orchards
Disability Class: Hearing Difficulty
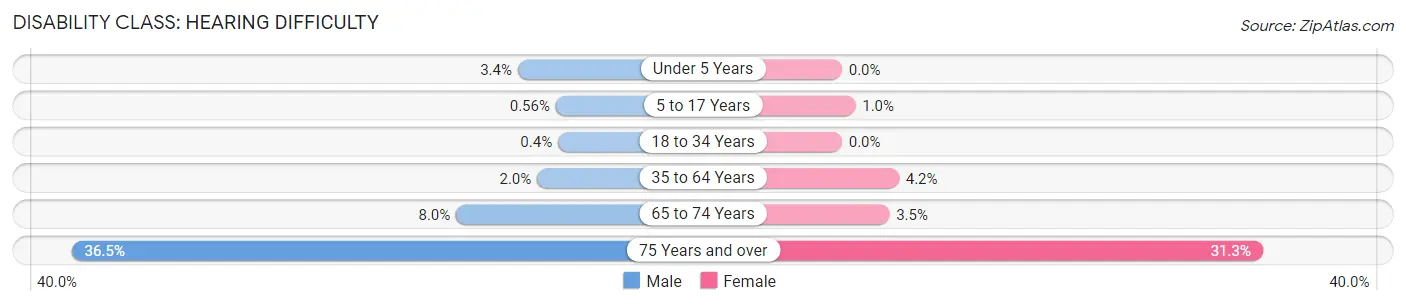
| Age Bracket | Male | Female |
| Under 5 Years | 27 (3.4%) | 0 (0.0%) |
| 5 to 17 Years | 19 (0.6%) | 30 (1.0%) |
| 18 to 34 Years | 14 (0.4%) | 0 (0.0%) |
| 35 to 64 Years | 113 (1.9%) | 226 (4.2%) |
| 65 to 74 Years | 84 (8.0%) | 33 (3.5%) |
| 75 Years and over | 176 (36.5%) | 160 (31.2%) |
Disability Class: Vision Difficulty
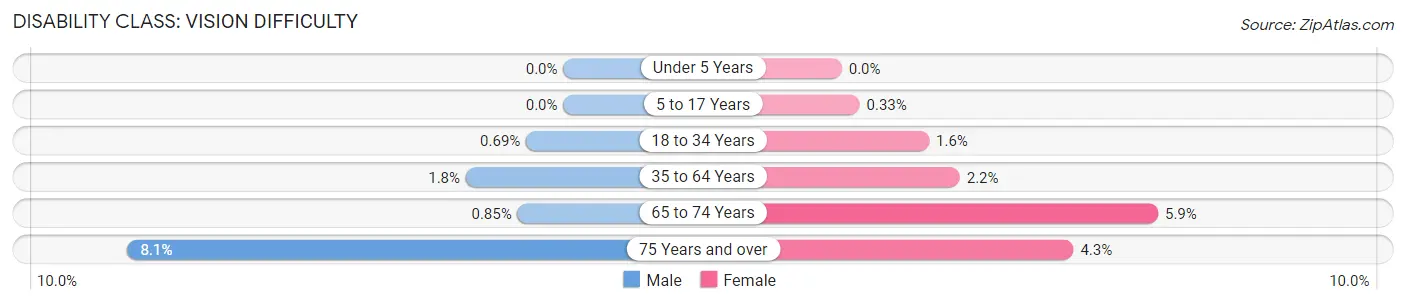
| Age Bracket | Male | Female |
| Under 5 Years | 0 (0.0%) | 0 (0.0%) |
| 5 to 17 Years | 0 (0.0%) | 10 (0.3%) |
| 18 to 34 Years | 24 (0.7%) | 57 (1.6%) |
| 35 to 64 Years | 105 (1.8%) | 117 (2.2%) |
| 65 to 74 Years | 9 (0.9%) | 55 (5.9%) |
| 75 Years and over | 39 (8.1%) | 22 (4.3%) |
Disability Class: Cognitive Difficulty
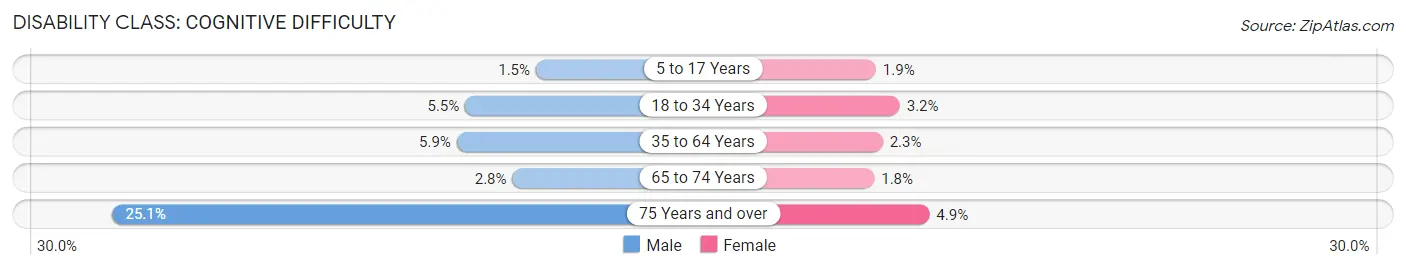
| Age Bracket | Male | Female |
| 5 to 17 Years | 52 (1.5%) | 57 (1.9%) |
| 18 to 34 Years | 190 (5.5%) | 114 (3.2%) |
| 35 to 64 Years | 344 (5.9%) | 122 (2.3%) |
| 65 to 74 Years | 30 (2.8%) | 17 (1.8%) |
| 75 Years and over | 121 (25.1%) | 25 (4.9%) |
Disability Class: Ambulatory Difficulty
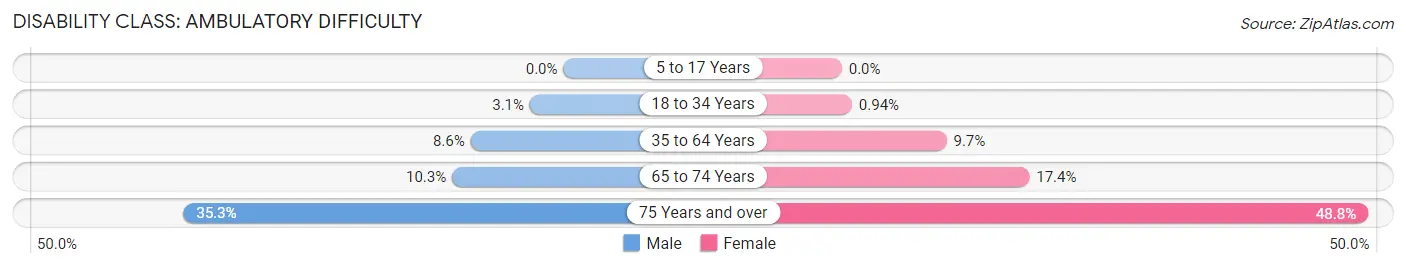
| Age Bracket | Male | Female |
| 5 to 17 Years | 0 (0.0%) | 0 (0.0%) |
| 18 to 34 Years | 108 (3.1%) | 33 (0.9%) |
| 35 to 64 Years | 499 (8.6%) | 519 (9.7%) |
| 65 to 74 Years | 109 (10.3%) | 163 (17.4%) |
| 75 Years and over | 170 (35.3%) | 250 (48.8%) |
Disability Class: Self-Care Difficulty
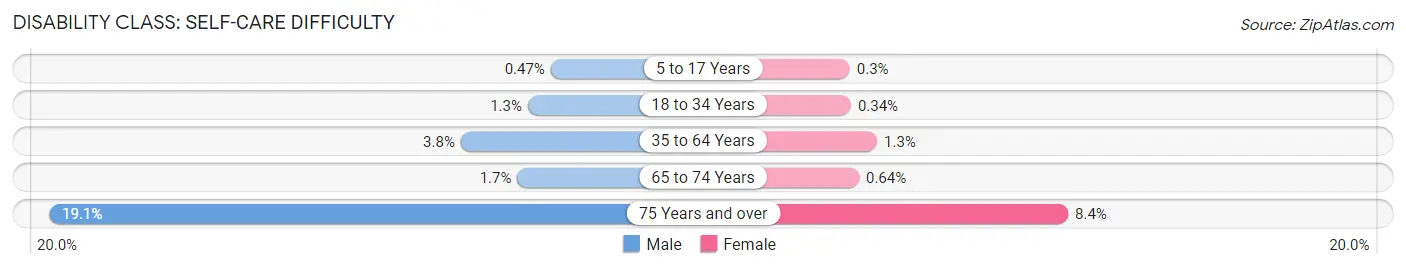
| Age Bracket | Male | Female |
| 5 to 17 Years | 16 (0.5%) | 9 (0.3%) |
| 18 to 34 Years | 46 (1.3%) | 12 (0.3%) |
| 35 to 64 Years | 221 (3.8%) | 70 (1.3%) |
| 65 to 74 Years | 18 (1.7%) | 6 (0.6%) |
| 75 Years and over | 92 (19.1%) | 43 (8.4%) |
Technology Access in Orchards
Computing Device Access in Orchards
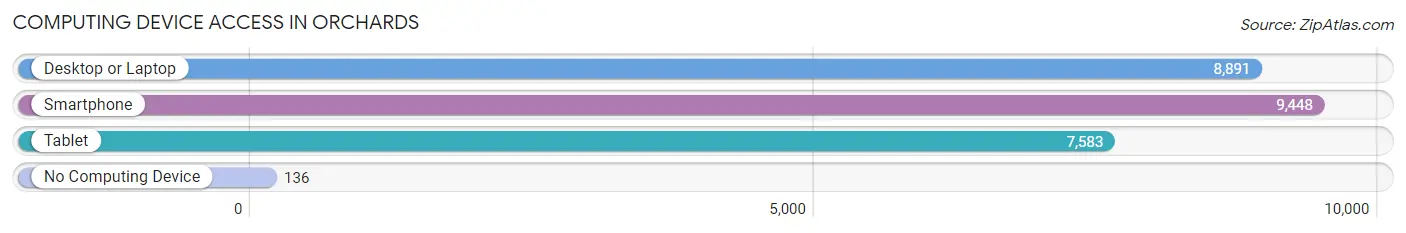
| Device Type | # Households | % Households |
| Desktop or Laptop | 8,891 | 88.4% |
| Smartphone | 9,448 | 93.9% |
| Tablet | 7,583 | 75.4% |
| No Computing Device | 136 | 1.3% |
| Total | 10,060 | 100.0% |
Internet Access in Orchards
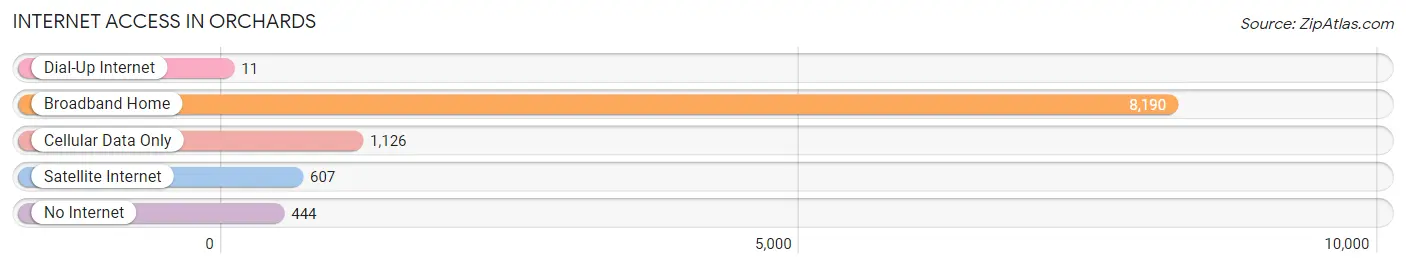
| Internet Type | # Households | % Households |
| Dial-Up Internet | 11 | 0.1% |
| Broadband Home | 8,190 | 81.4% |
| Cellular Data Only | 1,126 | 11.2% |
| Satellite Internet | 607 | 6.0% |
| No Internet | 444 | 4.4% |
| Total | 10,060 | 100.0% |
Orchards Summary
Orchards, Washington is a small unincorporated community located in Clark County, Washington. It is situated in the foothills of the Cascade Mountains, approximately 10 miles east of Vancouver. The population of Orchards was estimated to be 8,845 in 2019.
History
The area that is now Orchards was first settled in the late 1800s by homesteaders. The first post office was established in 1891 and the community was named after the many orchards that were planted in the area. The area was primarily agricultural, with many farms and orchards.
In the early 1900s, the area began to grow as more people moved to the area. The first school was built in 1910 and the first church was built in 1912. The area continued to grow and by the 1950s, the population had grown to over 1,000 people.
In the 1960s, the area began to experience rapid growth as more people moved to the area. The population grew to over 5,000 by the 1970s. The area continued to grow and by the 1990s, the population had grown to over 8,000 people.
Geography
Orchards is located in the foothills of the Cascade Mountains, approximately 10 miles east of Vancouver. The area is mostly rural, with many farms and orchards. The area is also home to several parks, including Orchards Park, which is a popular destination for outdoor recreation.
The climate in Orchards is mild and temperate, with warm summers and cool winters. The average annual temperature is around 50 degrees Fahrenheit. The area receives an average of 37 inches of precipitation per year.
Economy
The economy of Orchards is primarily based on agriculture and tourism. The area is home to many farms and orchards, which produce a variety of fruits and vegetables. The area is also home to several wineries, which produce a variety of wines.
Tourism is also an important part of the economy. The area is home to several parks, which attract visitors from all over the region. The area is also home to several golf courses, which attract golfers from all over the region.
Demographics
As of 2019, the population of Orchards was estimated to be 8,845. The population is primarily white (90.2%), with smaller percentages of Hispanic (3.7%), Asian (2.3%), and African American (1.3%) residents. The median household income is $63,945 and the median home value is $323,400.
Conclusion
Orchards, Washington is a small unincorporated community located in Clark County, Washington. It is situated in the foothills of the Cascade Mountains, approximately 10 miles east of Vancouver. The population of Orchards was estimated to be 8,845 in 2019. The economy of Orchards is primarily based on agriculture and tourism. The area is home to many farms and orchards, which produce a variety of fruits and vegetables. The area is also home to several wineries, which produce a variety of wines. Tourism is also an important part of the economy. The area is home to several parks, which attract visitors from all over the region. The population of Orchards is primarily white (90.2%), with smaller percentages of Hispanic (3.7%), Asian (2.3%), and African American (1.3%) residents. The median household income is $63,945 and the median home value is $323,400.
Common Questions
What is Per Capita Income in Orchards?
Per Capita income in Orchards is $38,389.
What is the Median Family Income in Orchards?
Median Family Income in Orchards is $92,263.
What is the Median Household income in Orchards?
Median Household Income in Orchards is $88,199.
What is Income or Wage Gap in Orchards?
Income or Wage Gap in Orchards is 33.3%.
Women in Orchards earn 66.7 cents for every dollar earned by a man.
What is Family Income Deficit in Orchards?
Family Income Deficit in Orchards is $7,774.
Families that are below poverty line in Orchards earn $7,774 less on average than the poverty threshold level.
What is Inequality or Gini Index in Orchards?
Inequality or Gini Index in Orchards is 0.41.
What is the Total Population of Orchards?
Total Population of Orchards is 29,214.
What is the Total Male Population of Orchards?
Total Male Population of Orchards is 15,005.
What is the Total Female Population of Orchards?
Total Female Population of Orchards is 14,209.
What is the Ratio of Males per 100 Females in Orchards?
There are 105.60 Males per 100 Females in Orchards.
What is the Ratio of Females per 100 Males in Orchards?
There are 94.70 Females per 100 Males in Orchards.
What is the Median Population Age in Orchards?
Median Population Age in Orchards is 33.8 Years.
What is the Average Family Size in Orchards
Average Family Size in Orchards is 3.2 People.
What is the Average Household Size in Orchards
Average Household Size in Orchards is 2.9 People.
How Large is the Labor Force in Orchards?
There are 15,086 People in the Labor Forcein in Orchards.
What is the Percentage of People in the Labor Force in Orchards?
69.2% of People are in the Labor Force in Orchards.
What is the Unemployment Rate in Orchards?
Unemployment Rate in Orchards is 6.7%.