Zip Codes with the Highest Poverty Level Among Children Under the Age of 5 in Spokane, WA
RELATED REPORTS & OPTIONS
Highest Poverty | Child 0-5
Spokane
Compare Zip Codes
Map of Zip Codes with the Highest Poverty Level Among Children Under the Age of 5 in Spokane
4.8%
37.7%
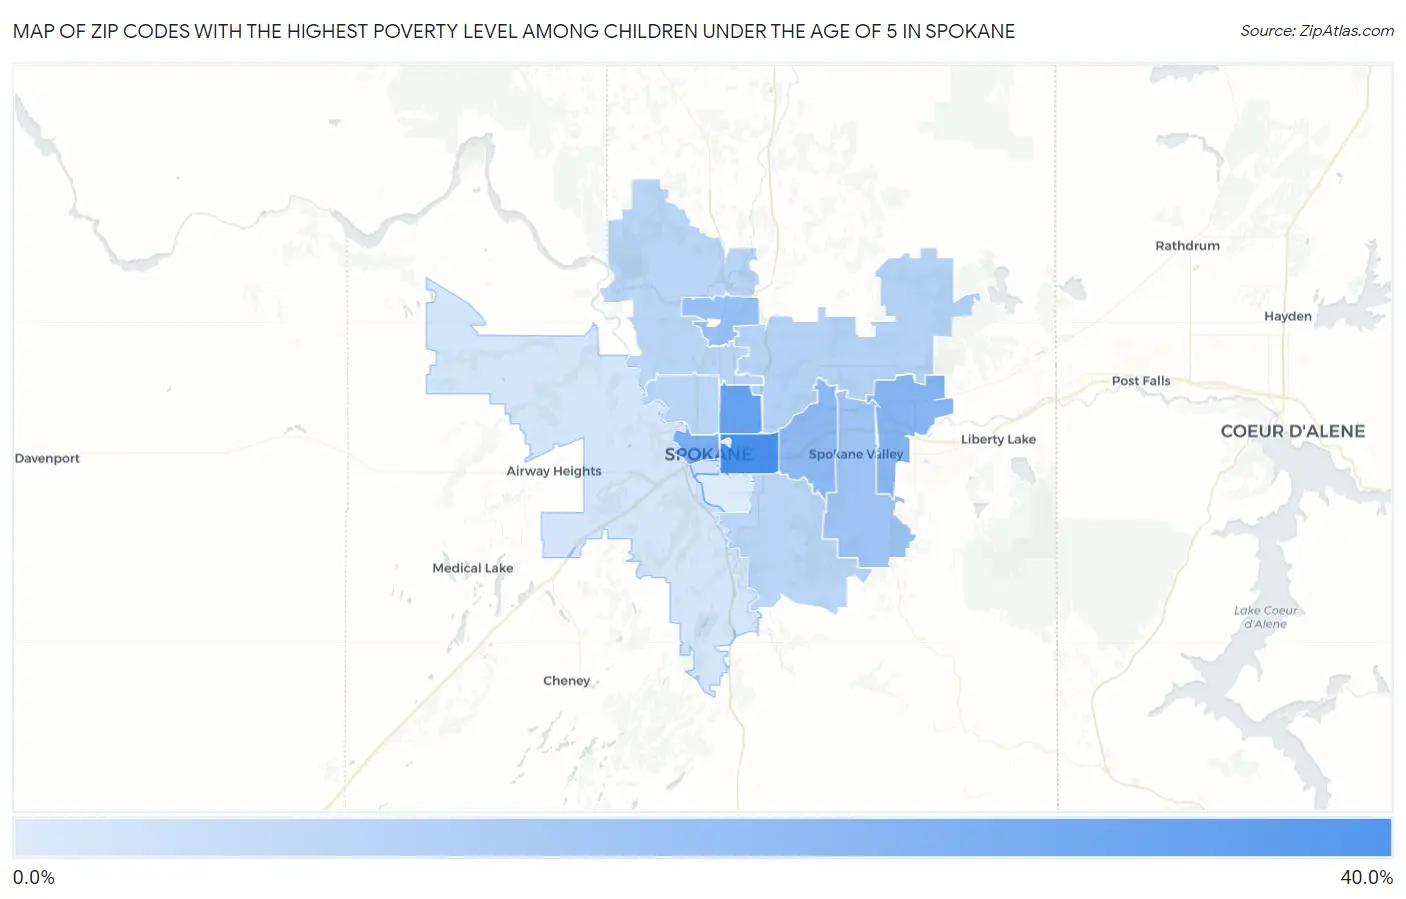
Zip Codes with the Highest Poverty Level Among Children Under the Age of 5 in Spokane, WA
| Zip Code | Child Poverty | vs State | vs National | |
| 1. | 99202 | 37.7% | 12.6%(+25.1)#51 | 18.1%(+19.7)#4,456 |
| 2. | 99207 | 30.6% | 12.6%(+17.9)#73 | 18.1%(+12.5)#6,204 |
| 3. | 99201 | 25.3% | 12.6%(+12.7)#98 | 18.1%(+7.24)#7,879 |
| 4. | 99216 | 23.1% | 12.6%(+10.5)#114 | 18.1%(+5.06)#8,723 |
| 5. | 99212 | 21.6% | 12.6%(+8.94)#128 | 18.1%(+3.49)#9,361 |
| 6. | 99218 | 18.7% | 12.6%(+6.08)#151 | 18.1%(+0.640)#10,639 |
| 7. | 99206 | 17.5% | 12.6%(+4.89)#159 | 18.1%(-0.559)#11,195 |
| 8. | 99217 | 12.7% | 12.6%(+0.036)#215 | 18.1%(-5.41)#13,820 |
| 9. | 99223 | 11.7% | 12.6%(-0.942)#232 | 18.1%(-6.39)#14,420 |
| 10. | 99205 | 11.5% | 12.6%(-1.08)#234 | 18.1%(-6.53)#14,510 |
| 11. | 99208 | 11.5% | 12.6%(-1.16)#236 | 18.1%(-6.60)#14,547 |
| 12. | 99204 | 7.3% | 12.6%(-5.30)#302 | 18.1%(-10.7)#17,184 |
| 13. | 99224 | 6.5% | 12.6%(-6.15)#313 | 18.1%(-11.6)#17,755 |
| 14. | 99203 | 4.8% | 12.6%(-7.84)#333 | 18.1%(-13.3)#18,922 |
1
Common Questions
What are the Top 10 Zip Codes with the Highest Poverty Level Among Children Under the Age of 5 in Spokane, WA?
Top 10 Zip Codes with the Highest Poverty Level Among Children Under the Age of 5 in Spokane, WA are:
What zip code has the Highest Poverty Level Among Children Under the Age of 5 in Spokane, WA?
99202 has the Highest Poverty Level Among Children Under the Age of 5 in Spokane, WA with 37.7%.
What is the Poverty Level Among Children Under the Age of 5 in Spokane, WA?
Poverty Level Among Children Under the Age of 5 in Spokane is 16.4%.
What is the Poverty Level Among Children Under the Age of 5 in Washington?
Poverty Level Among Children Under the Age of 5 in Washington is 12.6%.
What is the Poverty Level Among Children Under the Age of 5 in the United States?
Poverty Level Among Children Under the Age of 5 in the United States is 18.1%.