Zip Codes with the Highest Poverty Level Among Children Under the Age of 5 in Tacoma, WA

RELATED REPORTS & OPTIONS

Highest Poverty | Child 0-5
Population
Families and Households
Female Fertility
Female Fertility (Unmarried)
Race (Community Size)
Race (Percentage)
Ancestry (Community Size)
AfricanAlaska NativeAlaskan AthabascanAlbanianAleutAmericanApacheArabArgentineanArmenianAustralianAustrianBangladeshiBasqueBelgianBelizeanBhutaneseBlackfeetBolivianBrazilianBritishBulgarianBurmeseCanadianCelticCentral AmericanCentral American IndianCherokeeChickasawChileanChippewaChoctawColombianColvilleComancheCosta RicanCreeCreekCroatianCubanCzechCzechoslovakianDanishDelawareDominicanDutchEastern EuropeanEcuadorianEgyptianEnglishEstonianEthiopianEuropeanFijianFilipinoFinnishFrenchFrench American IndianFrench CanadianGermanGerman RussianGhanaianGreekGuamanian / ChamorroGuatemalanHaitianHonduranHopiHungarianIcelanderIndian (Asian)IndonesianInupiatIranianIrishIroquoisIsraeliItalianJamaicanJapaneseKenyanKoreanLaotianLatvianLebaneseLithuanianMacedonianMalaysianMexicanMexican American IndianMoroccanNative HawaiianNavajoNew ZealanderNicaraguanNigerianNorthern EuropeanNorwegianOsagePakistaniPalestinianPanamanianPennsylvania GermanPeruvianPolishPortuguesePuebloPuerto RicanPuget Sound SalishRomanianRussianSalvadoranSamoanScandinavianScotch-IrishScottishSerbianShoshoneSiouxSlavicSlovakSloveneSomaliSouth AfricanSouth AmericanSpaniardSpanishSri LankanSubsaharan AfricanSwedishSwissSyrianThaiTlingit-HaidaTonganTrinidadian and TobagonianTsimshianTurkishUgandanUkrainianVenezuelanVietnameseWelshWest IndianYakamaYaquiYugoslavianYup'ik
Ancestry (Percentage)
AfricanAlaska NativeAlaskan AthabascanAlbanianAleutAmericanApacheArabArgentineanArmenianAustralianAustrianBangladeshiBasqueBelgianBelizeanBhutaneseBlackfeetBolivianBrazilianBritishBulgarianBurmeseCanadianCelticCentral AmericanCentral American IndianCherokeeChickasawChileanChippewaChoctawColombianColvilleComancheCosta RicanCreeCreekCroatianCubanCzechCzechoslovakianDanishDelawareDominicanDutchEastern EuropeanEcuadorianEgyptianEnglishEstonianEthiopianEuropeanFijianFilipinoFinnishFrenchFrench American IndianFrench CanadianGermanGerman RussianGhanaianGreekGuamanian / ChamorroGuatemalanHaitianHonduranHopiHungarianIcelanderIndian (Asian)IndonesianInupiatIranianIrishIroquoisIsraeliItalianJamaicanJapaneseKenyanKoreanLaotianLatvianLebaneseLithuanianMacedonianMalaysianMexicanMexican American IndianMoroccanNative HawaiianNavajoNew ZealanderNicaraguanNigerianNorthern EuropeanNorwegianOsagePakistaniPalestinianPanamanianPennsylvania GermanPeruvianPolishPortuguesePuebloPuerto RicanPuget Sound SalishRomanianRussianSalvadoranSamoanScandinavianScotch-IrishScottishSerbianShoshoneSiouxSlavicSlovakSloveneSomaliSouth AfricanSouth AmericanSpaniardSpanishSri LankanSubsaharan AfricanSwedishSwissSyrianThaiTlingit-HaidaTonganTrinidadian and TobagonianTsimshianTurkishUgandanUkrainianVenezuelanVietnameseWelshWest IndianYakamaYaquiYugoslavianYup'ik
Immigrant Origin (Total)
AfricaArgentinaAsiaAustraliaBangladeshBelarusBelizeBrazilBulgariaBurma / MyanmarCambodiaCameroonCanadaCaribbeanCentral AmericaChileChinaColombiaCosta RicaCubaCzechoslovakiaDenmarkDominican RepublicEastern AfricaEastern AsiaEastern EuropeEcuadorEgyptEl SalvadorEnglandEthiopiaEuropeFijiFranceGermanyGhanaGreeceGuatemalaHaitiHondurasHong KongIndiaIndonesiaIranIrelandIsraelItalyJamaicaJapanKazakhstanKenyaKoreaLaosLatin AmericaLatviaLiberiaMexicoMicronesiaMiddle AfricaMoldovaNetherlandsNicaraguaNigeriaNorthern AfricaNorthern EuropeNorwayOceaniaPakistanPanamaPeruPhilippinesPolandRomaniaRussiaSaudi ArabiaScotlandSomaliaSouth AfricaSouth AmericaSouth Central AsiaSouth Eastern AsiaSouthern EuropeSpainSwedenSwitzerlandTaiwanThailandTrinidad and TobagoTurkeyUgandaUkraineUzbekistanVenezuelaVietnamWestern AfricaWestern AsiaWestern EuropeYemenZimbabwe
Immigrant Origin (Percentage)
AfricaArgentinaAsiaAustraliaBangladeshBelarusBelizeBrazilBulgariaBurma / MyanmarCambodiaCameroonCanadaCaribbeanCentral AmericaChileChinaColombiaCosta RicaCubaCzechoslovakiaDenmarkDominican RepublicEastern AfricaEastern AsiaEastern EuropeEcuadorEgyptEl SalvadorEnglandEthiopiaEuropeFijiFranceGermanyGhanaGreeceGuatemalaHaitiHondurasHong KongIndiaIndonesiaIranIrelandIsraelItalyJamaicaJapanKazakhstanKenyaKoreaLaosLatin AmericaLatviaLiberiaMexicoMicronesiaMiddle AfricaMoldovaNetherlandsNicaraguaNigeriaNorthern AfricaNorthern EuropeNorwayOceaniaPakistanPanamaPeruPhilippinesPolandRomaniaRussiaSaudi ArabiaScotlandSomaliaSouth AfricaSouth AmericaSouth Central AsiaSouth Eastern AsiaSouthern EuropeSpainSwedenSwitzerlandTaiwanThailandTrinidad and TobagoTurkeyUgandaUkraineUzbekistanVenezuelaVietnamWestern AfricaWestern AsiaWestern EuropeYemenZimbabwe
Income
Income (Families)
Income (Households)
Poverty
Poverty (Families)
Unemployment
Employment Occupations
Employment Industries
Employer Class
Commute Time
Commute Means
School Enrollment
Education by Degree Field
Occupancy
Finances
Physical Characteristics
Tacoma
Compare Zip Codes
Comparison Subject

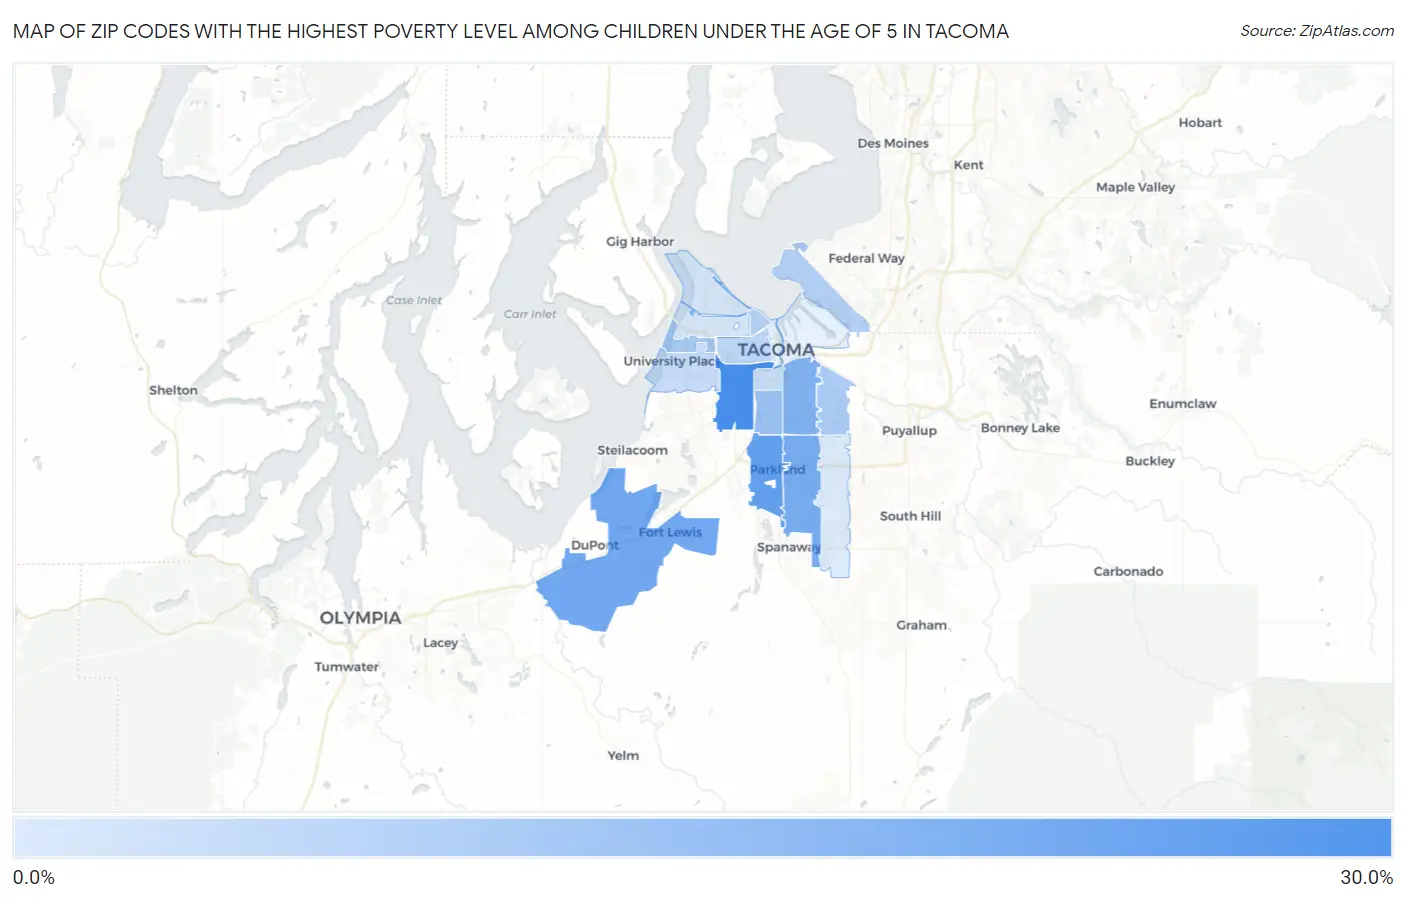
Map of Zip Codes with the Highest Poverty Level Among Children Under the Age of 5 in Tacoma

0.0%
30.0%
Zip Codes with the Highest Poverty Level Among Children Under the Age of 5 in Tacoma Map

Zip Codes with the Highest Poverty Level Among Children Under the Age of 5 in Tacoma, WA

Zip Code Child Poverty vs State vs National
1.9840929.2%12.6%(+16.6)#7818.1%(+11.2)#6,589
2.9844423.6%12.6%(+11.0)#10918.1%(+5.58)#8,513
3.9843320.8%12.6%(+8.14)#13418.1%(+2.70)#9,700
4.9844519.3%12.6%(+6.72)#14718.1%(+1.27)#10,346
5.9840417.4%12.6%(+4.83)#16118.1%(-0.614)#11,214
6.9840812.7%12.6%(+0.034)#21618.1%(-5.41)#13,821
7.9846510.3%12.6%(-2.34)#25118.1%(-7.78)#15,245
8.984439.5%12.6%(-3.11)#25718.1%(-8.55)#15,721
9.984037.9%12.6%(-4.76)#28618.1%(-10.2)#16,845
10.984227.4%12.6%(-5.23)#30018.1%(-10.7)#17,136
11.984055.9%12.6%(-6.68)#31818.1%(-12.1)#18,116
12.984664.5%12.6%(-8.10)#33818.1%(-13.5)#19,100
13.984184.4%12.6%(-8.19)#34018.1%(-13.6)#19,179
14.984072.0%12.6%(-10.7)#38218.1%(-16.1)#20,864
15.984061.8%12.6%(-10.9)#38418.1%(-16.3)#20,987
16.984460.84%12.6%(-11.8)#38918.1%(-17.2)#21,477

Common Questions

What are the Top 10 Zip Codes with the Highest Poverty Level Among Children Under the Age of 5 in Tacoma, WA?
Top 10 Zip Codes with the Highest Poverty Level Among Children Under the Age of 5 in Tacoma, WA are:
#1
29.2%
#2
23.6%
#3
20.8%
#4
19.3%
#5
17.4%
#6
12.7%
#7
10.3%
#8
9.5%
#9
7.9%
#10
7.4%
What zip code has the Highest Poverty Level Among Children Under the Age of 5 in Tacoma, WA?
98409 has the Highest Poverty Level Among Children Under the Age of 5 in Tacoma, WA with 29.2%.
What is the Poverty Level Among Children Under the Age of 5 in Tacoma, WA?
Poverty Level Among Children Under the Age of 5 in Tacoma is 14.2%.
What is the Poverty Level Among Children Under the Age of 5 in Washington?
Poverty Level Among Children Under the Age of 5 in Washington is 12.6%.
What is the Poverty Level Among Children Under the Age of 5 in the United States?
Poverty Level Among Children Under the Age of 5 in the United States is 18.1%.