Zip Codes with the Highest Poverty Level Among Children Under the Age of 5 in Washington
RELATED REPORTS & OPTIONS
Highest Poverty | Child 0-5
Washington
Compare Zip Codes
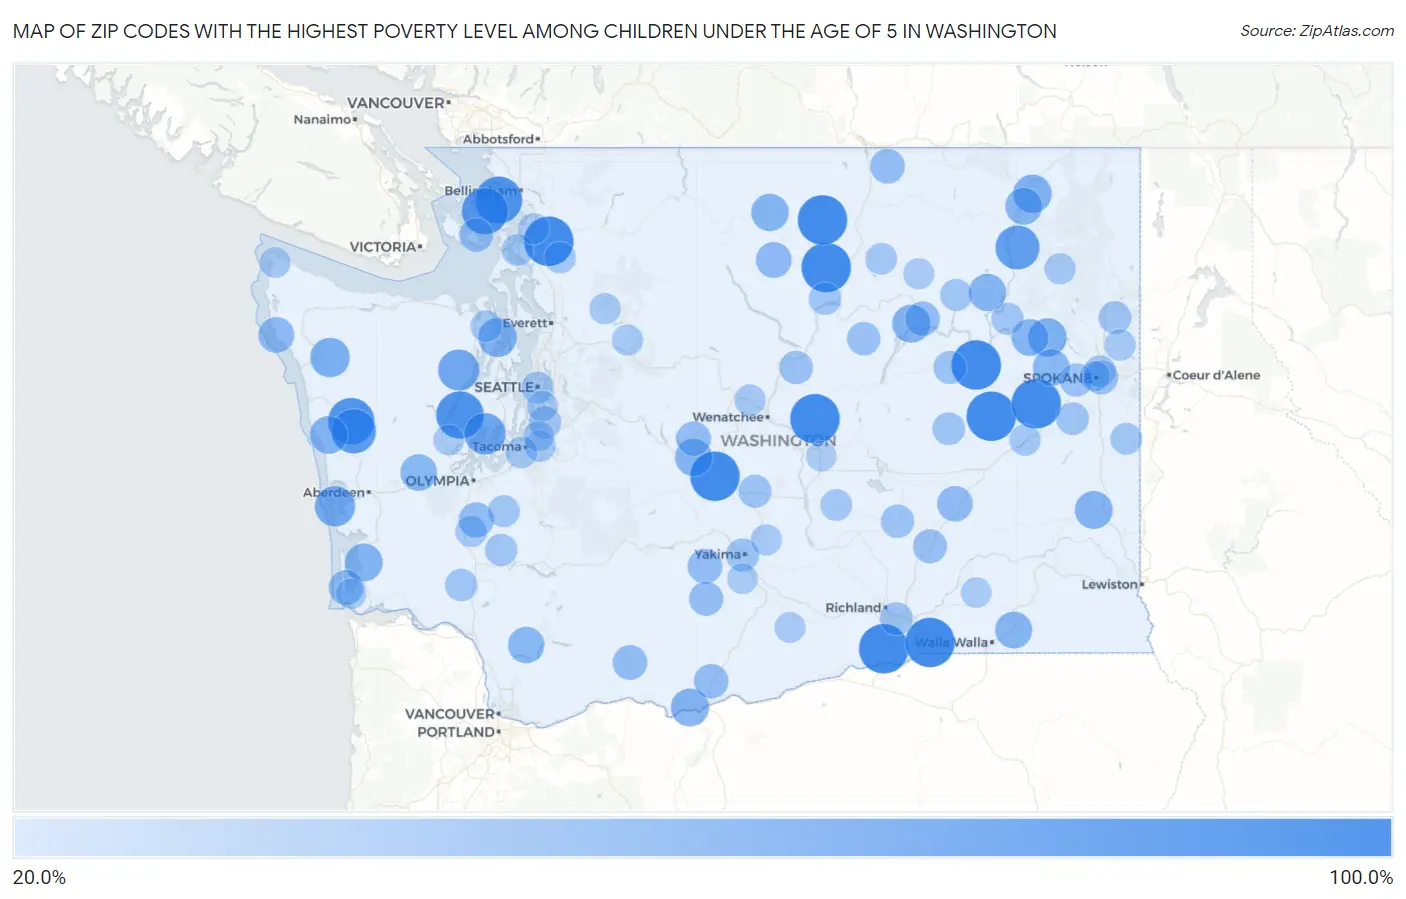
Map of Zip Codes with the Highest Poverty Level Among Children Under the Age of 5 in Washington
20.0%
100.0%
Zip Codes with the Highest Poverty Level Among Children Under the Age of 5 in Washington
| Zip Code | Child Poverty | vs State | vs National | |
| 1. | 98829 | 100.0% | 12.6%(+87.4)#1 | 18.1%(+81.9)#182 |
| 2. | 99134 | 100.0% | 12.6%(+87.4)#2 | 18.1%(+81.9)#208 |
| 3. | 98235 | 100.0% | 12.6%(+87.4)#3 | 18.1%(+81.9)#209 |
| 4. | 99117 | 100.0% | 12.6%(+87.4)#4 | 18.1%(+81.9)#210 |
| 5. | 99008 | 100.0% | 12.6%(+87.4)#5 | 18.1%(+81.9)#264 |
| 6. | 99346 | 100.0% | 12.6%(+87.4)#6 | 18.1%(+81.9)#290 |
| 7. | 98946 | 100.0% | 12.6%(+87.4)#7 | 18.1%(+81.9)#299 |
| 8. | 98819 | 100.0% | 12.6%(+87.4)#8 | 18.1%(+81.9)#408 |
| 9. | 98845 | 100.0% | 12.6%(+87.4)#9 | 18.1%(+81.9)#416 |
| 10. | 99363 | 100.0% | 12.6%(+87.4)#10 | 18.1%(+81.9)#511 |
| 11. | 98588 | 91.3% | 12.6%(+78.7)#11 | 18.1%(+73.2)#624 |
| 12. | 98262 | 90.0% | 12.6%(+77.4)#12 | 18.1%(+71.9)#638 |
| 13. | 98566 | 88.0% | 12.6%(+75.4)#13 | 18.1%(+69.9)#656 |
| 14. | 98279 | 87.2% | 12.6%(+74.6)#14 | 18.1%(+69.1)#672 |
| 15. | 98552 | 80.0% | 12.6%(+67.4)#15 | 18.1%(+61.9)#823 |
| 16. | 99167 | 77.8% | 12.6%(+65.2)#16 | 18.1%(+59.7)#876 |
| 17. | 98394 | 68.0% | 12.6%(+55.4)#17 | 18.1%(+49.9)#1,225 |
| 18. | 98320 | 66.7% | 12.6%(+54.0)#18 | 18.1%(+48.6)#1,280 |
| 19. | 98595 | 63.3% | 12.6%(+50.7)#19 | 18.1%(+45.3)#1,485 |
| 20. | 98331 | 59.5% | 12.6%(+46.9)#20 | 18.1%(+41.4)#1,729 |
| 21. | 98365 | 57.0% | 12.6%(+44.4)#21 | 18.1%(+38.9)#1,911 |
| 22. | 99013 | 55.9% | 12.6%(+43.3)#22 | 18.1%(+37.9)#1,993 |
| 23. | 99126 | 55.7% | 12.6%(+43.1)#23 | 18.1%(+37.7)#2,010 |
| 24. | 99133 | 54.5% | 12.6%(+41.9)#24 | 18.1%(+36.5)#2,099 |
| 25. | 98673 | 54.2% | 12.6%(+41.5)#25 | 18.1%(+36.1)#2,127 |
| 26. | 99111 | 53.6% | 12.6%(+41.0)#26 | 18.1%(+35.5)#2,182 |
| 27. | 98586 | 53.4% | 12.6%(+40.8)#27 | 18.1%(+35.4)#2,199 |
| 28. | 98587 | 53.3% | 12.6%(+40.7)#28 | 18.1%(+35.3)#2,219 |
| 29. | 98862 | 52.1% | 12.6%(+39.5)#29 | 18.1%(+34.1)#2,332 |
| 30. | 99138 | 52.1% | 12.6%(+39.5)#30 | 18.1%(+34.0)#2,334 |
| 31. | 98943 | 51.6% | 12.6%(+39.0)#31 | 18.1%(+33.6)#2,373 |
| 32. | 99040 | 50.0% | 12.6%(+37.4)#32 | 18.1%(+31.9)#2,561 |
| 33. | 99151 | 50.0% | 12.6%(+37.4)#33 | 18.1%(+31.9)#2,599 |
| 34. | 99329 | 50.0% | 12.6%(+37.4)#34 | 18.1%(+31.9)#2,604 |
| 35. | 99029 | 49.4% | 12.6%(+36.7)#35 | 18.1%(+31.3)#2,655 |
| 36. | 98541 | 48.9% | 12.6%(+36.3)#36 | 18.1%(+30.9)#2,698 |
| 37. | 98603 | 48.1% | 12.6%(+35.4)#37 | 18.1%(+30.0)#2,807 |
| 38. | 98350 | 45.5% | 12.6%(+32.8)#38 | 18.1%(+27.4)#3,122 |
| 39. | 98856 | 45.2% | 12.6%(+32.5)#39 | 18.1%(+27.1)#3,160 |
| 40. | 99341 | 44.4% | 12.6%(+31.8)#40 | 18.1%(+26.4)#3,265 |
| 41. | 98530 | 43.2% | 12.6%(+30.6)#41 | 18.1%(+25.2)#3,450 |
| 42. | 98631 | 42.6% | 12.6%(+30.0)#42 | 18.1%(+24.5)#3,553 |
| 43. | 98903 | 41.8% | 12.6%(+29.2)#43 | 18.1%(+23.7)#3,688 |
| 44. | 98650 | 41.5% | 12.6%(+28.9)#44 | 18.1%(+23.4)#3,747 |
| 45. | 98844 | 41.2% | 12.6%(+28.6)#45 | 18.1%(+23.1)#3,802 |
| 46. | 98620 | 40.8% | 12.6%(+28.2)#46 | 18.1%(+22.7)#3,870 |
| 47. | 99124 | 40.7% | 12.6%(+28.1)#47 | 18.1%(+22.7)#3,886 |
| 48. | 98922 | 40.5% | 12.6%(+27.9)#48 | 18.1%(+22.5)#3,924 |
| 49. | 98952 | 39.2% | 12.6%(+26.6)#49 | 18.1%(+21.1)#4,174 |
| 50. | 99326 | 38.6% | 12.6%(+26.0)#50 | 18.1%(+20.5)#4,285 |
| 51. | 99202 | 37.7% | 12.6%(+25.1)#51 | 18.1%(+19.7)#4,456 |
| 52. | 98261 | 37.0% | 12.6%(+24.4)#52 | 18.1%(+19.0)#4,586 |
| 53. | 98830 | 36.4% | 12.6%(+23.7)#53 | 18.1%(+18.3)#4,736 |
| 54. | 98843 | 36.3% | 12.6%(+23.6)#54 | 18.1%(+18.2)#4,765 |
| 55. | 99344 | 35.9% | 12.6%(+23.3)#55 | 18.1%(+17.8)#4,850 |
| 56. | 99001 | 35.7% | 12.6%(+23.1)#56 | 18.1%(+17.6)#4,904 |
| 57. | 98902 | 35.1% | 12.6%(+22.5)#57 | 18.1%(+17.1)#5,039 |
| 58. | 98934 | 34.9% | 12.6%(+22.3)#58 | 18.1%(+16.8)#5,098 |
| 59. | 99185 | 34.8% | 12.6%(+22.2)#59 | 18.1%(+16.7)#5,116 |
| 60. | 99336 | 34.3% | 12.6%(+21.7)#60 | 18.1%(+16.2)#5,226 |
| 61. | 99009 | 33.6% | 12.6%(+21.0)#61 | 18.1%(+15.6)#5,384 |
| 62. | 99004 | 33.4% | 12.6%(+20.7)#62 | 18.1%(+15.3)#5,426 |
| 63. | 99159 | 33.3% | 12.6%(+20.7)#63 | 18.1%(+15.3)#5,469 |
| 64. | 98593 | 32.8% | 12.6%(+20.2)#64 | 18.1%(+14.8)#5,631 |
| 65. | 98812 | 32.5% | 12.6%(+19.9)#65 | 18.1%(+14.4)#5,718 |
| 66. | 98570 | 32.1% | 12.6%(+19.5)#66 | 18.1%(+14.0)#5,815 |
| 67. | 98032 | 32.1% | 12.6%(+19.5)#67 | 18.1%(+14.0)#5,818 |
| 68. | 99129 | 31.7% | 12.6%(+19.1)#68 | 18.1%(+13.6)#5,904 |
| 69. | 98104 | 31.3% | 12.6%(+18.7)#69 | 18.1%(+13.2)#6,001 |
| 70. | 98576 | 31.1% | 12.6%(+18.5)#70 | 18.1%(+13.0)#6,062 |
| 71. | 99140 | 31.0% | 12.6%(+18.4)#71 | 18.1%(+13.0)#6,075 |
| 72. | 98257 | 30.6% | 12.6%(+18.0)#72 | 18.1%(+12.6)#6,183 |
| 73. | 99207 | 30.6% | 12.6%(+17.9)#73 | 18.1%(+12.5)#6,204 |
| 74. | 99018 | 30.0% | 12.6%(+17.4)#74 | 18.1%(+11.9)#6,359 |
| 75. | 99357 | 29.8% | 12.6%(+17.2)#75 | 18.1%(+11.7)#6,412 |
| 76. | 98531 | 29.6% | 12.6%(+17.0)#76 | 18.1%(+11.6)#6,475 |
| 77. | 98841 | 29.4% | 12.6%(+16.7)#77 | 18.1%(+11.3)#6,548 |
| 78. | 98409 | 29.2% | 12.6%(+16.6)#78 | 18.1%(+11.2)#6,589 |
| 79. | 98274 | 29.0% | 12.6%(+16.4)#79 | 18.1%(+10.9)#6,655 |
| 80. | 98325 | 28.9% | 12.6%(+16.3)#80 | 18.1%(+10.9)#6,668 |
| 81. | 99032 | 28.6% | 12.6%(+16.0)#81 | 18.1%(+10.5)#6,786 |
| 82. | 98252 | 27.9% | 12.6%(+15.3)#82 | 18.1%(+9.84)#6,987 |
| 83. | 99109 | 27.9% | 12.6%(+15.3)#83 | 18.1%(+9.83)#6,990 |
| 84. | 99021 | 27.9% | 12.6%(+15.3)#84 | 18.1%(+9.81)#6,999 |
| 85. | 98354 | 27.8% | 12.6%(+15.1)#85 | 18.1%(+9.70)#7,045 |
| 86. | 98815 | 27.7% | 12.6%(+15.1)#86 | 18.1%(+9.63)#7,059 |
| 87. | 98901 | 27.5% | 12.6%(+14.9)#87 | 18.1%(+9.43)#7,136 |
| 88. | 98251 | 27.1% | 12.6%(+14.4)#88 | 18.1%(+8.99)#7,293 |
| 89. | 98168 | 26.8% | 12.6%(+14.2)#89 | 18.1%(+8.74)#7,367 |
| 90. | 98233 | 26.8% | 12.6%(+14.2)#90 | 18.1%(+8.73)#7,368 |
| 91. | 99155 | 26.7% | 12.6%(+14.0)#91 | 18.1%(+8.60)#7,418 |
| 92. | 98584 | 26.5% | 12.6%(+13.9)#92 | 18.1%(+8.44)#7,478 |
| 93. | 98357 | 26.4% | 12.6%(+13.8)#93 | 18.1%(+8.38)#7,499 |
| 94. | 98935 | 26.1% | 12.6%(+13.5)#94 | 18.1%(+8.01)#7,624 |
| 95. | 98951 | 25.6% | 12.6%(+13.0)#95 | 18.1%(+7.53)#7,776 |
| 96. | 98003 | 25.5% | 12.6%(+12.9)#96 | 18.1%(+7.48)#7,803 |
| 97. | 99348 | 25.3% | 12.6%(+12.7)#97 | 18.1%(+7.25)#7,874 |
| 98. | 99201 | 25.3% | 12.6%(+12.7)#98 | 18.1%(+7.24)#7,879 |
| 99. | 98624 | 25.0% | 12.6%(+12.4)#99 | 18.1%(+6.94)#7,984 |
| 100. | 98848 | 24.6% | 12.6%(+12.0)#100 | 18.1%(+6.55)#8,140 |
Common Questions
What are the Top 10 Zip Codes with the Highest Poverty Level Among Children Under the Age of 5 in Washington?
Top 10 Zip Codes with the Highest Poverty Level Among Children Under the Age of 5 in Washington are:
What zip code has the Highest Poverty Level Among Children Under the Age of 5 in Washington?
98829 has the Highest Poverty Level Among Children Under the Age of 5 in Washington with 100.0%.
What is the Poverty Level Among Children Under the Age of 5 in the State of Washington?
Poverty Level Among Children Under the Age of 5 in Washington is 12.6%.
What is the Poverty Level Among Children Under the Age of 5 in the United States?
Poverty Level Among Children Under the Age of 5 in the United States is 18.1%.