Rochester, WA Map & Demographics
Rochester Map
Rochester Overview
$33,330
PER CAPITA INCOME
$96,778
AVG FAMILY INCOME
$92,883
AVG HOUSEHOLD INCOME
22.2%
WAGE / INCOME GAP [ % ]
77.8¢/ $1
WAGE / INCOME GAP [ $ ]
0.34
INEQUALITY / GINI INDEX
6,282
TOTAL POPULATION
3,114
MALE POPULATION
3,168
FEMALE POPULATION
98.30
MALES / 100 FEMALES
101.73
FEMALES / 100 MALES
42.7
MEDIAN AGE
3.3
AVG FAMILY SIZE
2.9
AVG HOUSEHOLD SIZE
2,935
LABOR FORCE [ PEOPLE ]
58.6%
PERCENT IN LABOR FORCE
0.4%
UNEMPLOYMENT RATE
Rochester Zip Codes
Rochester Area Codes
Income in Rochester
Income Overview in Rochester
Per Capita Income in Rochester is $33,330, while median incomes of families and households are $96,778 and $92,883 respectively.
| Characteristic | Number | Measure |
| Per Capita Income | 6,282 | $33,330 |
| Median Family Income | 1,564 | $96,778 |
| Mean Family Income | 1,564 | $107,645 |
| Median Household Income | 2,161 | $92,883 |
| Mean Household Income | 2,161 | $97,628 |
| Income Deficit | 1,564 | $0 |
| Wage / Income Gap (%) | 6,282 | 22.23% |
| Wage / Income Gap ($) | 6,282 | 77.77¢ per $1 |
| Gini / Inequality Index | 6,282 | 0.34 |
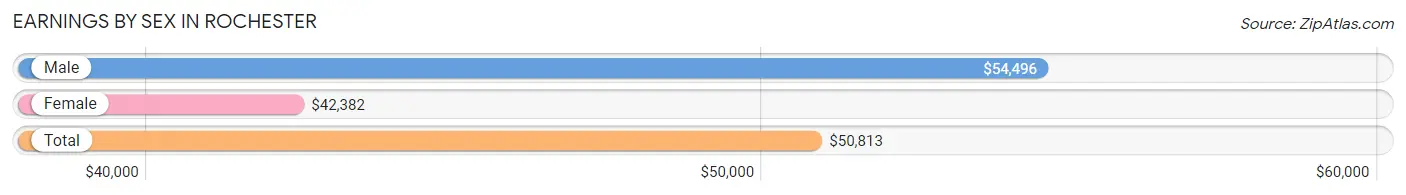
Earnings by Sex in Rochester
Average Earnings in Rochester are $50,813, $54,496 for men and $42,382 for women, a difference of 22.2%.
| Sex | Number | Average Earnings |
| Male | 1,487 (49.4%) | $54,496 |
| Female | 1,525 (50.6%) | $42,382 |
| Total | 3,012 (100.0%) | $50,813 |
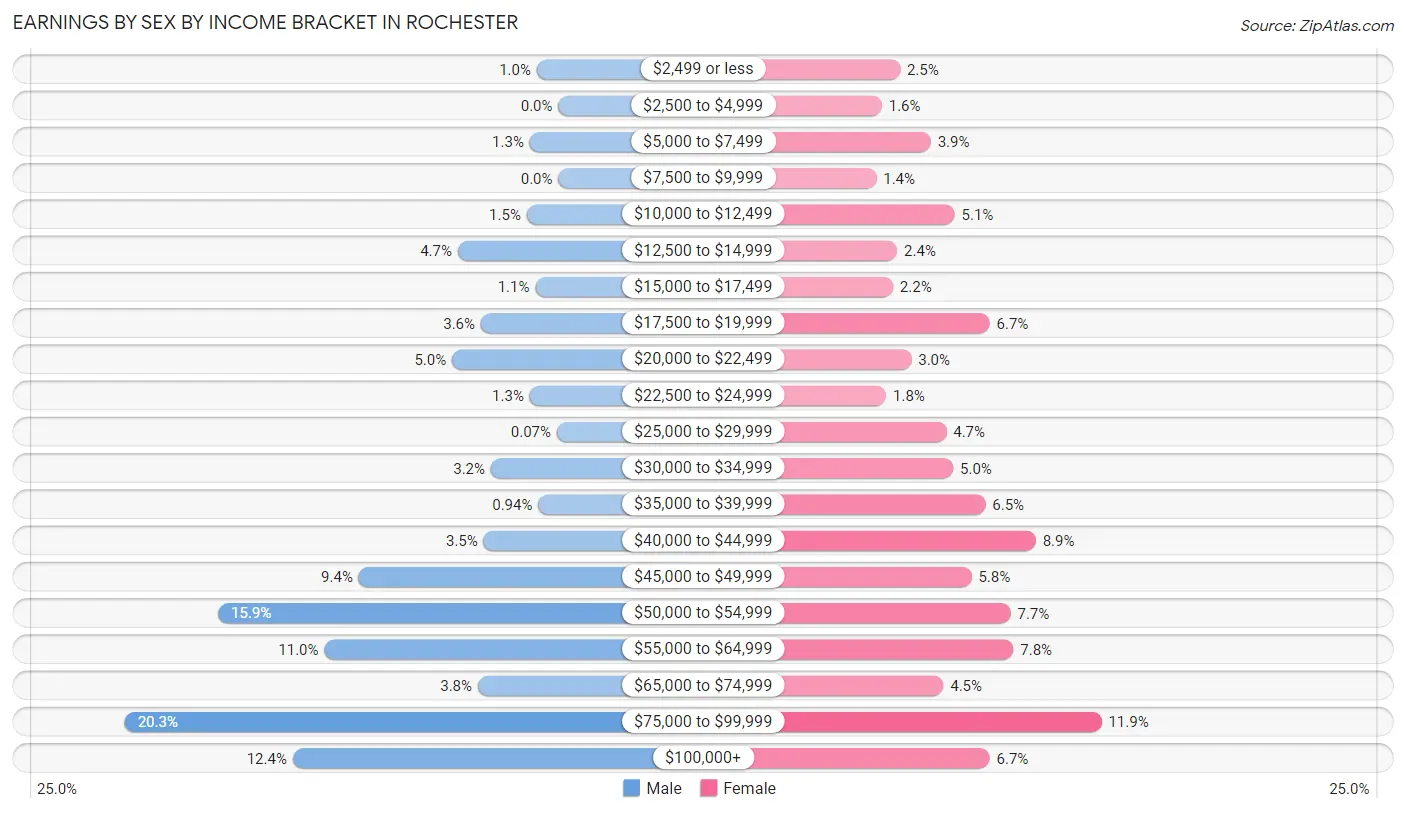
Earnings by Sex by Income Bracket in Rochester
The most common earnings brackets in Rochester are $75,000 to $99,999 for men (302 | 20.3%) and $75,000 to $99,999 for women (182 | 11.9%).
| Income | Male | Female |
| $2,499 or less | 15 (1.0%) | 38 (2.5%) |
| $2,500 to $4,999 | 0 (0.0%) | 25 (1.6%) |
| $5,000 to $7,499 | 20 (1.3%) | 60 (3.9%) |
| $7,500 to $9,999 | 0 (0.0%) | 21 (1.4%) |
| $10,000 to $12,499 | 22 (1.5%) | 77 (5.1%) |
| $12,500 to $14,999 | 70 (4.7%) | 36 (2.4%) |
| $15,000 to $17,499 | 16 (1.1%) | 33 (2.2%) |
| $17,500 to $19,999 | 54 (3.6%) | 102 (6.7%) |
| $20,000 to $22,499 | 74 (5.0%) | 46 (3.0%) |
| $22,500 to $24,999 | 20 (1.3%) | 28 (1.8%) |
| $25,000 to $29,999 | 1 (0.1%) | 71 (4.7%) |
| $30,000 to $34,999 | 47 (3.2%) | 76 (5.0%) |
| $35,000 to $39,999 | 14 (0.9%) | 99 (6.5%) |
| $40,000 to $44,999 | 52 (3.5%) | 135 (8.8%) |
| $45,000 to $49,999 | 139 (9.3%) | 89 (5.8%) |
| $50,000 to $54,999 | 237 (15.9%) | 117 (7.7%) |
| $55,000 to $64,999 | 163 (11.0%) | 119 (7.8%) |
| $65,000 to $74,999 | 56 (3.8%) | 69 (4.5%) |
| $75,000 to $99,999 | 302 (20.3%) | 182 (11.9%) |
| $100,000+ | 185 (12.4%) | 102 (6.7%) |
| Total | 1,487 (100.0%) | 1,525 (100.0%) |
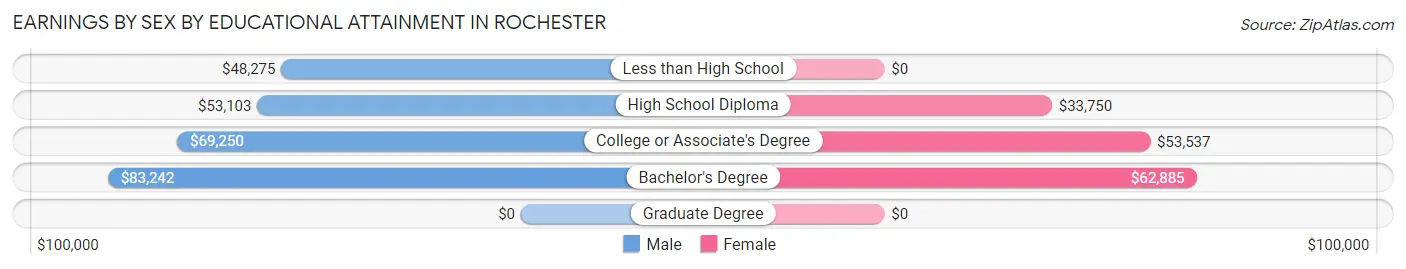
Earnings by Sex by Educational Attainment in Rochester
Average earnings in Rochester are $56,568 for men and $45,927 for women, a difference of 18.8%. Men with an educational attainment of bachelor's degree enjoy the highest average annual earnings of $83,242, while those with less than high school education earn the least with $48,275. Women with an educational attainment of bachelor's degree earn the most with the average annual earnings of $62,885, while those with high school diploma education have the smallest earnings of $33,750.
| Educational Attainment | Male Income | Female Income |
| Less than High School | $48,275 | $0 |
| High School Diploma | $53,103 | $33,750 |
| College or Associate's Degree | $69,250 | $53,537 |
| Bachelor's Degree | $83,242 | $62,885 |
| Graduate Degree | - | - |
| Total | $56,568 | $45,927 |
Family Income in Rochester
Family Income Brackets in Rochester
According to the Rochester family income data, there are 443 families falling into the $100,000 to $149,999 income range, which is the most common income bracket and makes up 28.3% of all families. Conversely, the less than $10,000 income bracket is the least frequent group with only 16 families (1.0%) belonging to this category.
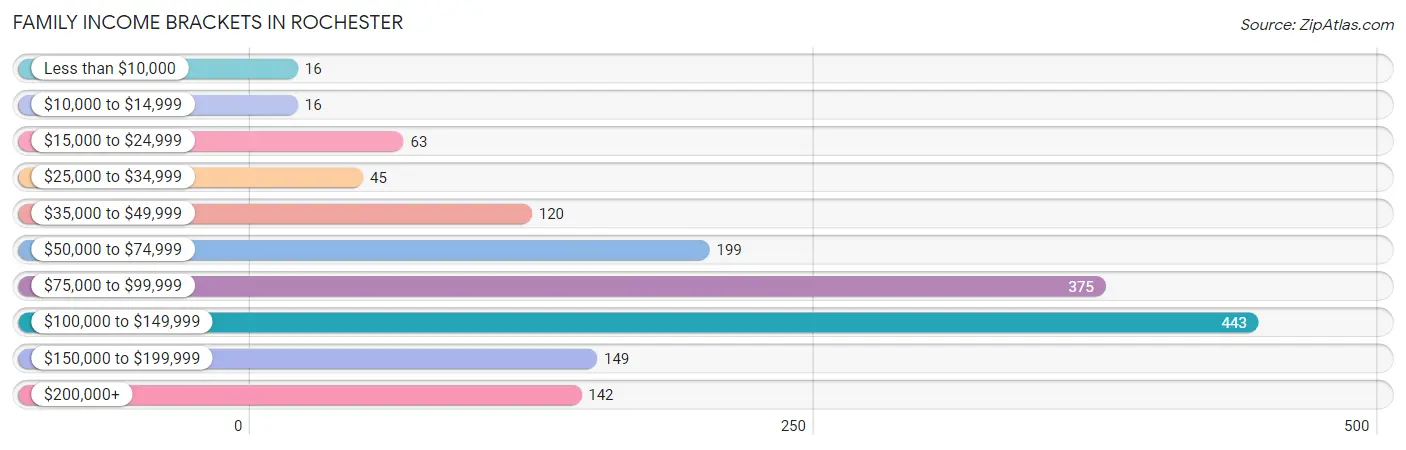
| Income Bracket | # Families | % Families |
| Less than $10,000 | 16 | 1.0% |
| $10,000 to $14,999 | 16 | 1.0% |
| $15,000 to $24,999 | 63 | 4.0% |
| $25,000 to $34,999 | 45 | 2.9% |
| $35,000 to $49,999 | 120 | 7.7% |
| $50,000 to $74,999 | 199 | 12.7% |
| $75,000 to $99,999 | 375 | 24.0% |
| $100,000 to $149,999 | 443 | 28.3% |
| $150,000 to $199,999 | 149 | 9.5% |
| $200,000+ | 142 | 9.1% |
Family Income by Famaliy Size in Rochester
4-person families (248 | 15.9%) account for the highest median family income in Rochester with $134,254 per family, while 2-person families (676 | 43.2%) have the highest median income of $46,099 per family member.
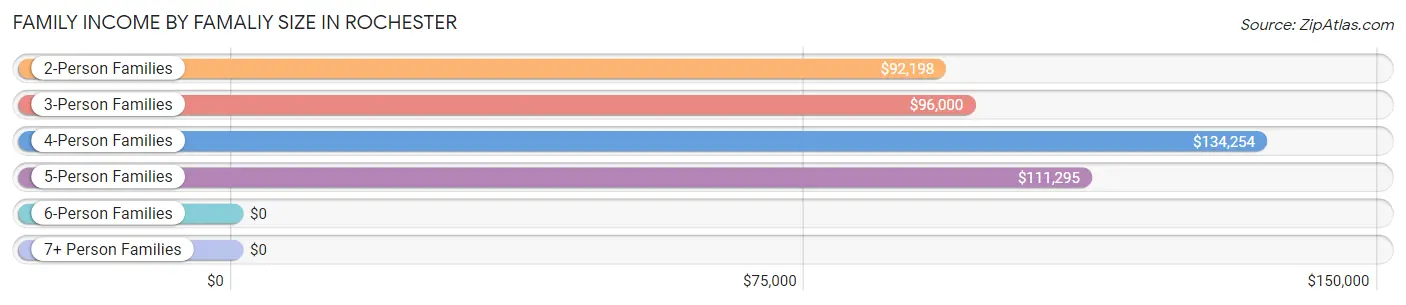
| Income Bracket | # Families | Median Income |
| 2-Person Families | 676 (43.2%) | $92,198 |
| 3-Person Families | 350 (22.4%) | $96,000 |
| 4-Person Families | 248 (15.9%) | $134,254 |
| 5-Person Families | 185 (11.8%) | $111,295 |
| 6-Person Families | 45 (2.9%) | $0 |
| 7+ Person Families | 60 (3.8%) | $0 |
| Total | 1,564 (100.0%) | $96,778 |
Family Income by Number of Earners in Rochester
The median family income in Rochester is $96,778, with families comprising 3+ earners (286) having the highest median family income of $133,370, while families with no earners (266) have the lowest median family income of $59,671, accounting for 18.3% and 17.0% of families, respectively.
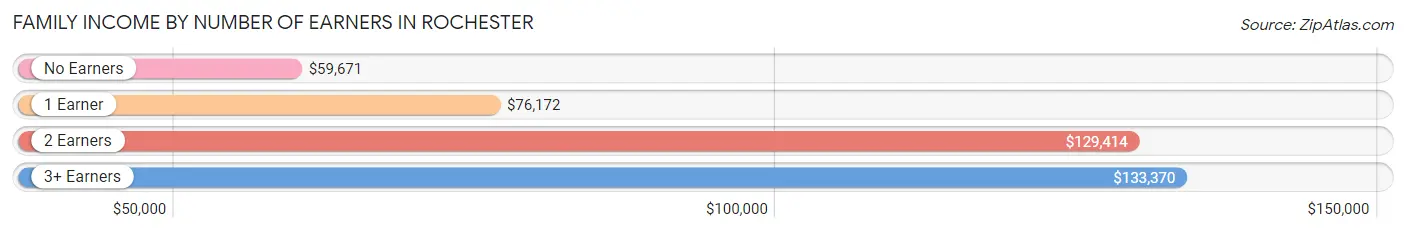
| Number of Earners | # Families | Median Income |
| No Earners | 266 (17.0%) | $59,671 |
| 1 Earner | 501 (32.0%) | $76,172 |
| 2 Earners | 511 (32.7%) | $129,414 |
| 3+ Earners | 286 (18.3%) | $133,370 |
| Total | 1,564 (100.0%) | $96,778 |
Household Income in Rochester
Household Income Brackets in Rochester
With 568 households falling in the category, the $100,000 to $149,999 income range is the most frequent in Rochester, accounting for 26.3% of all households. In contrast, only 48 households (2.2%) fall into the less than $10,000 income bracket, making it the least populous group.
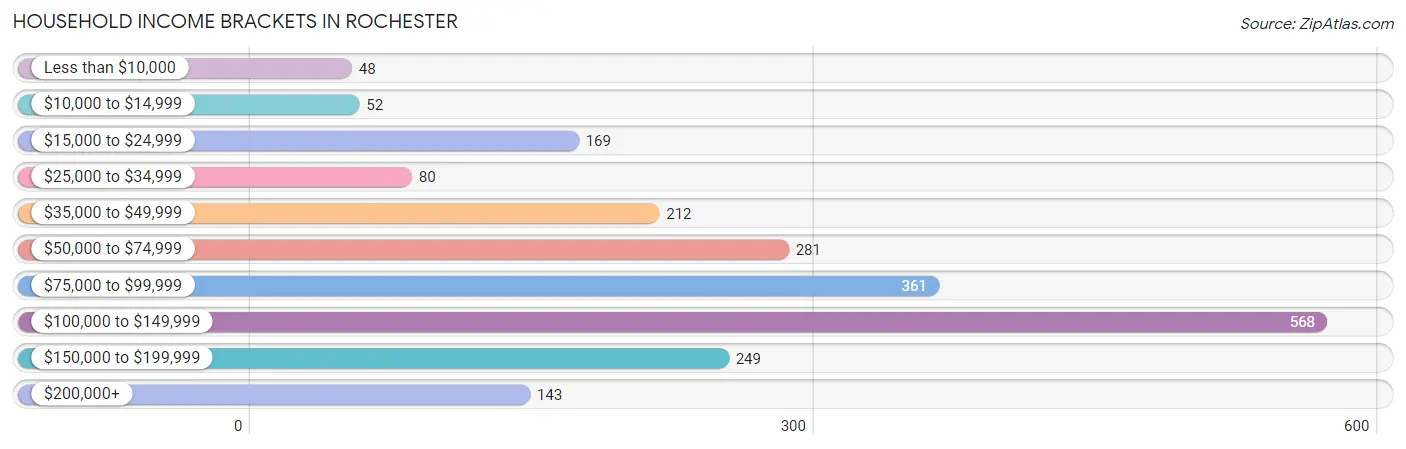
| Income Bracket | # Households | % Households |
| Less than $10,000 | 48 | 2.2% |
| $10,000 to $14,999 | 52 | 2.4% |
| $15,000 to $24,999 | 169 | 7.8% |
| $25,000 to $34,999 | 80 | 3.7% |
| $35,000 to $49,999 | 212 | 9.8% |
| $50,000 to $74,999 | 281 | 13.0% |
| $75,000 to $99,999 | 361 | 16.7% |
| $100,000 to $149,999 | 568 | 26.3% |
| $150,000 to $199,999 | 249 | 11.5% |
| $200,000+ | 143 | 6.6% |
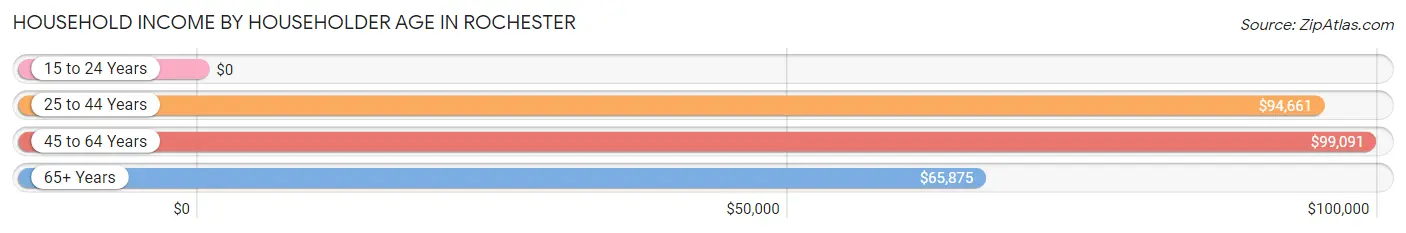
Household Income by Householder Age in Rochester
The median household income in Rochester is $92,883, with the highest median household income of $99,091 found in the 45 to 64 years age bracket for the primary householder. A total of 1,078 households (49.9%) fall into this category. Meanwhile, the 15 to 24 years age bracket for the primary householder has the lowest median household income of $0, with 25 households (1.2%) in this group.
| Income Bracket | # Households | Median Income |
| 15 to 24 Years | 25 (1.2%) | $0 |
| 25 to 44 Years | 513 (23.7%) | $94,661 |
| 45 to 64 Years | 1,078 (49.9%) | $99,091 |
| 65+ Years | 545 (25.2%) | $65,875 |
| Total | 2,161 (100.0%) | $92,883 |
Poverty in Rochester
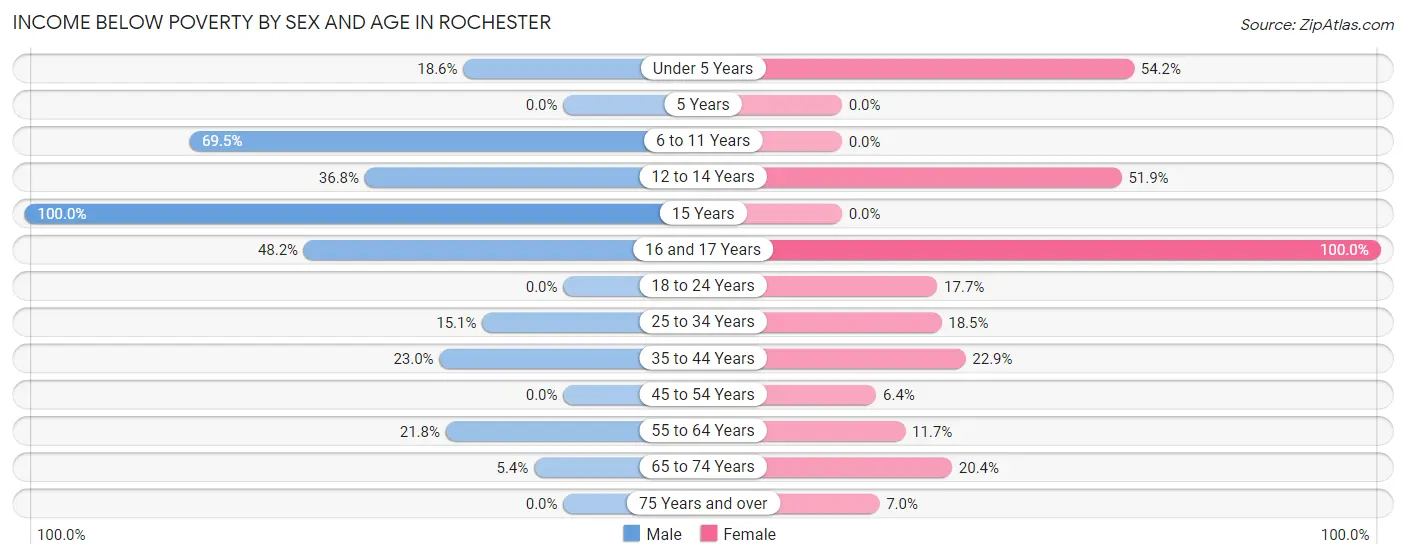
Income Below Poverty by Sex and Age in Rochester
With 14.8% poverty level for males and 20.3% for females among the residents of Rochester, 15 year old males and 16 and 17 year old females are the most vulnerable to poverty, with 26 males (100.0%) and 62 females (100.0%) in their respective age groups living below the poverty level.
| Age Bracket | Male | Female |
| Under 5 Years | 75 (18.6%) | 142 (54.2%) |
| 5 Years | 0 (0.0%) | 0 (0.0%) |
| 6 to 11 Years | 107 (69.5%) | 0 (0.0%) |
| 12 to 14 Years | 28 (36.8%) | 68 (51.9%) |
| 15 Years | 26 (100.0%) | 0 (0.0%) |
| 16 and 17 Years | 26 (48.1%) | 62 (100.0%) |
| 18 to 24 Years | 0 (0.0%) | 54 (17.7%) |
| 25 to 34 Years | 42 (15.0%) | 94 (18.5%) |
| 35 to 44 Years | 46 (23.0%) | 92 (22.9%) |
| 45 to 54 Years | 0 (0.0%) | 32 (6.4%) |
| 55 to 64 Years | 96 (21.8%) | 33 (11.7%) |
| 65 to 74 Years | 15 (5.4%) | 48 (20.4%) |
| 75 Years and over | 0 (0.0%) | 18 (7.0%) |
| Total | 461 (14.8%) | 643 (20.3%) |
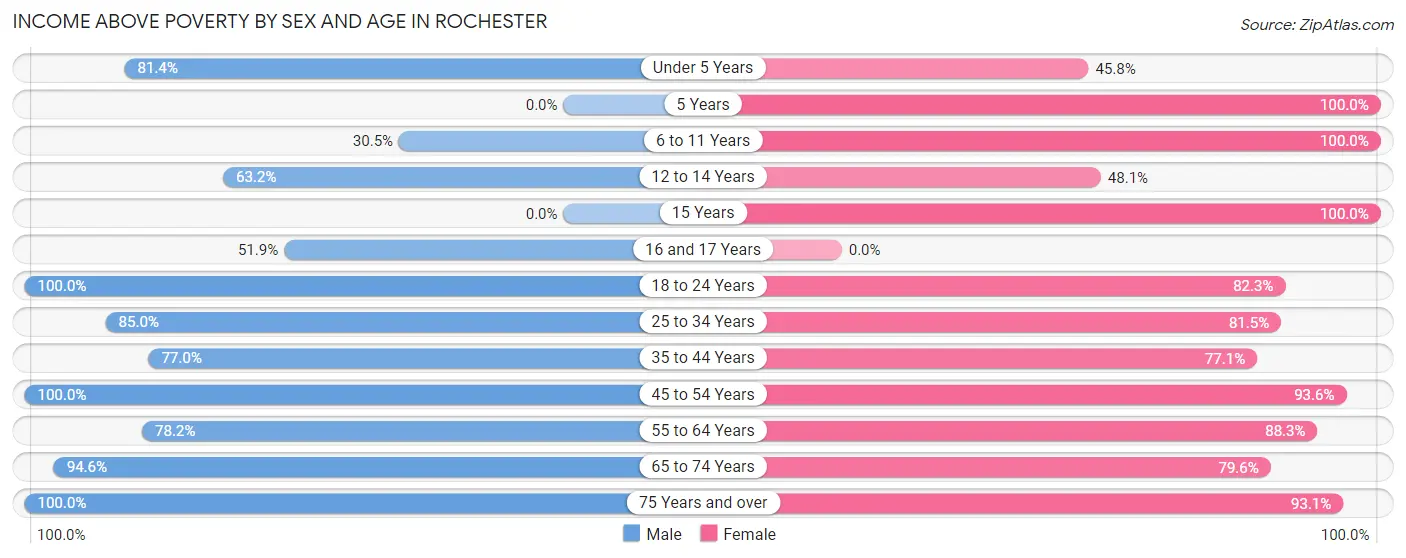
Income Above Poverty by Sex and Age in Rochester
According to the poverty statistics in Rochester, males aged 18 to 24 years and females aged 5 years are the age groups that are most secure financially, with 100.0% of males and 100.0% of females in these age groups living above the poverty line.
| Age Bracket | Male | Female |
| Under 5 Years | 329 (81.4%) | 120 (45.8%) |
| 5 Years | 0 (0.0%) | 107 (100.0%) |
| 6 to 11 Years | 47 (30.5%) | 90 (100.0%) |
| 12 to 14 Years | 48 (63.2%) | 63 (48.1%) |
| 15 Years | 0 (0.0%) | 23 (100.0%) |
| 16 and 17 Years | 28 (51.8%) | 0 (0.0%) |
| 18 to 24 Years | 200 (100.0%) | 251 (82.3%) |
| 25 to 34 Years | 237 (85.0%) | 415 (81.5%) |
| 35 to 44 Years | 154 (77.0%) | 309 (77.1%) |
| 45 to 54 Years | 760 (100.0%) | 470 (93.6%) |
| 55 to 64 Years | 344 (78.2%) | 248 (88.3%) |
| 65 to 74 Years | 262 (94.6%) | 187 (79.6%) |
| 75 Years and over | 244 (100.0%) | 241 (93.0%) |
| Total | 2,653 (85.2%) | 2,524 (79.7%) |
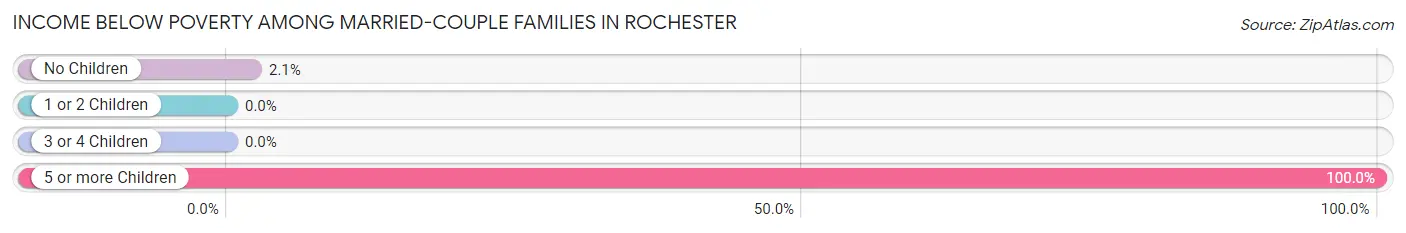
Income Below Poverty Among Married-Couple Families in Rochester
The poverty statistics for married-couple families in Rochester show that 5.9% or 75 of the total 1,269 families live below the poverty line. Families with 5 or more children have the highest poverty rate of 100.0%, comprising of 60 families. On the other hand, families with 1 or 2 children have the lowest poverty rate of 0.0%, which includes 0 families.
| Children | Above Poverty | Below Poverty |
| No Children | 704 (97.9%) | 15 (2.1%) |
| 1 or 2 Children | 417 (100.0%) | 0 (0.0%) |
| 3 or 4 Children | 73 (100.0%) | 0 (0.0%) |
| 5 or more Children | 0 (0.0%) | 60 (100.0%) |
| Total | 1,194 (94.1%) | 75 (5.9%) |
Income Below Poverty Among Single-Parent Households in Rochester
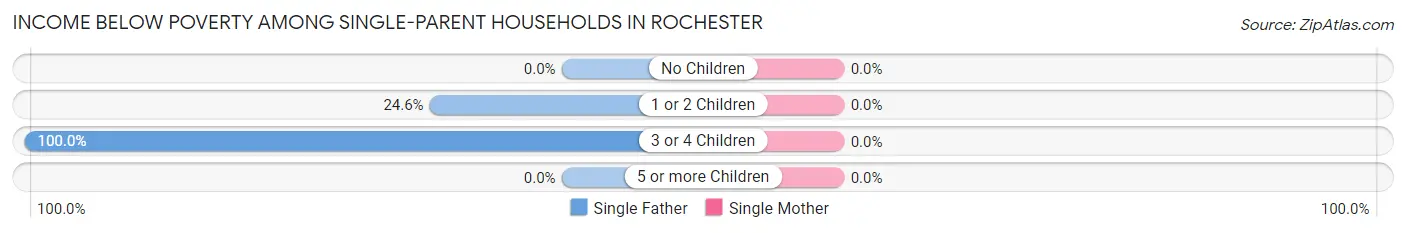
| Children | Single Father | Single Mother |
| No Children | 0 (0.0%) | 0 (0.0%) |
| 1 or 2 Children | 15 (24.6%) | 0 (0.0%) |
| 3 or 4 Children | 31 (100.0%) | 0 (0.0%) |
| 5 or more Children | 0 (0.0%) | 0 (0.0%) |
| Total | 46 (43.0%) | 0 (0.0%) |
Income Below Poverty Among Married-Couple vs Single-Parent Households in Rochester
The poverty data for Rochester shows that 75 of the married-couple family households (5.9%) and 46 of the single-parent households (15.6%) are living below the poverty level. Within the married-couple family households, those with 5 or more children have the highest poverty rate, with 60 households (100.0%) falling below the poverty line. Among the single-parent households, those with 3 or 4 children have the highest poverty rate, with 31 household (100.0%) living below poverty.
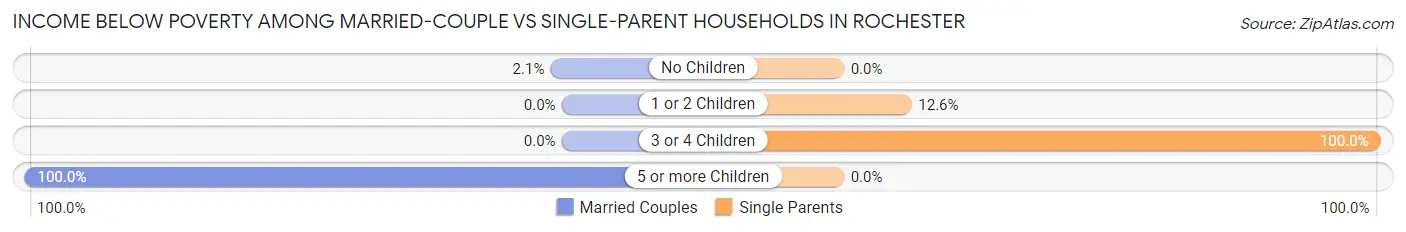
| Children | Married-Couple Families | Single-Parent Households |
| No Children | 15 (2.1%) | 0 (0.0%) |
| 1 or 2 Children | 0 (0.0%) | 15 (12.6%) |
| 3 or 4 Children | 0 (0.0%) | 31 (100.0%) |
| 5 or more Children | 60 (100.0%) | 0 (0.0%) |
| Total | 75 (5.9%) | 46 (15.6%) |
Race in Rochester
The most populous races in Rochester are White / Caucasian (5,097 | 81.1%), Hispanic or Latino (1,175 | 18.7%), and Two or more Races (727 | 11.6%).
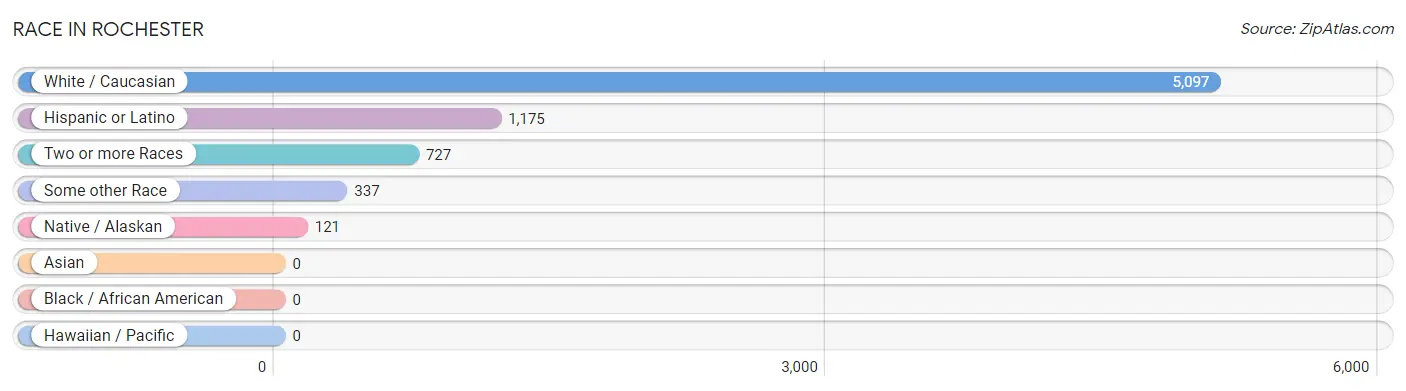
| Race | # Population | % Population |
| Asian | 0 | 0.0% |
| Black / African American | 0 | 0.0% |
| Hawaiian / Pacific | 0 | 0.0% |
| Hispanic or Latino | 1,175 | 18.7% |
| Native / Alaskan | 121 | 1.9% |
| White / Caucasian | 5,097 | 81.1% |
| Two or more Races | 727 | 11.6% |
| Some other Race | 337 | 5.4% |
| Total | 6,282 | 100.0% |
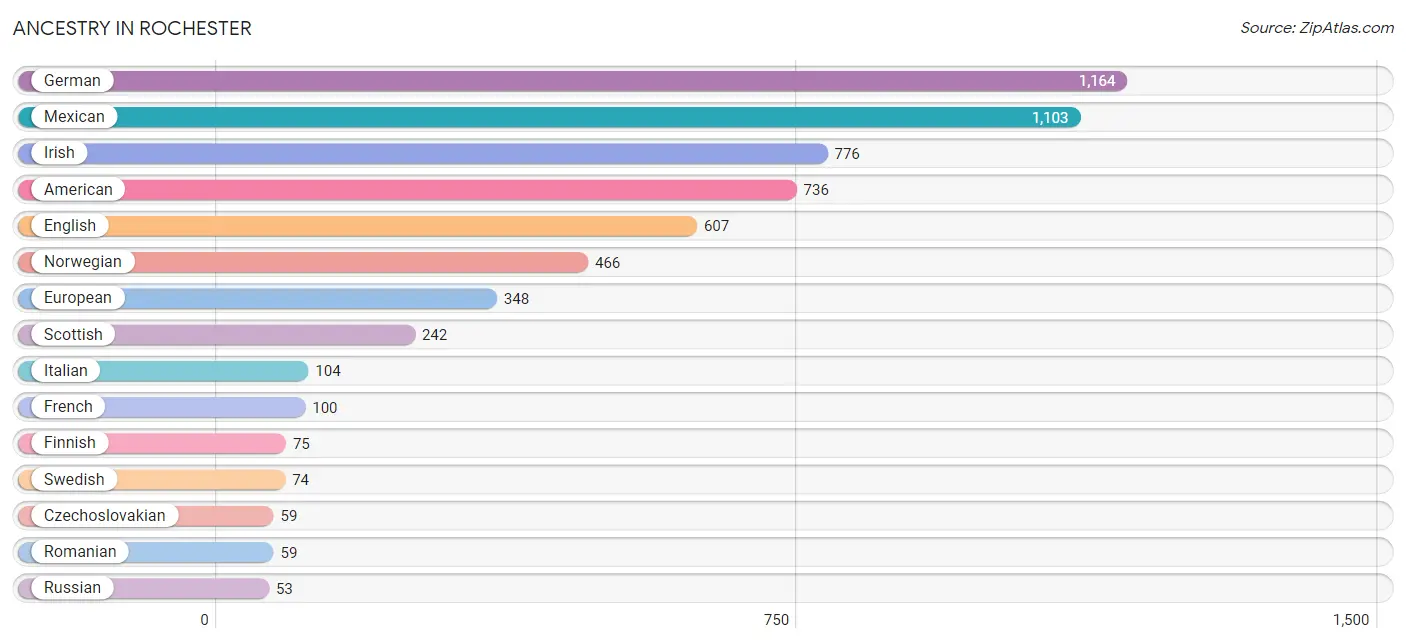
Ancestry in Rochester
The most populous ancestries reported in Rochester are German (1,164 | 18.5%), Mexican (1,103 | 17.6%), Irish (776 | 12.3%), American (736 | 11.7%), and English (607 | 9.7%), together accounting for 69.8% of all Rochester residents.
| Ancestry | # Population | % Population |
| Aleut | 32 | 0.5% |
| American | 736 | 11.7% |
| Arab | 11 | 0.2% |
| British | 29 | 0.5% |
| Cherokee | 37 | 0.6% |
| Cheyenne | 6 | 0.1% |
| Choctaw | 12 | 0.2% |
| Czechoslovakian | 59 | 0.9% |
| Danish | 45 | 0.7% |
| Dutch | 31 | 0.5% |
| Ecuadorian | 20 | 0.3% |
| English | 607 | 9.7% |
| European | 348 | 5.5% |
| Finnish | 75 | 1.2% |
| French | 100 | 1.6% |
| German | 1,164 | 18.5% |
| Irish | 776 | 12.3% |
| Italian | 104 | 1.7% |
| Lithuanian | 41 | 0.6% |
| Mexican | 1,103 | 17.6% |
| Norwegian | 466 | 7.4% |
| Polish | 36 | 0.6% |
| Puget Sound Salish | 18 | 0.3% |
| Romanian | 59 | 0.9% |
| Russian | 53 | 0.8% |
| Scandinavian | 16 | 0.3% |
| Scottish | 242 | 3.8% |
| South American | 20 | 0.3% |
| Spaniard | 1 | 0.0% |
| Spanish | 24 | 0.4% |
| Swedish | 74 | 1.2% |
| Swiss | 19 | 0.3% | View All 32 Rows |
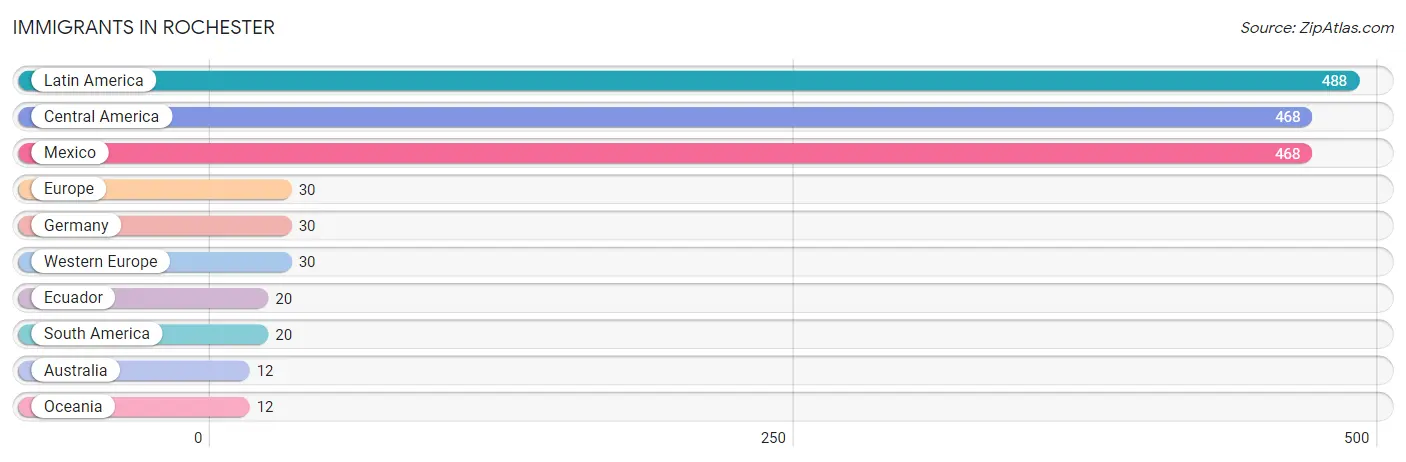
Immigrants in Rochester
The most numerous immigrant groups reported in Rochester came from Latin America (488 | 7.8%), Central America (468 | 7.4%), Mexico (468 | 7.4%), Europe (30 | 0.5%), and Germany (30 | 0.5%), together accounting for 23.6% of all Rochester residents.
| Immigration Origin | # Population | % Population |
| Australia | 12 | 0.2% |
| Central America | 468 | 7.4% |
| Ecuador | 20 | 0.3% |
| Europe | 30 | 0.5% |
| Germany | 30 | 0.5% |
| Latin America | 488 | 7.8% |
| Mexico | 468 | 7.4% |
| Oceania | 12 | 0.2% |
| South America | 20 | 0.3% |
| Western Europe | 30 | 0.5% | View All 10 Rows |
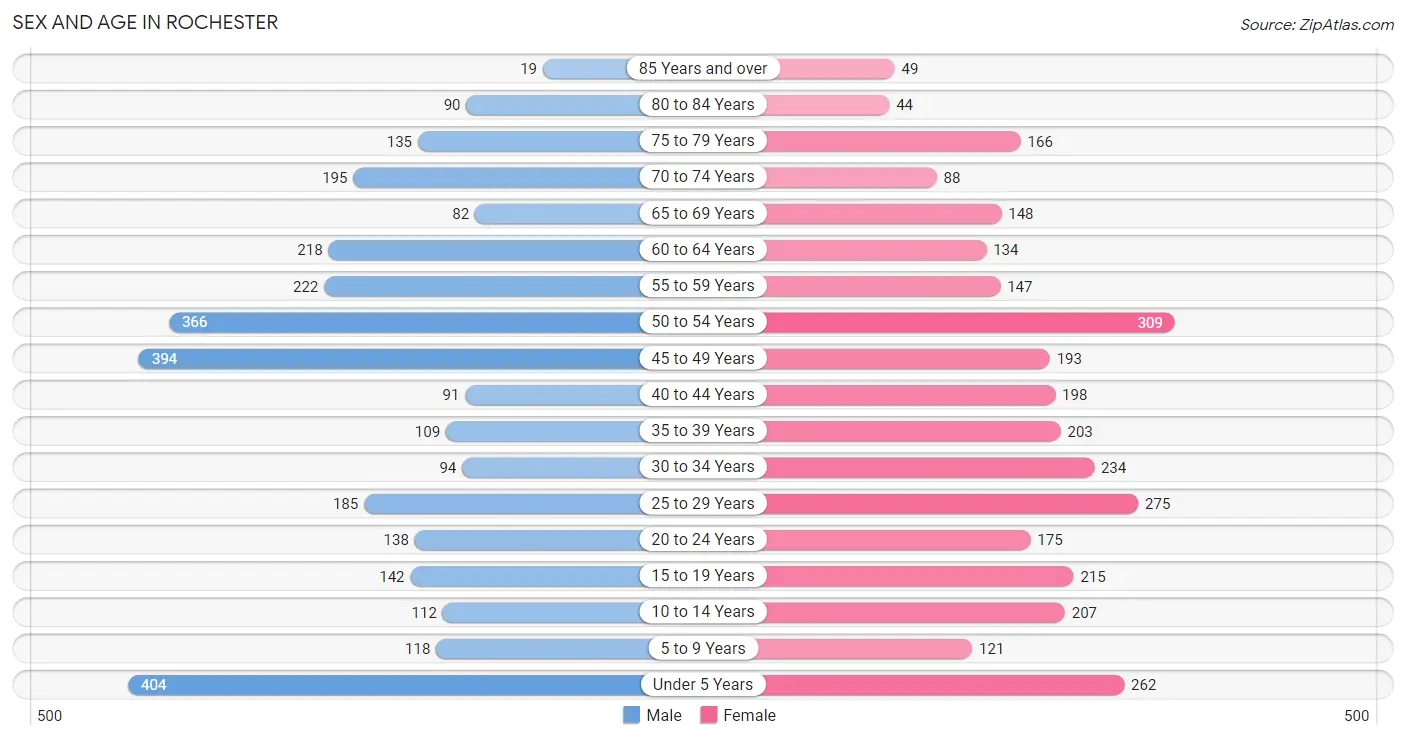
Sex and Age in Rochester
Sex and Age in Rochester
The most populous age groups in Rochester are Under 5 Years (404 | 13.0%) for men and 50 to 54 Years (309 | 9.8%) for women.
| Age Bracket | Male | Female |
| Under 5 Years | 404 (13.0%) | 262 (8.3%) |
| 5 to 9 Years | 118 (3.8%) | 121 (3.8%) |
| 10 to 14 Years | 112 (3.6%) | 207 (6.5%) |
| 15 to 19 Years | 142 (4.6%) | 215 (6.8%) |
| 20 to 24 Years | 138 (4.4%) | 175 (5.5%) |
| 25 to 29 Years | 185 (5.9%) | 275 (8.7%) |
| 30 to 34 Years | 94 (3.0%) | 234 (7.4%) |
| 35 to 39 Years | 109 (3.5%) | 203 (6.4%) |
| 40 to 44 Years | 91 (2.9%) | 198 (6.2%) |
| 45 to 49 Years | 394 (12.7%) | 193 (6.1%) |
| 50 to 54 Years | 366 (11.7%) | 309 (9.8%) |
| 55 to 59 Years | 222 (7.1%) | 147 (4.6%) |
| 60 to 64 Years | 218 (7.0%) | 134 (4.2%) |
| 65 to 69 Years | 82 (2.6%) | 148 (4.7%) |
| 70 to 74 Years | 195 (6.3%) | 88 (2.8%) |
| 75 to 79 Years | 135 (4.3%) | 166 (5.2%) |
| 80 to 84 Years | 90 (2.9%) | 44 (1.4%) |
| 85 Years and over | 19 (0.6%) | 49 (1.5%) |
| Total | 3,114 (100.0%) | 3,168 (100.0%) |
Families and Households in Rochester
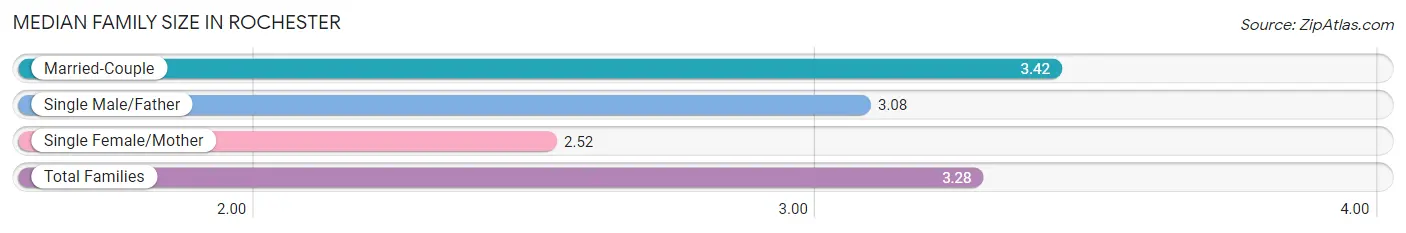
Median Family Size in Rochester
The median family size in Rochester is 3.28 persons per family, with married-couple families (1,269 | 81.1%) accounting for the largest median family size of 3.42 persons per family. On the other hand, single female/mother families (188 | 12.0%) represent the smallest median family size with 2.52 persons per family.
| Family Type | # Families | Family Size |
| Married-Couple | 1,269 (81.1%) | 3.42 |
| Single Male/Father | 107 (6.8%) | 3.08 |
| Single Female/Mother | 188 (12.0%) | 2.52 |
| Total Families | 1,564 (100.0%) | 3.28 |
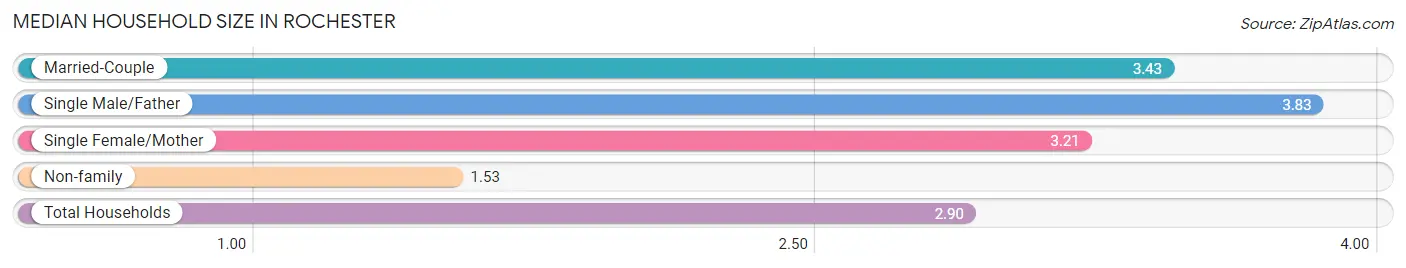
Median Household Size in Rochester
The median household size in Rochester is 2.90 persons per household, with single male/father households (107 | 5.0%) accounting for the largest median household size of 3.83 persons per household. non-family households (597 | 27.6%) represent the smallest median household size with 1.53 persons per household.
| Household Type | # Households | Household Size |
| Married-Couple | 1,269 (58.7%) | 3.43 |
| Single Male/Father | 107 (5.0%) | 3.83 |
| Single Female/Mother | 188 (8.7%) | 3.21 |
| Non-family | 597 (27.6%) | 1.53 |
| Total Households | 2,161 (100.0%) | 2.90 |
Household Size by Marriage Status in Rochester
Out of a total of 2,161 households in Rochester, 1,564 (72.4%) are family households, while 597 (27.6%) are nonfamily households. The most numerous type of family households are 2-person households, comprising 627, and the most common type of nonfamily households are 1-person households, comprising 474.
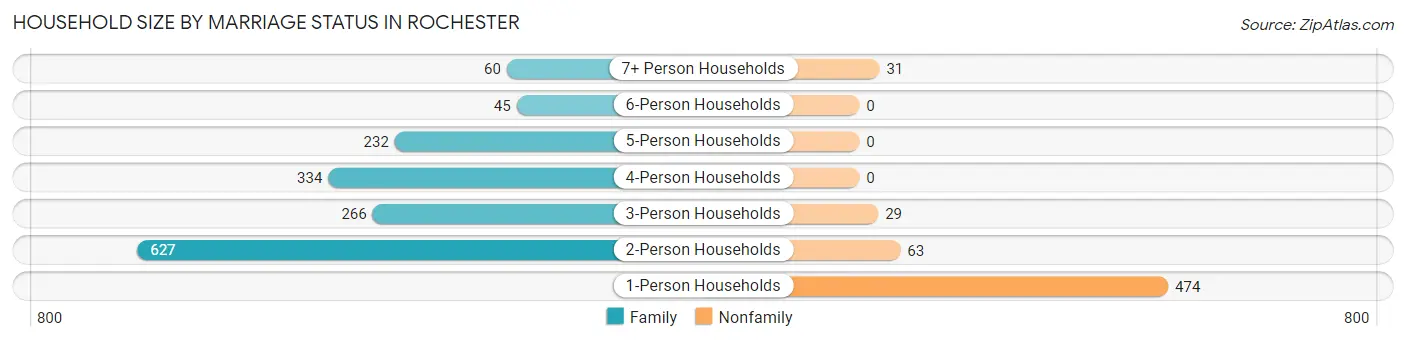
| Household Size | Family Households | Nonfamily Households |
| 1-Person Households | - | 474 (21.9%) |
| 2-Person Households | 627 (29.0%) | 63 (2.9%) |
| 3-Person Households | 266 (12.3%) | 29 (1.3%) |
| 4-Person Households | 334 (15.5%) | 0 (0.0%) |
| 5-Person Households | 232 (10.7%) | 0 (0.0%) |
| 6-Person Households | 45 (2.1%) | 0 (0.0%) |
| 7+ Person Households | 60 (2.8%) | 31 (1.4%) |
| Total | 1,564 (72.4%) | 597 (27.6%) |
Female Fertility in Rochester
Fertility by Age in Rochester
Average fertility rate in Rochester is 22.0 births per 1,000 women. Women in the age bracket of 20 to 34 years have the highest fertility rate with 51.0 births per 1,000 women. Women in the age bracket of 20 to 34 years acount for 100.0% of all women with births.
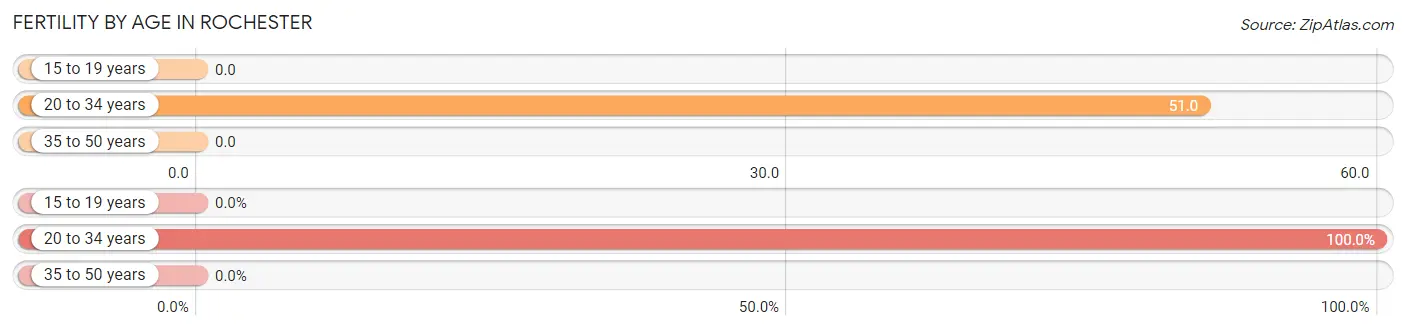
| Age Bracket | Women with Births | Births / 1,000 Women |
| 15 to 19 years | 0 (0.0%) | 0.0 |
| 20 to 34 years | 35 (100.0%) | 51.0 |
| 35 to 50 years | 0 (0.0%) | 0.0 |
| Total | 35 (100.0%) | 22.0 |
Fertility by Age by Marriage Status in Rochester
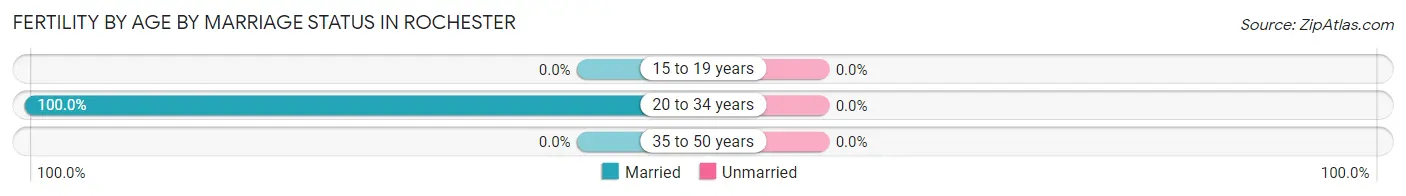
| Age Bracket | Married | Unmarried |
| 15 to 19 years | 0 (0.0%) | 0 (0.0%) |
| 20 to 34 years | 35 (100.0%) | 0 (0.0%) |
| 35 to 50 years | 0 (0.0%) | 0 (0.0%) |
| Total | 35 (100.0%) | 0 (0.0%) |
Fertility by Education in Rochester
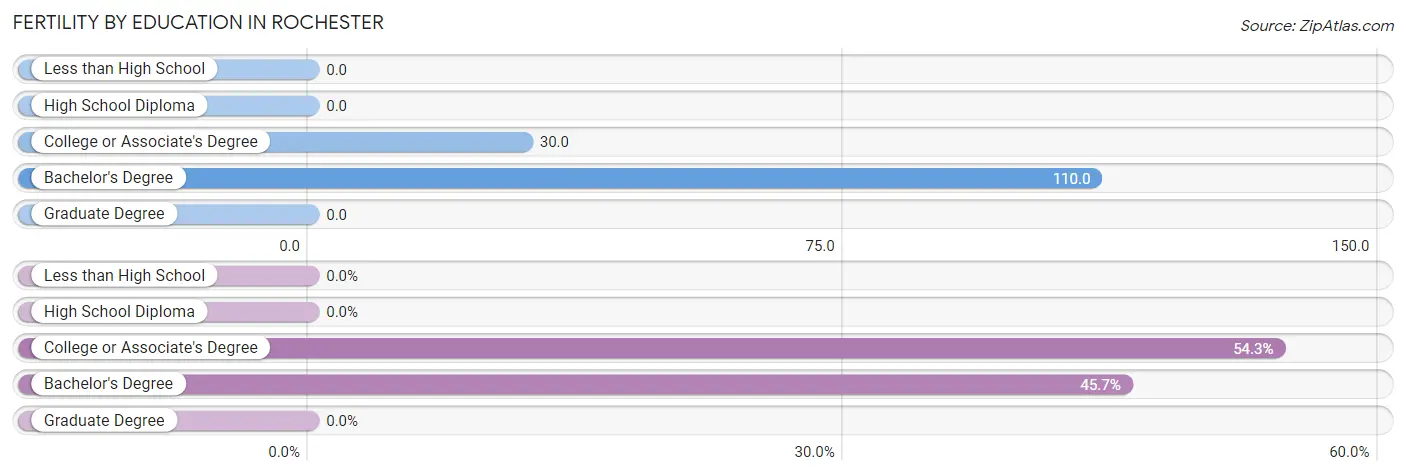
| Educational Attainment | Women with Births | Births / 1,000 Women |
| Less than High School | 0 (0.0%) | 0.0 |
| High School Diploma | 0 (0.0%) | 0.0 |
| College or Associate's Degree | 19 (54.3%) | 30.0 |
| Bachelor's Degree | 16 (45.7%) | 110.0 |
| Graduate Degree | 0 (0.0%) | 0.0 |
| Total | 35 (100.0%) | 22.0 |
Fertility by Education by Marriage Status in Rochester
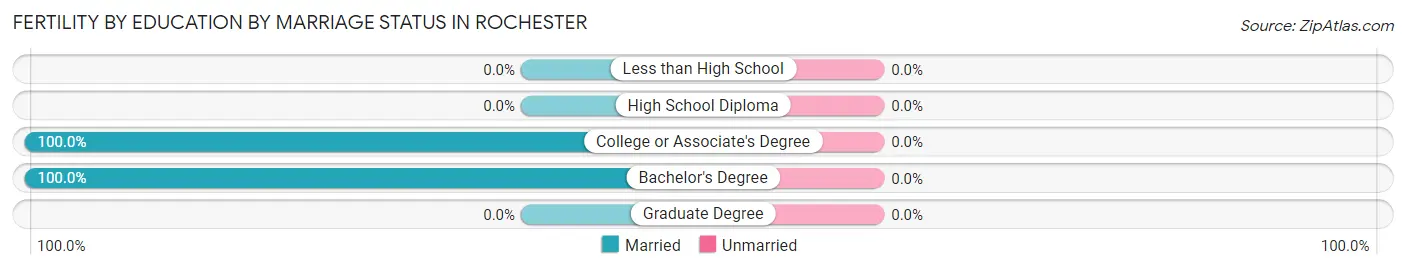
| Educational Attainment | Married | Unmarried |
| Less than High School | 0 (0.0%) | 0 (0.0%) |
| High School Diploma | 0 (0.0%) | 0 (0.0%) |
| College or Associate's Degree | 19 (100.0%) | 0 (0.0%) |
| Bachelor's Degree | 16 (100.0%) | 0 (0.0%) |
| Graduate Degree | 0 (0.0%) | 0 (0.0%) |
| Total | 35 (100.0%) | 0 (0.0%) |
Employment Characteristics in Rochester
Employment by Class of Employer in Rochester
Among the 2,871 employed individuals in Rochester, private company employees (1,733 | 60.4%), state government employees (561 | 19.5%), and local government employees (198 | 6.9%) make up the most common classes of employment.
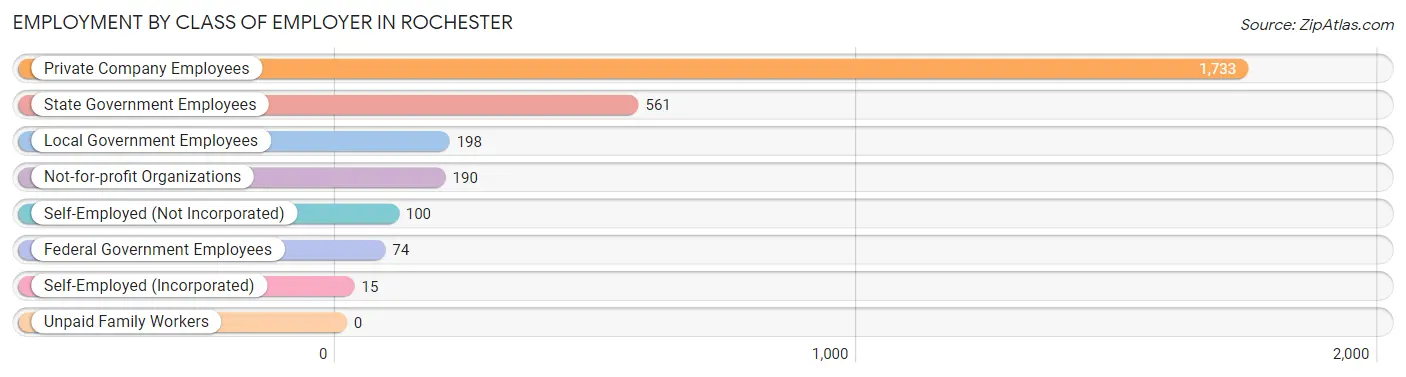
| Employer Class | # Employees | % Employees |
| Private Company Employees | 1,733 | 60.4% |
| Self-Employed (Incorporated) | 15 | 0.5% |
| Self-Employed (Not Incorporated) | 100 | 3.5% |
| Not-for-profit Organizations | 190 | 6.6% |
| Local Government Employees | 198 | 6.9% |
| State Government Employees | 561 | 19.5% |
| Federal Government Employees | 74 | 2.6% |
| Unpaid Family Workers | 0 | 0.0% |
| Total | 2,871 | 100.0% |
Employment Status by Age in Rochester
According to the labor force statistics for Rochester, out of the total population over 16 years of age (5,009), 58.6% or 2,935 individuals are in the labor force, with 0.4% or 12 of them unemployed. The age group with the highest labor force participation rate is 20 to 24 years, with 100.0% or 313 individuals in the labor force. Within the labor force, the 75 years and over age range has the highest percentage of unemployed individuals, with 27.5% or 11 of them being unemployed.
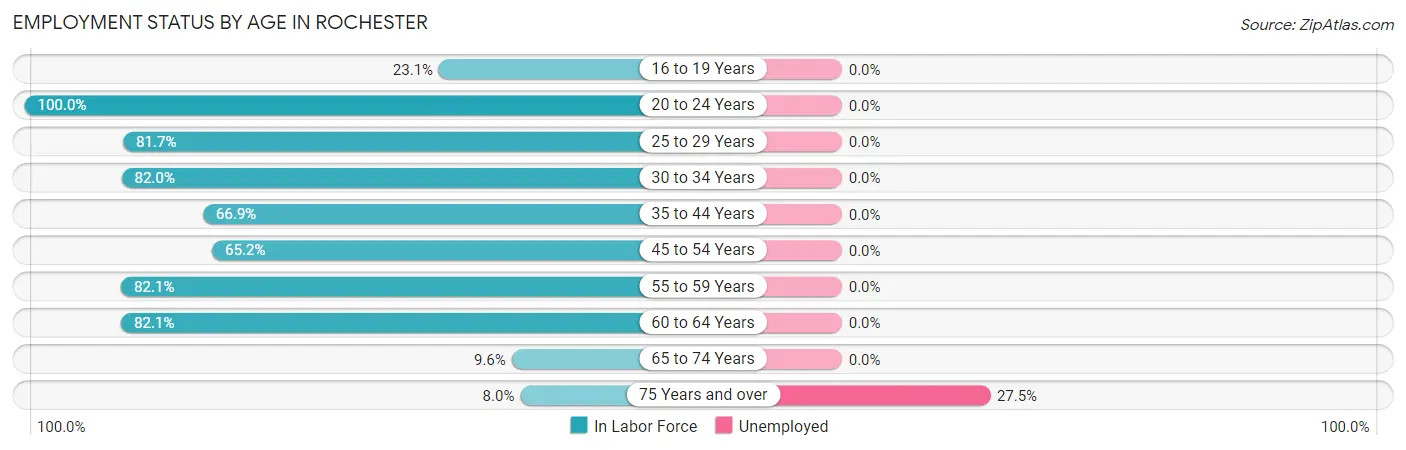
| Age Bracket | In Labor Force | Unemployed |
| 16 to 19 Years | 71 (23.1%) | 0 (0.0%) |
| 20 to 24 Years | 313 (100.0%) | 0 (0.0%) |
| 25 to 29 Years | 376 (81.7%) | 0 (0.0%) |
| 30 to 34 Years | 269 (82.0%) | 0 (0.0%) |
| 35 to 44 Years | 402 (66.9%) | 0 (0.0%) |
| 45 to 54 Years | 823 (65.2%) | 0 (0.0%) |
| 55 to 59 Years | 303 (82.1%) | 0 (0.0%) |
| 60 to 64 Years | 289 (82.1%) | 0 (0.0%) |
| 65 to 74 Years | 49 (9.6%) | 0 (0.0%) |
| 75 Years and over | 40 (8.0%) | 11 (27.5%) |
| Total | 2,935 (58.6%) | 12 (0.4%) |
Employment Status by Educational Attainment in Rochester
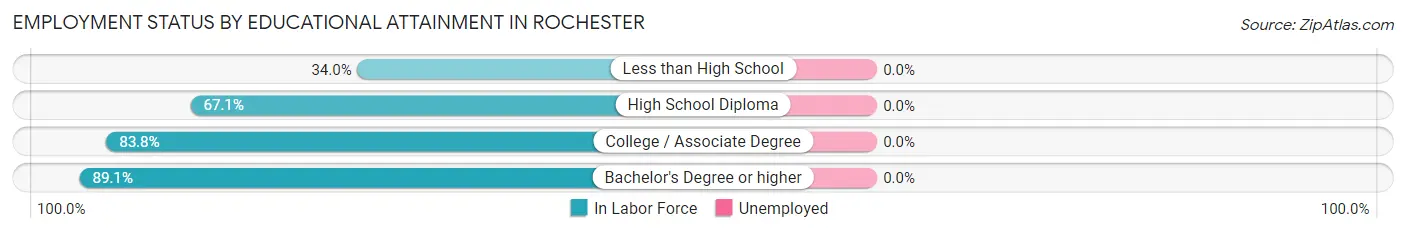
| Educational Attainment | In Labor Force | Unemployed |
| Less than High School | 139 (34.0%) | 0 (0.0%) |
| High School Diploma | 754 (67.1%) | 0 (0.0%) |
| College / Associate Degree | 1,110 (83.8%) | 0 (0.0%) |
| Bachelor's Degree or higher | 460 (89.1%) | 0 (0.0%) |
| Total | 2,462 (73.0%) | 0 (0.0%) |
Employment Occupations by Sex in Rochester
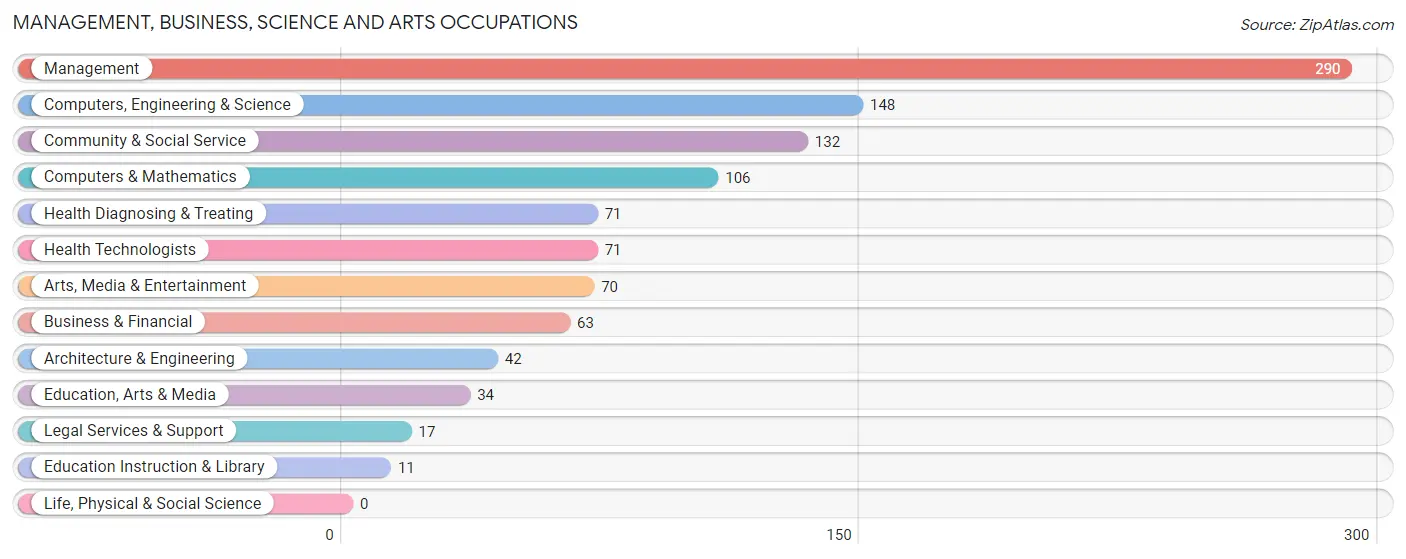
Management, Business, Science and Arts Occupations
The most common Management, Business, Science and Arts occupations in Rochester are Management (290 | 9.9%), Computers, Engineering & Science (148 | 5.1%), Community & Social Service (132 | 4.5%), Computers & Mathematics (106 | 3.6%), and Health Diagnosing & Treating (71 | 2.4%).
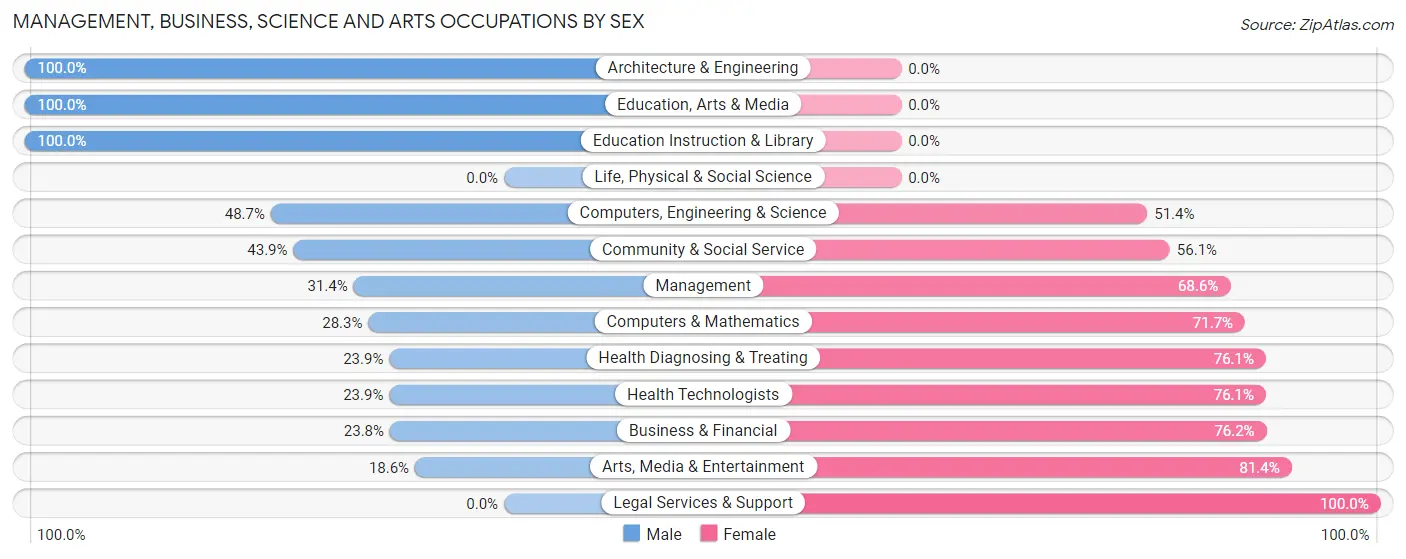
Management, Business, Science and Arts Occupations by Sex
Within the Management, Business, Science and Arts occupations in Rochester, the most male-oriented occupations are Architecture & Engineering (100.0%), Education, Arts & Media (100.0%), and Education Instruction & Library (100.0%), while the most female-oriented occupations are Legal Services & Support (100.0%), Arts, Media & Entertainment (81.4%), and Business & Financial (76.2%).
| Occupation | Male | Female |
| Management | 91 (31.4%) | 199 (68.6%) |
| Business & Financial | 15 (23.8%) | 48 (76.2%) |
| Computers, Engineering & Science | 72 (48.6%) | 76 (51.3%) |
| Computers & Mathematics | 30 (28.3%) | 76 (71.7%) |
| Architecture & Engineering | 42 (100.0%) | 0 (0.0%) |
| Life, Physical & Social Science | 0 (0.0%) | 0 (0.0%) |
| Community & Social Service | 58 (43.9%) | 74 (56.1%) |
| Education, Arts & Media | 34 (100.0%) | 0 (0.0%) |
| Legal Services & Support | 0 (0.0%) | 17 (100.0%) |
| Education Instruction & Library | 11 (100.0%) | 0 (0.0%) |
| Arts, Media & Entertainment | 13 (18.6%) | 57 (81.4%) |
| Health Diagnosing & Treating | 17 (23.9%) | 54 (76.1%) |
| Health Technologists | 17 (23.9%) | 54 (76.1%) |
| Total (Category) | 253 (35.9%) | 451 (64.1%) |
| Total (Overall) | 1,452 (49.7%) | 1,472 (50.3%) |
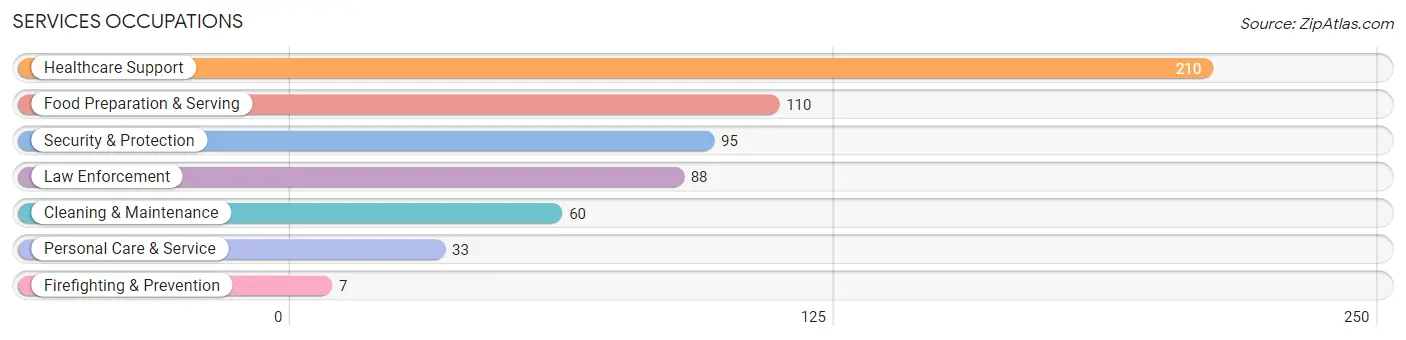
Services Occupations
The most common Services occupations in Rochester are Healthcare Support (210 | 7.2%), Food Preparation & Serving (110 | 3.8%), Security & Protection (95 | 3.3%), Law Enforcement (88 | 3.0%), and Cleaning & Maintenance (60 | 2.1%).
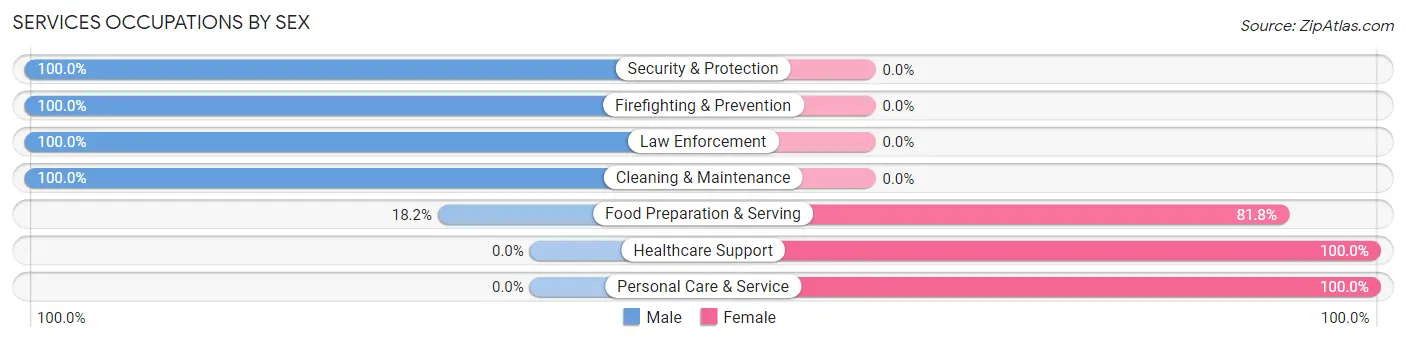
Services Occupations by Sex
Within the Services occupations in Rochester, the most male-oriented occupations are Security & Protection (100.0%), Firefighting & Prevention (100.0%), and Law Enforcement (100.0%), while the most female-oriented occupations are Healthcare Support (100.0%), Personal Care & Service (100.0%), and Food Preparation & Serving (81.8%).
| Occupation | Male | Female |
| Healthcare Support | 0 (0.0%) | 210 (100.0%) |
| Security & Protection | 95 (100.0%) | 0 (0.0%) |
| Firefighting & Prevention | 7 (100.0%) | 0 (0.0%) |
| Law Enforcement | 88 (100.0%) | 0 (0.0%) |
| Food Preparation & Serving | 20 (18.2%) | 90 (81.8%) |
| Cleaning & Maintenance | 60 (100.0%) | 0 (0.0%) |
| Personal Care & Service | 0 (0.0%) | 33 (100.0%) |
| Total (Category) | 175 (34.4%) | 333 (65.5%) |
| Total (Overall) | 1,452 (49.7%) | 1,472 (50.3%) |
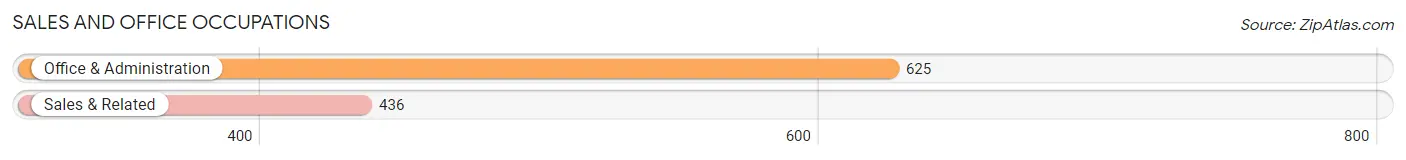
Sales and Office Occupations
The most common Sales and Office occupations in Rochester are Office & Administration (625 | 21.4%), and Sales & Related (436 | 14.9%).
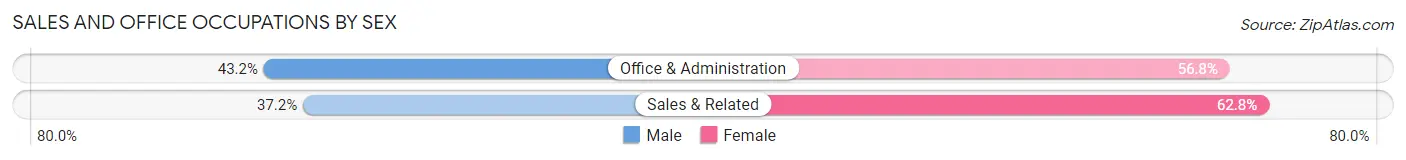
Sales and Office Occupations by Sex
| Occupation | Male | Female |
| Sales & Related | 162 (37.2%) | 274 (62.8%) |
| Office & Administration | 270 (43.2%) | 355 (56.8%) |
| Total (Category) | 432 (40.7%) | 629 (59.3%) |
| Total (Overall) | 1,452 (49.7%) | 1,472 (50.3%) |
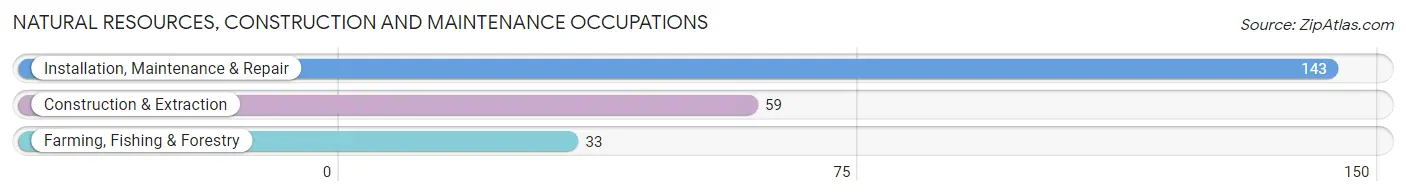
Natural Resources, Construction and Maintenance Occupations
The most common Natural Resources, Construction and Maintenance occupations in Rochester are Installation, Maintenance & Repair (143 | 4.9%), Construction & Extraction (59 | 2.0%), and Farming, Fishing & Forestry (33 | 1.1%).
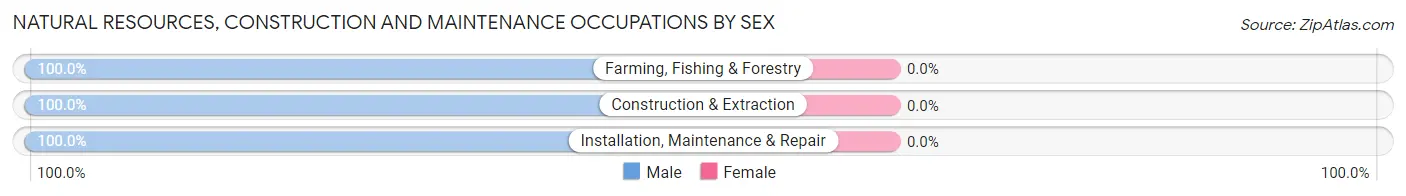
Natural Resources, Construction and Maintenance Occupations by Sex
| Occupation | Male | Female |
| Farming, Fishing & Forestry | 33 (100.0%) | 0 (0.0%) |
| Construction & Extraction | 59 (100.0%) | 0 (0.0%) |
| Installation, Maintenance & Repair | 143 (100.0%) | 0 (0.0%) |
| Total (Category) | 235 (100.0%) | 0 (0.0%) |
| Total (Overall) | 1,452 (49.7%) | 1,472 (50.3%) |
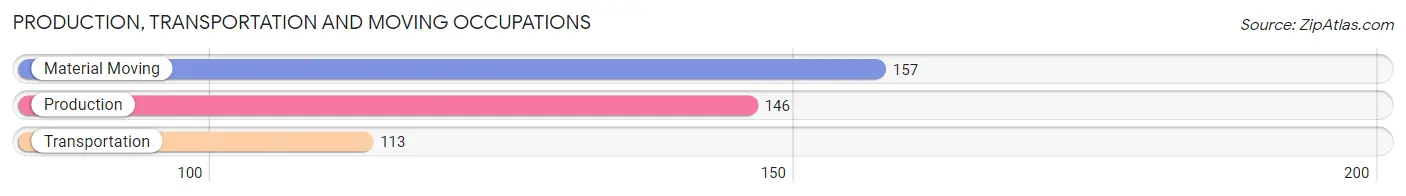
Production, Transportation and Moving Occupations
The most common Production, Transportation and Moving occupations in Rochester are Material Moving (157 | 5.4%), Production (146 | 5.0%), and Transportation (113 | 3.9%).
Production, Transportation and Moving Occupations by Sex
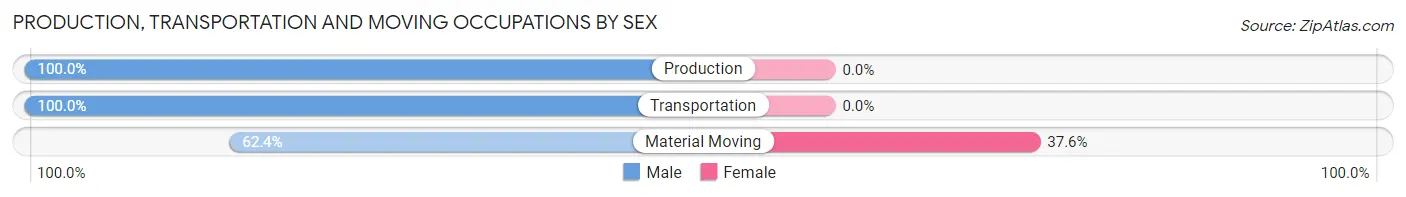
| Occupation | Male | Female |
| Production | 146 (100.0%) | 0 (0.0%) |
| Transportation | 113 (100.0%) | 0 (0.0%) |
| Material Moving | 98 (62.4%) | 59 (37.6%) |
| Total (Category) | 357 (85.8%) | 59 (14.2%) |
| Total (Overall) | 1,452 (49.7%) | 1,472 (50.3%) |
Employment Industries by Sex in Rochester
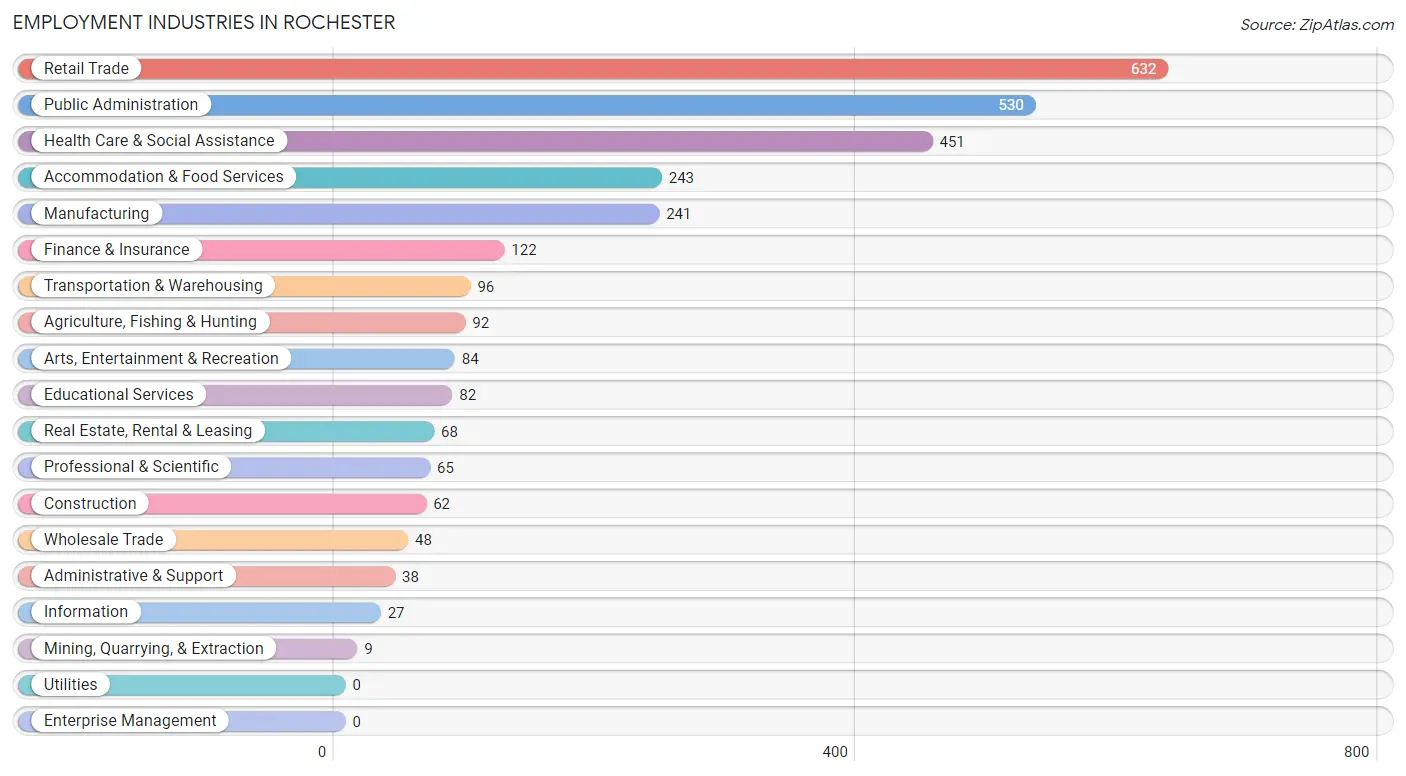
Employment Industries in Rochester
The major employment industries in Rochester include Retail Trade (632 | 21.6%), Public Administration (530 | 18.1%), Health Care & Social Assistance (451 | 15.4%), Accommodation & Food Services (243 | 8.3%), and Manufacturing (241 | 8.2%).
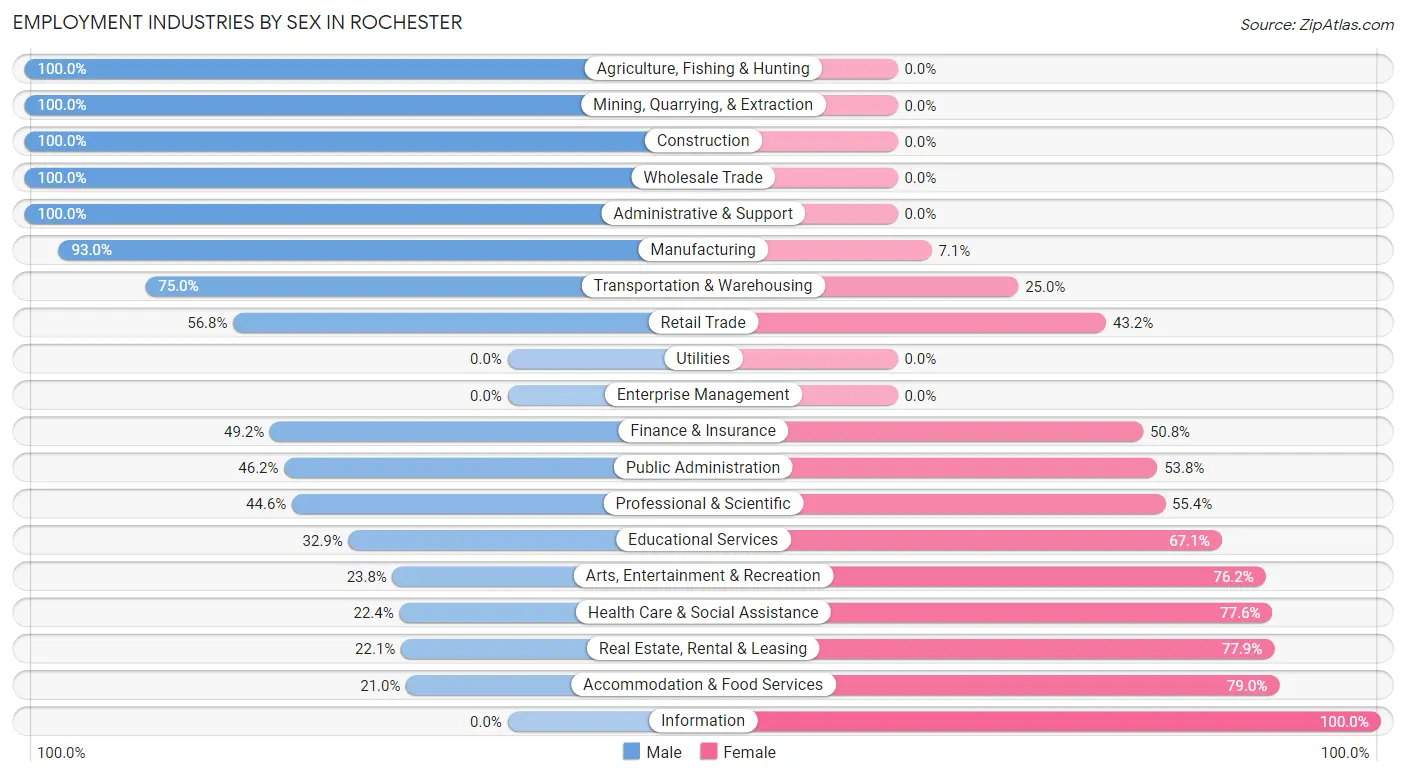
Employment Industries by Sex in Rochester
The Rochester industries that see more men than women are Agriculture, Fishing & Hunting (100.0%), Mining, Quarrying, & Extraction (100.0%), and Construction (100.0%), whereas the industries that tend to have a higher number of women are Information (100.0%), Accommodation & Food Services (79.0%), and Real Estate, Rental & Leasing (77.9%).
| Industry | Male | Female |
| Agriculture, Fishing & Hunting | 92 (100.0%) | 0 (0.0%) |
| Mining, Quarrying, & Extraction | 9 (100.0%) | 0 (0.0%) |
| Construction | 62 (100.0%) | 0 (0.0%) |
| Manufacturing | 224 (92.9%) | 17 (7.0%) |
| Wholesale Trade | 48 (100.0%) | 0 (0.0%) |
| Retail Trade | 359 (56.8%) | 273 (43.2%) |
| Transportation & Warehousing | 72 (75.0%) | 24 (25.0%) |
| Utilities | 0 (0.0%) | 0 (0.0%) |
| Information | 0 (0.0%) | 27 (100.0%) |
| Finance & Insurance | 60 (49.2%) | 62 (50.8%) |
| Real Estate, Rental & Leasing | 15 (22.1%) | 53 (77.9%) |
| Professional & Scientific | 29 (44.6%) | 36 (55.4%) |
| Enterprise Management | 0 (0.0%) | 0 (0.0%) |
| Administrative & Support | 38 (100.0%) | 0 (0.0%) |
| Educational Services | 27 (32.9%) | 55 (67.1%) |
| Health Care & Social Assistance | 101 (22.4%) | 350 (77.6%) |
| Arts, Entertainment & Recreation | 20 (23.8%) | 64 (76.2%) |
| Accommodation & Food Services | 51 (21.0%) | 192 (79.0%) |
| Public Administration | 245 (46.2%) | 285 (53.8%) |
| Total | 1,452 (49.7%) | 1,472 (50.3%) |
Education in Rochester
School Enrollment in Rochester
The most common levels of schooling among the 985 students in Rochester are high school (329 | 33.4%), middle school (222 | 22.5%), and nursery / preschool (176 | 17.9%).
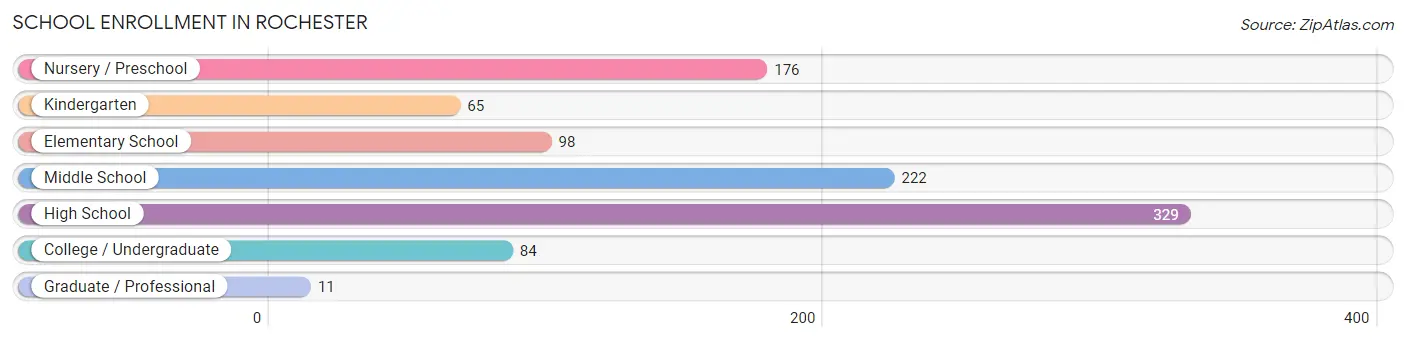
| School Level | # Students | % Students |
| Nursery / Preschool | 176 | 17.9% |
| Kindergarten | 65 | 6.6% |
| Elementary School | 98 | 10.0% |
| Middle School | 222 | 22.5% |
| High School | 329 | 33.4% |
| College / Undergraduate | 84 | 8.5% |
| Graduate / Professional | 11 | 1.1% |
| Total | 985 | 100.0% |
School Enrollment by Age by Funding Source in Rochester
Out of a total of 985 students who are enrolled in schools in Rochester, 216 (21.9%) attend a private institution, while the remaining 769 (78.1%) are enrolled in public schools. The age group of 3 to 4 year olds has the highest likelihood of being enrolled in private schools, with 102 (100.0% in the age bracket) enrolled. Conversely, the age group of 15 to 17 year olds has the lowest likelihood of being enrolled in a private school, with 156 (100.0% in the age bracket) attending a public institution.
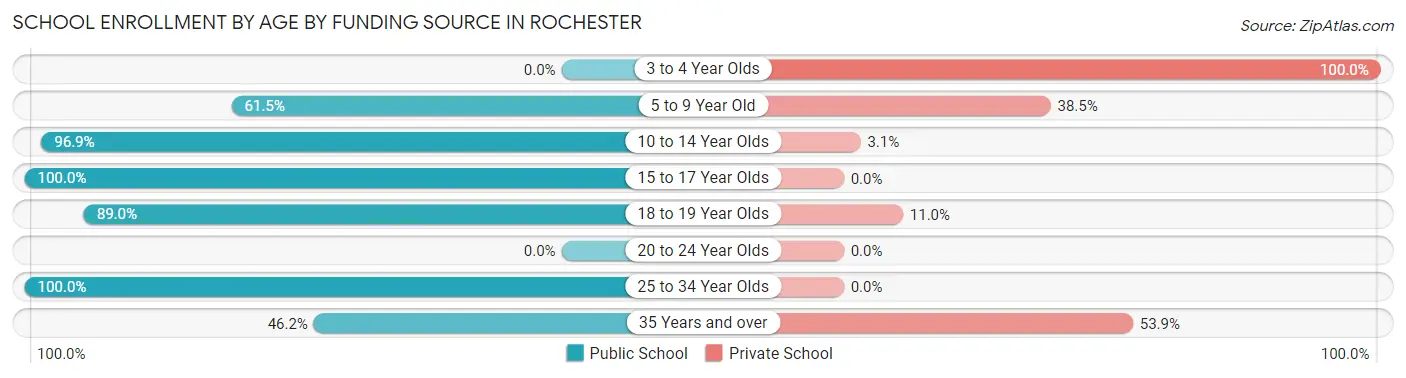
| Age Bracket | Public School | Private School |
| 3 to 4 Year Olds | 0 (0.0%) | 102 (100.0%) |
| 5 to 9 Year Old | 118 (61.5%) | 74 (38.5%) |
| 10 to 14 Year Olds | 309 (96.9%) | 10 (3.1%) |
| 15 to 17 Year Olds | 156 (100.0%) | 0 (0.0%) |
| 18 to 19 Year Olds | 129 (89.0%) | 16 (11.0%) |
| 20 to 24 Year Olds | 0 (0.0%) | 0 (0.0%) |
| 25 to 34 Year Olds | 45 (100.0%) | 0 (0.0%) |
| 35 Years and over | 12 (46.2%) | 14 (53.8%) |
| Total | 769 (78.1%) | 216 (21.9%) |
Educational Attainment by Field of Study in Rochester
Business (147 | 21.8%), social sciences (139 | 20.6%), arts & humanities (110 | 16.3%), liberal arts & history (59 | 8.7%), and education (44 | 6.5%) are the most common fields of study among 674 individuals in Rochester who have obtained a bachelor's degree or higher.
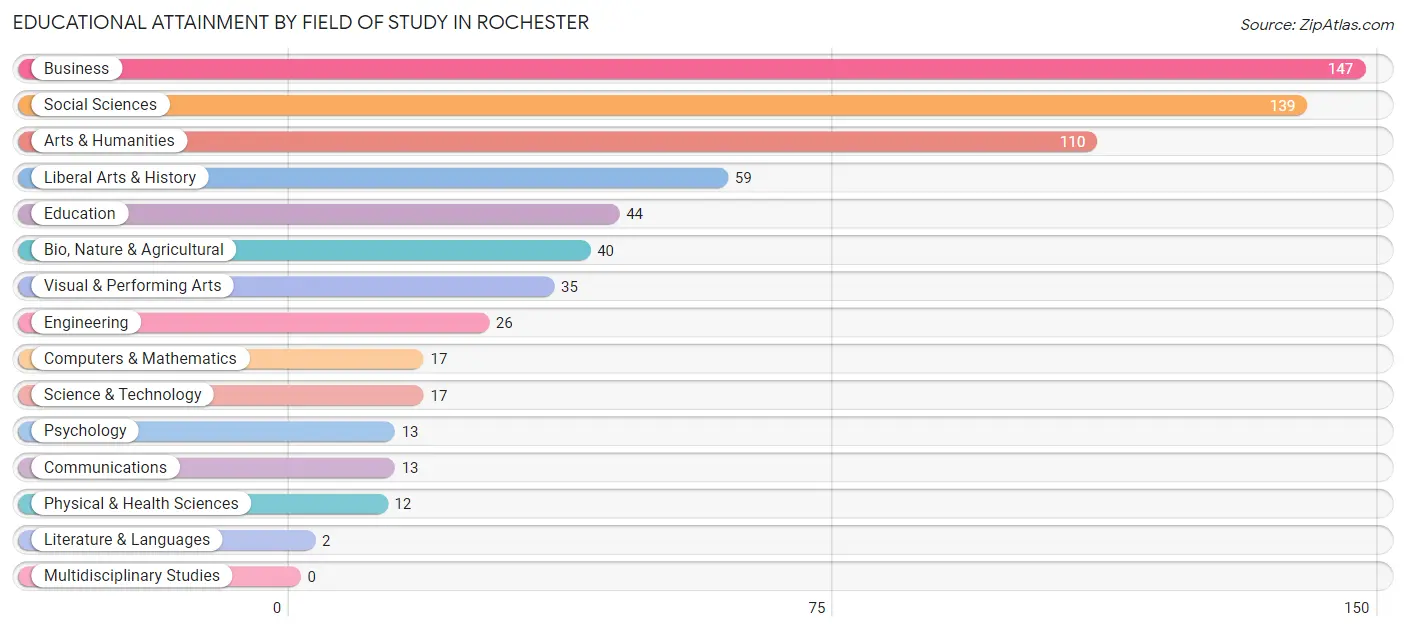
| Field of Study | # Graduates | % Graduates |
| Computers & Mathematics | 17 | 2.5% |
| Bio, Nature & Agricultural | 40 | 5.9% |
| Physical & Health Sciences | 12 | 1.8% |
| Psychology | 13 | 1.9% |
| Social Sciences | 139 | 20.6% |
| Engineering | 26 | 3.9% |
| Multidisciplinary Studies | 0 | 0.0% |
| Science & Technology | 17 | 2.5% |
| Business | 147 | 21.8% |
| Education | 44 | 6.5% |
| Literature & Languages | 2 | 0.3% |
| Liberal Arts & History | 59 | 8.7% |
| Visual & Performing Arts | 35 | 5.2% |
| Communications | 13 | 1.9% |
| Arts & Humanities | 110 | 16.3% |
| Total | 674 | 100.0% |
Transportation & Commute in Rochester
Vehicle Availability by Sex in Rochester
The most prevalent vehicle ownership categories in Rochester are males with 3 vehicles (505, accounting for 34.8%) and females with 3 vehicles (573, making up 35.6%).

| Vehicles Available | Male | Female |
| No Vehicle | 37 (2.5%) | 50 (3.5%) |
| 1 Vehicle | 130 (8.9%) | 133 (9.4%) |
| 2 Vehicles | 303 (20.9%) | 250 (17.6%) |
| 3 Vehicles | 505 (34.8%) | 573 (40.4%) |
| 4 Vehicles | 314 (21.6%) | 224 (15.8%) |
| 5 or more Vehicles | 163 (11.2%) | 189 (13.3%) |
| Total | 1,452 (100.0%) | 1,419 (100.0%) |
Commute Time in Rochester
The most frequently occuring commute durations in Rochester are 30 to 34 minutes (427 commuters, 16.3%), 20 to 24 minutes (425 commuters, 16.3%), and 45 to 59 minutes (370 commuters, 14.1%).
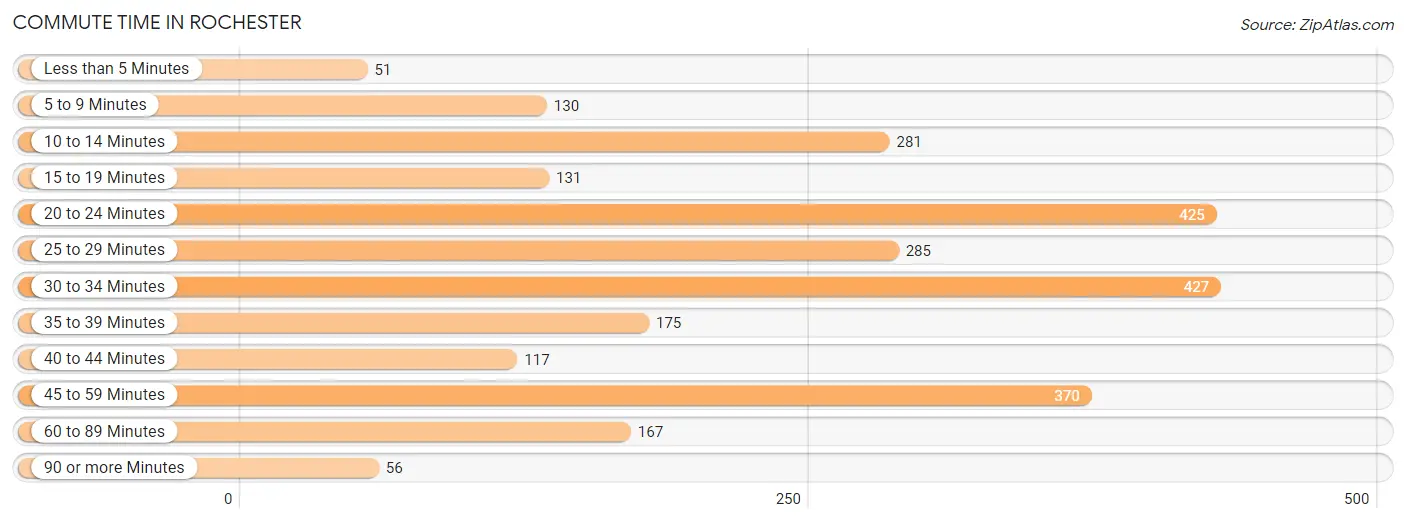
| Commute Time | # Commuters | % Commuters |
| Less than 5 Minutes | 51 | 1.9% |
| 5 to 9 Minutes | 130 | 5.0% |
| 10 to 14 Minutes | 281 | 10.7% |
| 15 to 19 Minutes | 131 | 5.0% |
| 20 to 24 Minutes | 425 | 16.3% |
| 25 to 29 Minutes | 285 | 10.9% |
| 30 to 34 Minutes | 427 | 16.3% |
| 35 to 39 Minutes | 175 | 6.7% |
| 40 to 44 Minutes | 117 | 4.5% |
| 45 to 59 Minutes | 370 | 14.1% |
| 60 to 89 Minutes | 167 | 6.4% |
| 90 or more Minutes | 56 | 2.1% |
Commute Time by Sex in Rochester
The most common commute times in Rochester are 45 to 59 minutes (302 commuters, 22.3%) for males and 20 to 24 minutes (214 commuters, 17.0%) for females.
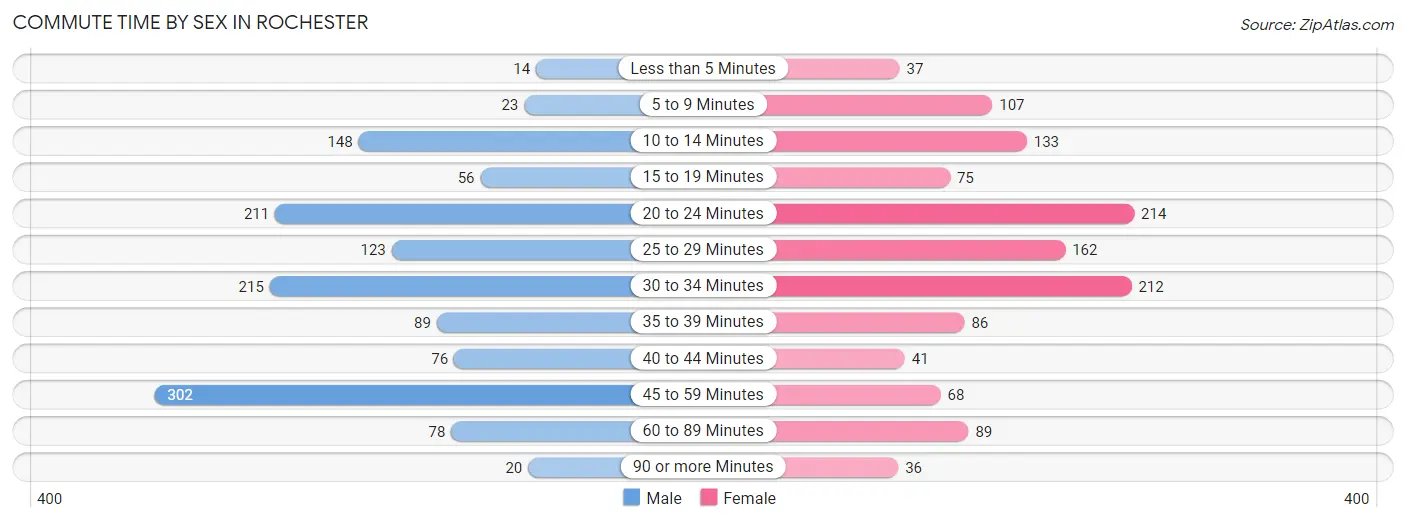
| Commute Time | Male | Female |
| Less than 5 Minutes | 14 (1.0%) | 37 (2.9%) |
| 5 to 9 Minutes | 23 (1.7%) | 107 (8.5%) |
| 10 to 14 Minutes | 148 (10.9%) | 133 (10.6%) |
| 15 to 19 Minutes | 56 (4.1%) | 75 (5.9%) |
| 20 to 24 Minutes | 211 (15.6%) | 214 (17.0%) |
| 25 to 29 Minutes | 123 (9.1%) | 162 (12.9%) |
| 30 to 34 Minutes | 215 (15.9%) | 212 (16.8%) |
| 35 to 39 Minutes | 89 (6.6%) | 86 (6.8%) |
| 40 to 44 Minutes | 76 (5.6%) | 41 (3.3%) |
| 45 to 59 Minutes | 302 (22.3%) | 68 (5.4%) |
| 60 to 89 Minutes | 78 (5.8%) | 89 (7.1%) |
| 90 or more Minutes | 20 (1.5%) | 36 (2.9%) |
Time of Departure to Work by Sex in Rochester
The most frequent times of departure to work in Rochester are 5:00 AM to 5:29 AM (365, 26.9%) for males and 7:30 AM to 7:59 AM (247, 19.6%) for females.
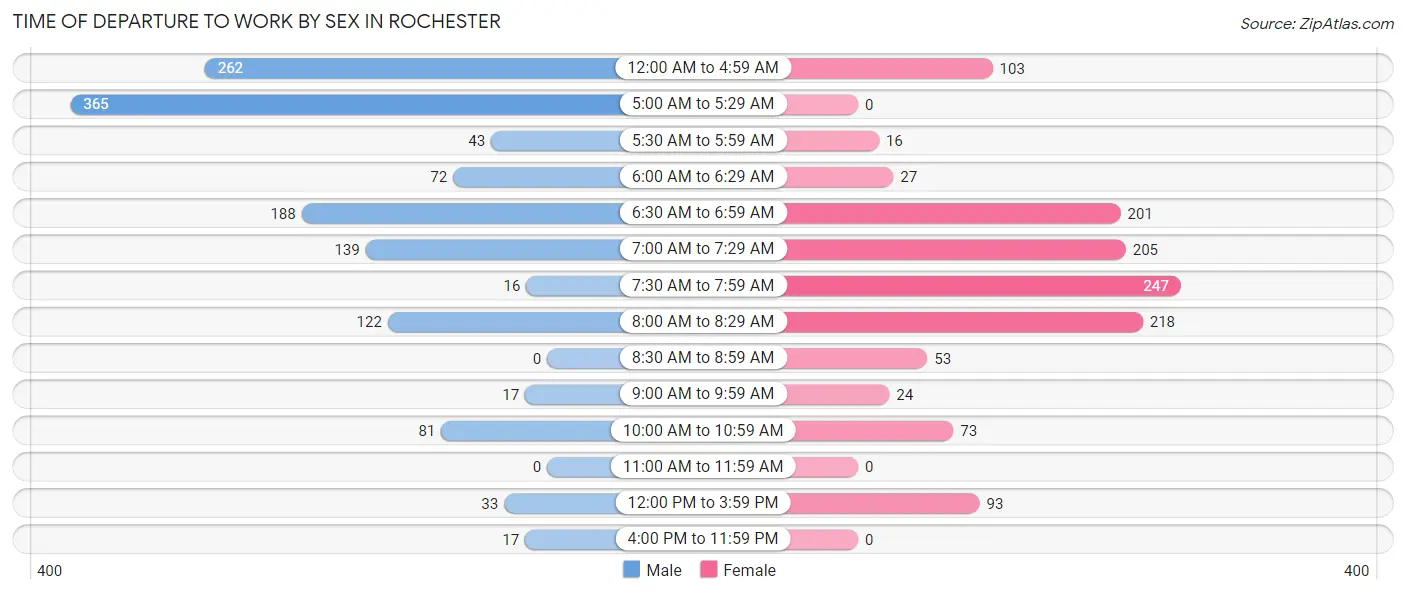
| Time of Departure | Male | Female |
| 12:00 AM to 4:59 AM | 262 (19.3%) | 103 (8.2%) |
| 5:00 AM to 5:29 AM | 365 (26.9%) | 0 (0.0%) |
| 5:30 AM to 5:59 AM | 43 (3.2%) | 16 (1.3%) |
| 6:00 AM to 6:29 AM | 72 (5.3%) | 27 (2.1%) |
| 6:30 AM to 6:59 AM | 188 (13.9%) | 201 (16.0%) |
| 7:00 AM to 7:29 AM | 139 (10.3%) | 205 (16.3%) |
| 7:30 AM to 7:59 AM | 16 (1.2%) | 247 (19.6%) |
| 8:00 AM to 8:29 AM | 122 (9.0%) | 218 (17.3%) |
| 8:30 AM to 8:59 AM | 0 (0.0%) | 53 (4.2%) |
| 9:00 AM to 9:59 AM | 17 (1.3%) | 24 (1.9%) |
| 10:00 AM to 10:59 AM | 81 (6.0%) | 73 (5.8%) |
| 11:00 AM to 11:59 AM | 0 (0.0%) | 0 (0.0%) |
| 12:00 PM to 3:59 PM | 33 (2.4%) | 93 (7.4%) |
| 4:00 PM to 11:59 PM | 17 (1.3%) | 0 (0.0%) |
| Total | 1,355 (100.0%) | 1,260 (100.0%) |
Housing Occupancy in Rochester
Occupancy by Ownership in Rochester
Of the total 2,161 dwellings in Rochester, owner-occupied units account for 1,799 (83.3%), while renter-occupied units make up 362 (16.8%).
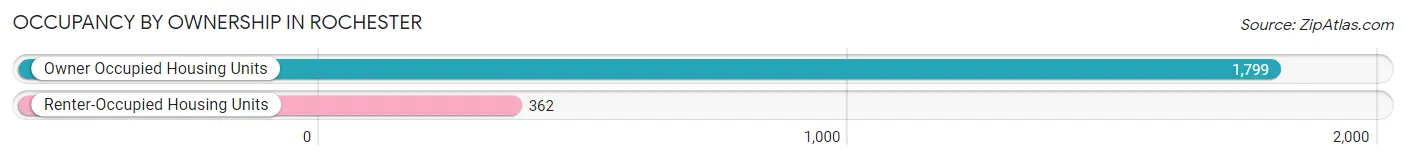
| Occupancy | # Housing Units | % Housing Units |
| Owner Occupied Housing Units | 1,799 | 83.3% |
| Renter-Occupied Housing Units | 362 | 16.8% |
| Total Occupied Housing Units | 2,161 | 100.0% |
Occupancy by Household Size in Rochester
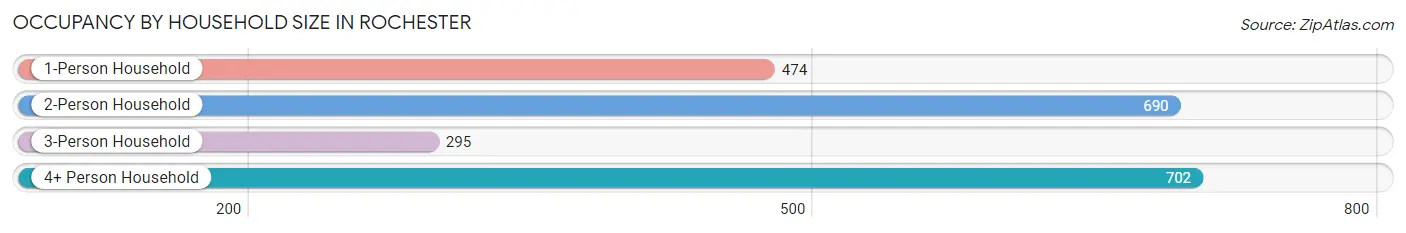
| Household Size | # Housing Units | % Housing Units |
| 1-Person Household | 474 | 21.9% |
| 2-Person Household | 690 | 31.9% |
| 3-Person Household | 295 | 13.7% |
| 4+ Person Household | 702 | 32.5% |
| Total Housing Units | 2,161 | 100.0% |
Occupancy by Ownership by Household Size in Rochester
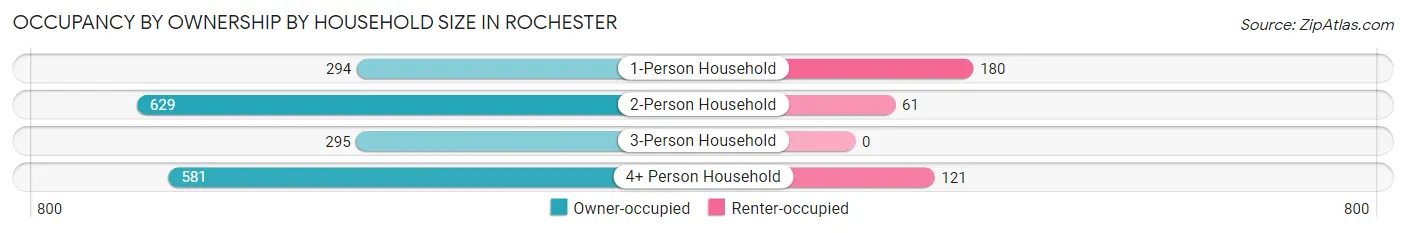
| Household Size | Owner-occupied | Renter-occupied |
| 1-Person Household | 294 (62.0%) | 180 (38.0%) |
| 2-Person Household | 629 (91.2%) | 61 (8.8%) |
| 3-Person Household | 295 (100.0%) | 0 (0.0%) |
| 4+ Person Household | 581 (82.8%) | 121 (17.2%) |
| Total Housing Units | 1,799 (83.3%) | 362 (16.8%) |
Occupancy by Educational Attainment in Rochester
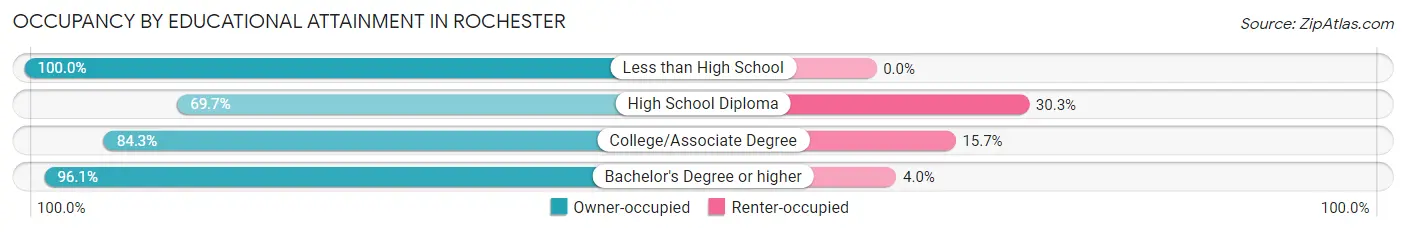
| Household Size | Owner-occupied | Renter-occupied |
| Less than High School | 125 (100.0%) | 0 (0.0%) |
| High School Diploma | 472 (69.7%) | 205 (30.3%) |
| College/Associate Degree | 740 (84.3%) | 138 (15.7%) |
| Bachelor's Degree or higher | 462 (96.1%) | 19 (4.0%) |
Occupancy by Age of Householder in Rochester
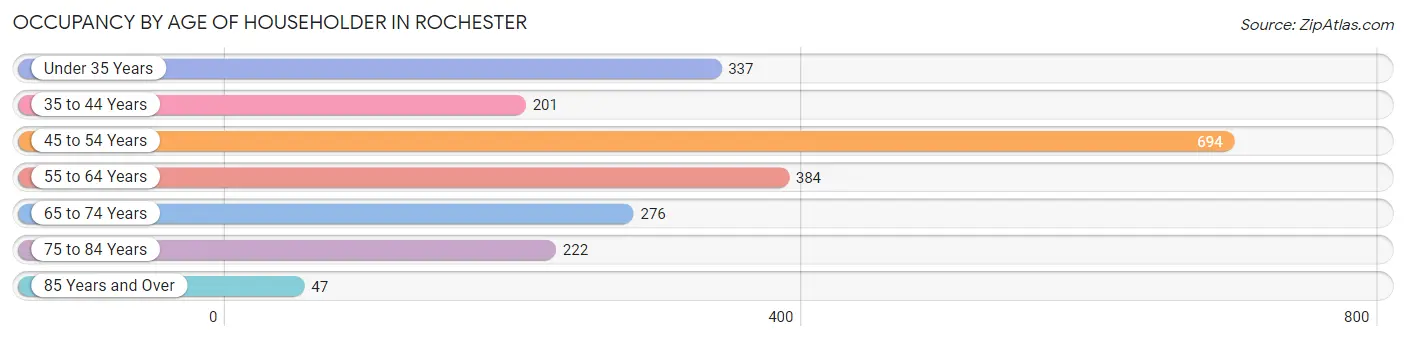
| Age Bracket | # Households | % Households |
| Under 35 Years | 337 | 15.6% |
| 35 to 44 Years | 201 | 9.3% |
| 45 to 54 Years | 694 | 32.1% |
| 55 to 64 Years | 384 | 17.8% |
| 65 to 74 Years | 276 | 12.8% |
| 75 to 84 Years | 222 | 10.3% |
| 85 Years and Over | 47 | 2.2% |
| Total | 2,161 | 100.0% |
Housing Finances in Rochester
Median Income by Occupancy in Rochester
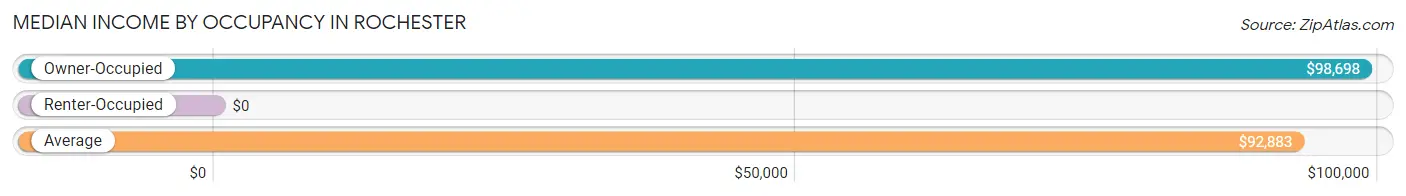
| Occupancy Type | # Households | Median Income |
| Owner-Occupied | 1,799 (83.3%) | $98,698 |
| Renter-Occupied | 362 (16.8%) | $0 |
| Average | 2,161 (100.0%) | $92,883 |
Occupancy by Householder Income Bracket in Rochester
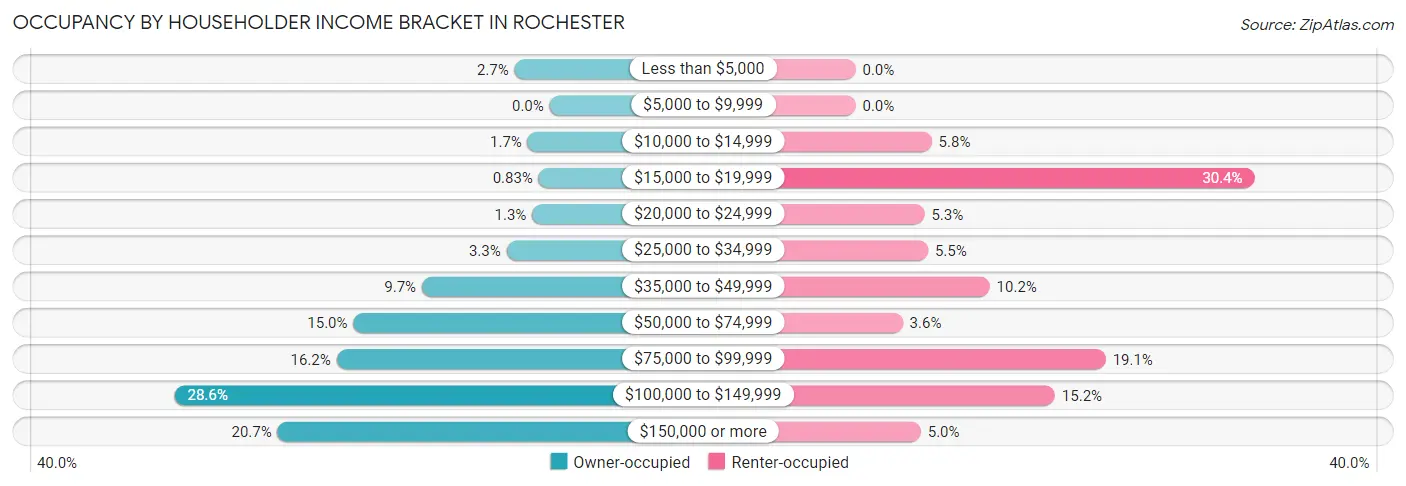
| Income Bracket | Owner-occupied | Renter-occupied |
| Less than $5,000 | 48 (2.7%) | 0 (0.0%) |
| $5,000 to $9,999 | 0 (0.0%) | 0 (0.0%) |
| $10,000 to $14,999 | 30 (1.7%) | 21 (5.8%) |
| $15,000 to $19,999 | 15 (0.8%) | 110 (30.4%) |
| $20,000 to $24,999 | 24 (1.3%) | 19 (5.2%) |
| $25,000 to $34,999 | 59 (3.3%) | 20 (5.5%) |
| $35,000 to $49,999 | 175 (9.7%) | 37 (10.2%) |
| $50,000 to $74,999 | 269 (14.9%) | 13 (3.6%) |
| $75,000 to $99,999 | 292 (16.2%) | 69 (19.1%) |
| $100,000 to $149,999 | 514 (28.6%) | 55 (15.2%) |
| $150,000 or more | 373 (20.7%) | 18 (5.0%) |
| Total | 1,799 (100.0%) | 362 (100.0%) |
Monthly Housing Cost Tiers in Rochester
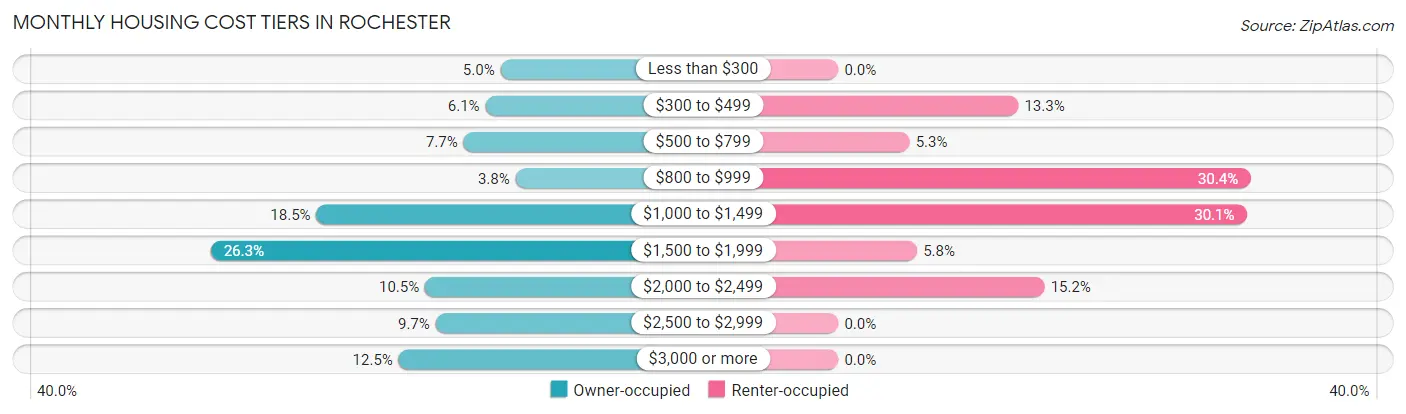
| Monthly Cost | Owner-occupied | Renter-occupied |
| Less than $300 | 89 (5.0%) | 0 (0.0%) |
| $300 to $499 | 109 (6.1%) | 48 (13.3%) |
| $500 to $799 | 138 (7.7%) | 19 (5.2%) |
| $800 to $999 | 69 (3.8%) | 110 (30.4%) |
| $1,000 to $1,499 | 333 (18.5%) | 109 (30.1%) |
| $1,500 to $1,999 | 473 (26.3%) | 21 (5.8%) |
| $2,000 to $2,499 | 189 (10.5%) | 55 (15.2%) |
| $2,500 to $2,999 | 175 (9.7%) | 0 (0.0%) |
| $3,000 or more | 224 (12.4%) | 0 (0.0%) |
| Total | 1,799 (100.0%) | 362 (100.0%) |
Physical Housing Characteristics in Rochester
Housing Structures in Rochester
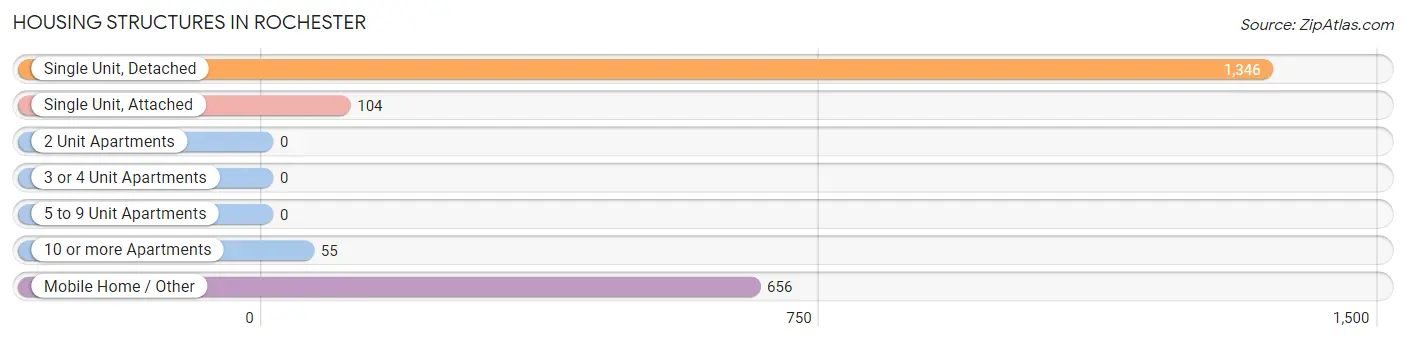
| Structure Type | # Housing Units | % Housing Units |
| Single Unit, Detached | 1,346 | 62.3% |
| Single Unit, Attached | 104 | 4.8% |
| 2 Unit Apartments | 0 | 0.0% |
| 3 or 4 Unit Apartments | 0 | 0.0% |
| 5 to 9 Unit Apartments | 0 | 0.0% |
| 10 or more Apartments | 55 | 2.5% |
| Mobile Home / Other | 656 | 30.4% |
| Total | 2,161 | 100.0% |
Housing Structures by Occupancy in Rochester
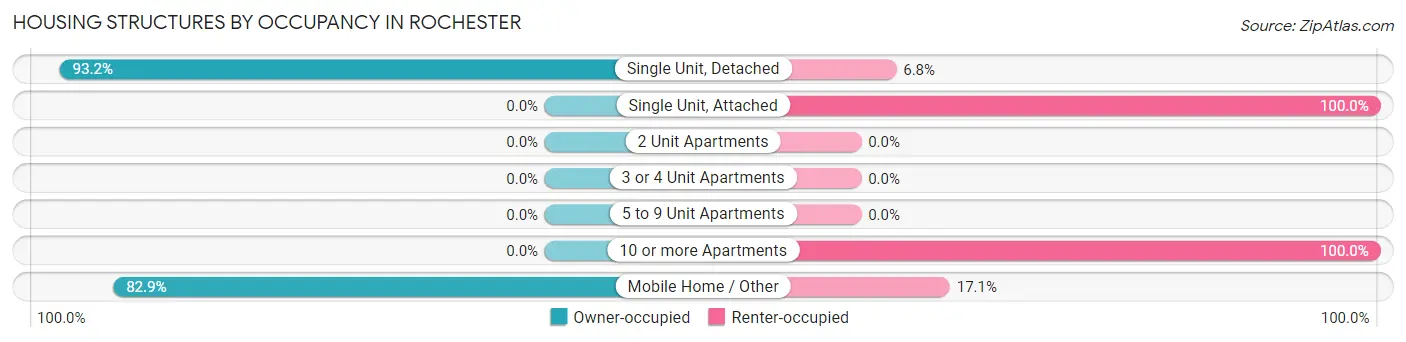
| Structure Type | Owner-occupied | Renter-occupied |
| Single Unit, Detached | 1,255 (93.2%) | 91 (6.8%) |
| Single Unit, Attached | 0 (0.0%) | 104 (100.0%) |
| 2 Unit Apartments | 0 (0.0%) | 0 (0.0%) |
| 3 or 4 Unit Apartments | 0 (0.0%) | 0 (0.0%) |
| 5 to 9 Unit Apartments | 0 (0.0%) | 0 (0.0%) |
| 10 or more Apartments | 0 (0.0%) | 55 (100.0%) |
| Mobile Home / Other | 544 (82.9%) | 112 (17.1%) |
| Total | 1,799 (83.3%) | 362 (16.8%) |
Housing Structures by Number of Rooms in Rochester
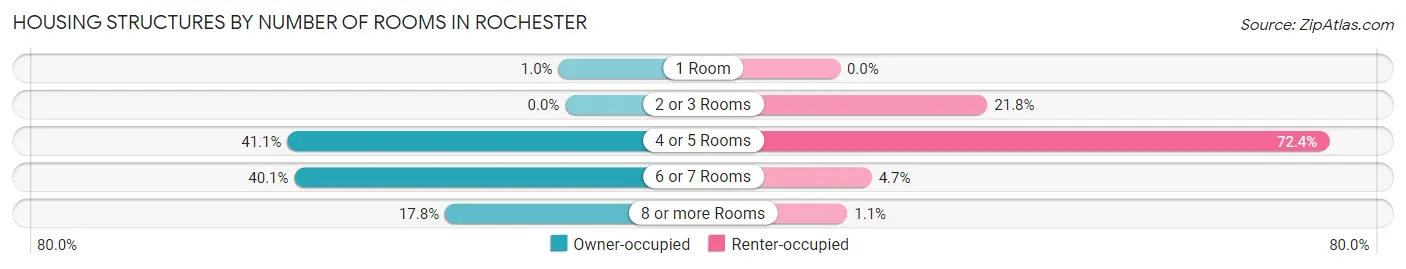
| Number of Rooms | Owner-occupied | Renter-occupied |
| 1 Room | 18 (1.0%) | 0 (0.0%) |
| 2 or 3 Rooms | 0 (0.0%) | 79 (21.8%) |
| 4 or 5 Rooms | 740 (41.1%) | 262 (72.4%) |
| 6 or 7 Rooms | 721 (40.1%) | 17 (4.7%) |
| 8 or more Rooms | 320 (17.8%) | 4 (1.1%) |
| Total | 1,799 (100.0%) | 362 (100.0%) |
Housing Structure by Heating Type in Rochester
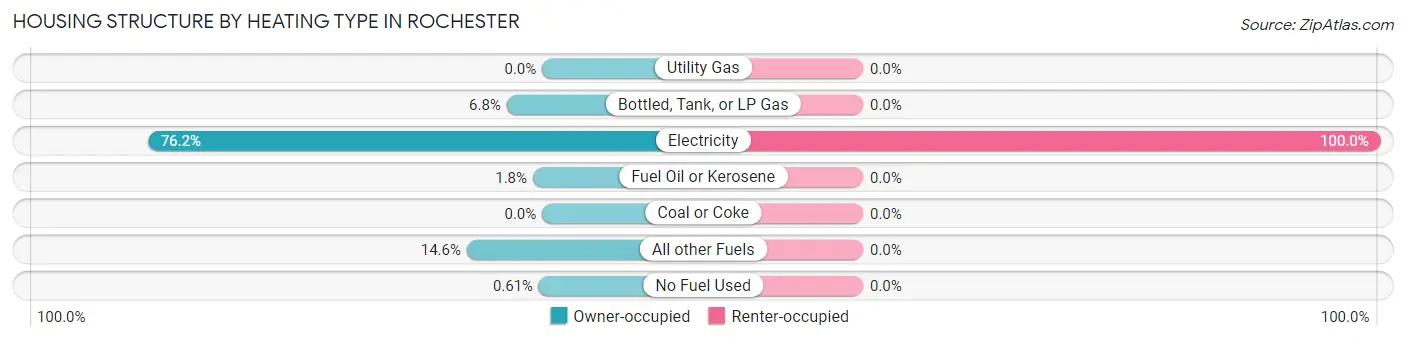
| Heating Type | Owner-occupied | Renter-occupied |
| Utility Gas | 0 (0.0%) | 0 (0.0%) |
| Bottled, Tank, or LP Gas | 123 (6.8%) | 0 (0.0%) |
| Electricity | 1,371 (76.2%) | 362 (100.0%) |
| Fuel Oil or Kerosene | 32 (1.8%) | 0 (0.0%) |
| Coal or Coke | 0 (0.0%) | 0 (0.0%) |
| All other Fuels | 262 (14.6%) | 0 (0.0%) |
| No Fuel Used | 11 (0.6%) | 0 (0.0%) |
| Total | 1,799 (100.0%) | 362 (100.0%) |
Household Vehicle Usage in Rochester
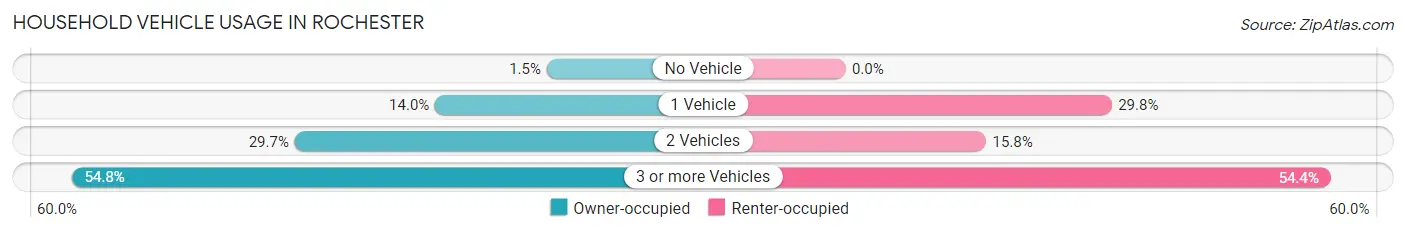
| Vehicles per Household | Owner-occupied | Renter-occupied |
| No Vehicle | 27 (1.5%) | 0 (0.0%) |
| 1 Vehicle | 252 (14.0%) | 108 (29.8%) |
| 2 Vehicles | 535 (29.7%) | 57 (15.8%) |
| 3 or more Vehicles | 985 (54.7%) | 197 (54.4%) |
| Total | 1,799 (100.0%) | 362 (100.0%) |
Real Estate & Mortgages in Rochester
Real Estate and Mortgage Overview in Rochester
| Characteristic | Without Mortgage | With Mortgage |
| Housing Units | 357 | 1,442 |
| Median Property Value | $309,700 | $362,800 |
| Median Household Income | $60,809 | $373 |
| Monthly Housing Costs | $484 | $209 |
| Real Estate Taxes | - | - |
Property Value by Mortgage Status in Rochester
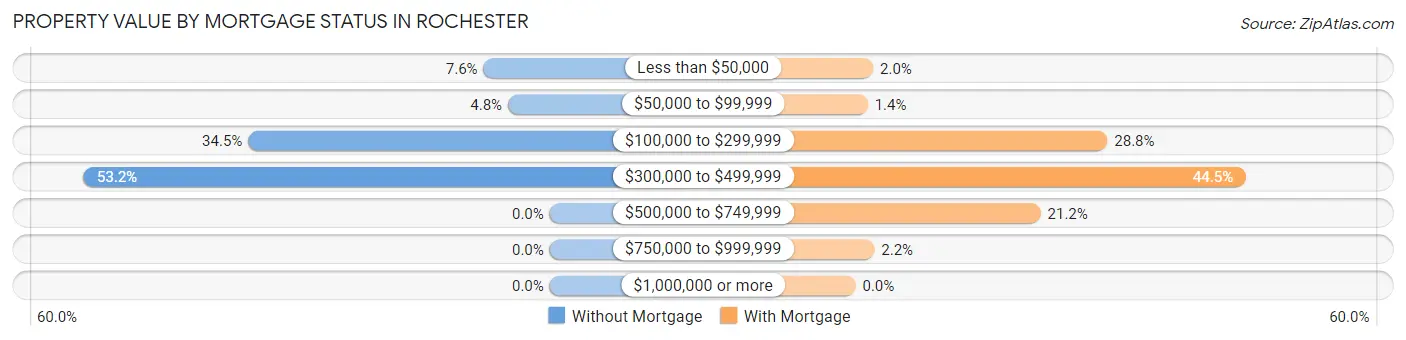
| Property Value | Without Mortgage | With Mortgage |
| Less than $50,000 | 27 (7.6%) | 29 (2.0%) |
| $50,000 to $99,999 | 17 (4.8%) | 20 (1.4%) |
| $100,000 to $299,999 | 123 (34.4%) | 415 (28.8%) |
| $300,000 to $499,999 | 190 (53.2%) | 642 (44.5%) |
| $500,000 to $749,999 | 0 (0.0%) | 305 (21.1%) |
| $750,000 to $999,999 | 0 (0.0%) | 31 (2.1%) |
| $1,000,000 or more | 0 (0.0%) | 0 (0.0%) |
| Total | 357 (100.0%) | 1,442 (100.0%) |
Household Income by Mortgage Status in Rochester
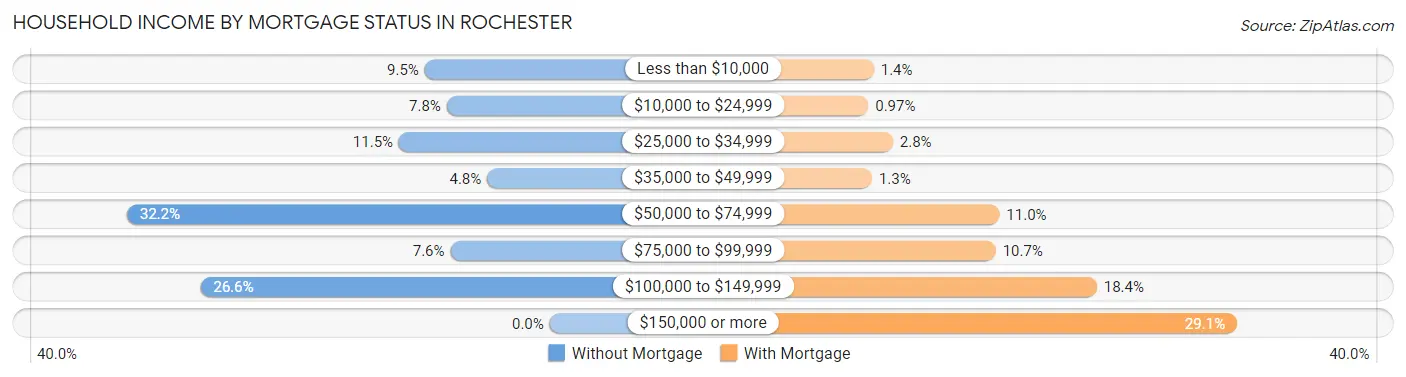
| Household Income | Without Mortgage | With Mortgage |
| Less than $10,000 | 34 (9.5%) | 20 (1.4%) |
| $10,000 to $24,999 | 28 (7.8%) | 14 (1.0%) |
| $25,000 to $34,999 | 41 (11.5%) | 41 (2.8%) |
| $35,000 to $49,999 | 17 (4.8%) | 18 (1.3%) |
| $50,000 to $74,999 | 115 (32.2%) | 158 (11.0%) |
| $75,000 to $99,999 | 27 (7.6%) | 154 (10.7%) |
| $100,000 to $149,999 | 95 (26.6%) | 265 (18.4%) |
| $150,000 or more | 0 (0.0%) | 419 (29.1%) |
| Total | 357 (100.0%) | 1,442 (100.0%) |
Property Value to Household Income Ratio in Rochester
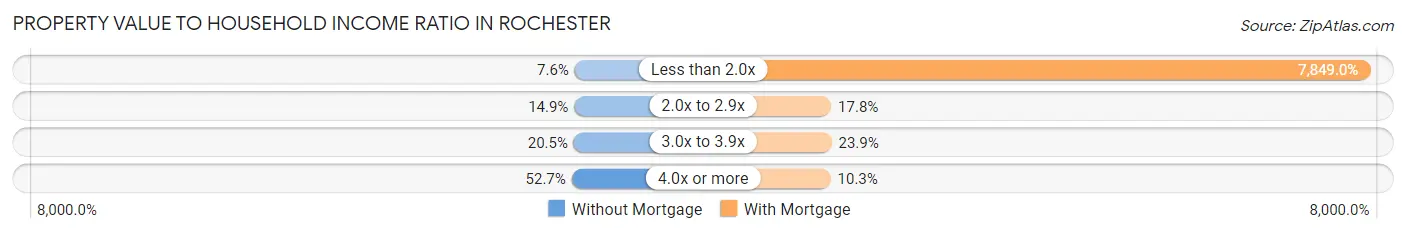
| Value-to-Income Ratio | Without Mortgage | With Mortgage |
| Less than 2.0x | 27 (7.6%) | 113,182 (7,849.0%) |
| 2.0x to 2.9x | 53 (14.8%) | 257 (17.8%) |
| 3.0x to 3.9x | 73 (20.4%) | 345 (23.9%) |
| 4.0x or more | 188 (52.7%) | 148 (10.3%) |
| Total | 357 (100.0%) | 1,442 (100.0%) |
Real Estate Taxes by Mortgage Status in Rochester
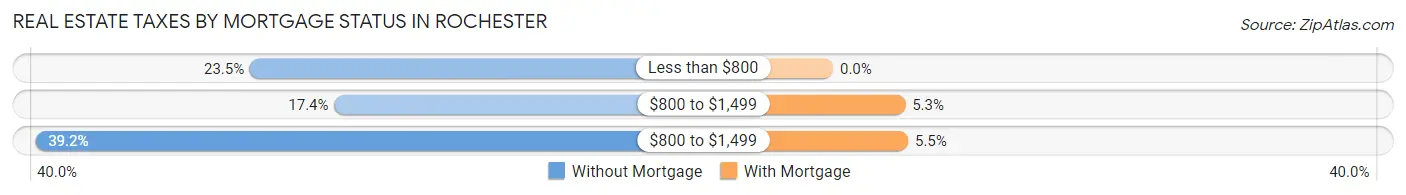
| Property Taxes | Without Mortgage | With Mortgage |
| Less than $800 | 84 (23.5%) | 0 (0.0%) |
| $800 to $1,499 | 62 (17.4%) | 76 (5.3%) |
| $800 to $1,499 | 140 (39.2%) | 79 (5.5%) |
| Total | 357 (100.0%) | 1,442 (100.0%) |
Health & Disability in Rochester
Health Insurance Coverage by Age in Rochester
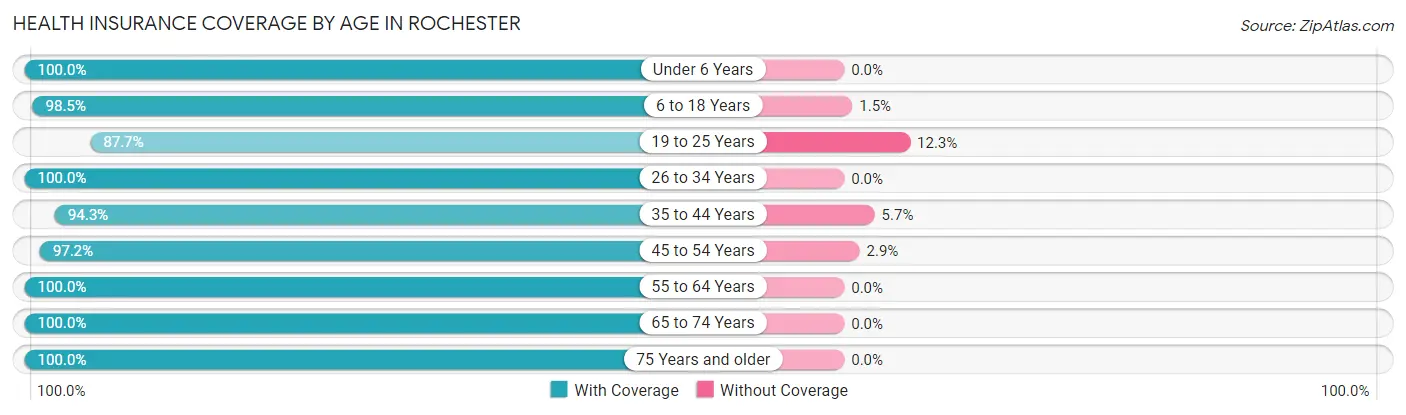
| Age Bracket | With Coverage | Without Coverage |
| Under 6 Years | 773 (100.0%) | 0 (0.0%) |
| 6 to 18 Years | 722 (98.5%) | 11 (1.5%) |
| 19 to 25 Years | 436 (87.7%) | 61 (12.3%) |
| 26 to 34 Years | 679 (100.0%) | 0 (0.0%) |
| 35 to 44 Years | 567 (94.3%) | 34 (5.7%) |
| 45 to 54 Years | 1,226 (97.2%) | 36 (2.9%) |
| 55 to 64 Years | 721 (100.0%) | 0 (0.0%) |
| 65 to 74 Years | 512 (100.0%) | 0 (0.0%) |
| 75 Years and older | 503 (100.0%) | 0 (0.0%) |
| Total | 6,139 (97.7%) | 142 (2.3%) |
Health Insurance Coverage by Citizenship Status in Rochester
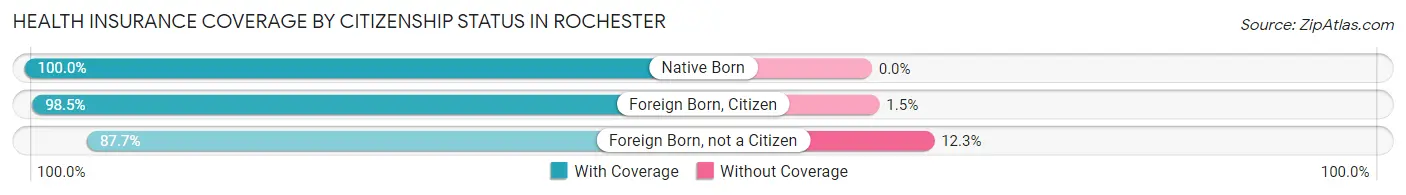
| Citizenship Status | With Coverage | Without Coverage |
| Native Born | 773 (100.0%) | 0 (0.0%) |
| Foreign Born, Citizen | 722 (98.5%) | 11 (1.5%) |
| Foreign Born, not a Citizen | 436 (87.7%) | 61 (12.3%) |
Health Insurance Coverage by Household Income in Rochester
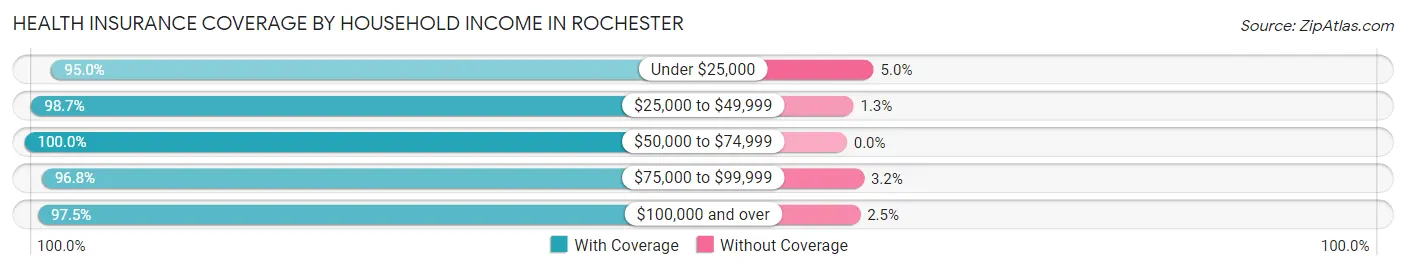
| Household Income | With Coverage | Without Coverage |
| Under $25,000 | 302 (95.0%) | 16 (5.0%) |
| $25,000 to $49,999 | 1,178 (98.7%) | 15 (1.3%) |
| $50,000 to $74,999 | 640 (100.0%) | 0 (0.0%) |
| $75,000 to $99,999 | 1,025 (96.8%) | 34 (3.2%) |
| $100,000 and over | 2,988 (97.5%) | 77 (2.5%) |
Public vs Private Health Insurance Coverage by Age in Rochester
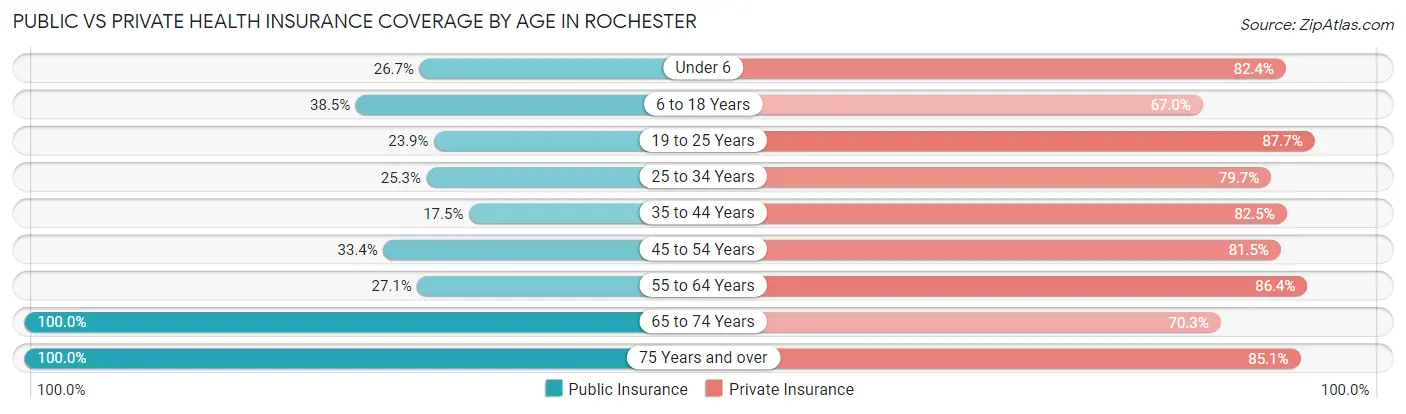
| Age Bracket | Public Insurance | Private Insurance |
| Under 6 | 206 (26.7%) | 637 (82.4%) |
| 6 to 18 Years | 282 (38.5%) | 491 (67.0%) |
| 19 to 25 Years | 119 (23.9%) | 436 (87.7%) |
| 25 to 34 Years | 172 (25.3%) | 541 (79.7%) |
| 35 to 44 Years | 105 (17.5%) | 496 (82.5%) |
| 45 to 54 Years | 421 (33.4%) | 1,028 (81.5%) |
| 55 to 64 Years | 195 (27.1%) | 623 (86.4%) |
| 65 to 74 Years | 512 (100.0%) | 360 (70.3%) |
| 75 Years and over | 503 (100.0%) | 428 (85.1%) |
| Total | 2,515 (40.0%) | 5,040 (80.2%) |
Disability Status by Sex by Age in Rochester
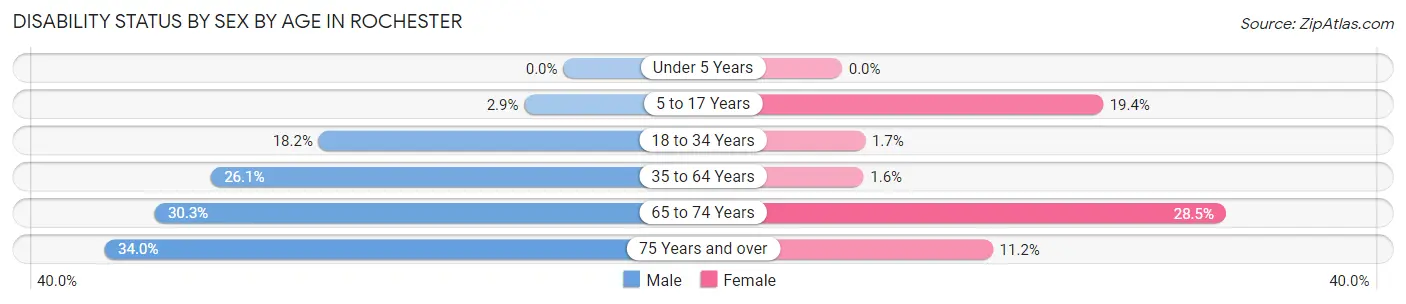
| Age Bracket | Male | Female |
| Under 5 Years | 0 (0.0%) | 0 (0.0%) |
| 5 to 17 Years | 9 (2.9%) | 80 (19.4%) |
| 18 to 34 Years | 87 (18.2%) | 14 (1.7%) |
| 35 to 64 Years | 366 (26.1%) | 19 (1.6%) |
| 65 to 74 Years | 84 (30.3%) | 67 (28.5%) |
| 75 Years and over | 83 (34.0%) | 29 (11.2%) |
Disability Class by Sex by Age in Rochester
Disability Class: Hearing Difficulty
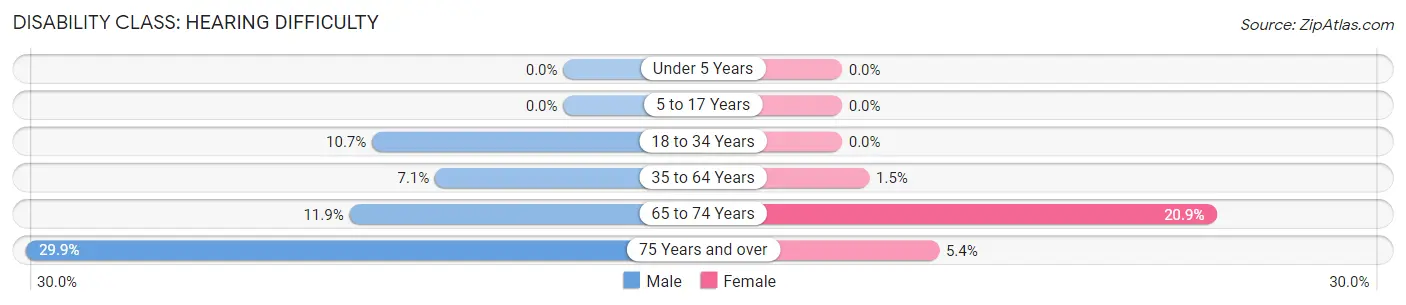
| Age Bracket | Male | Female |
| Under 5 Years | 0 (0.0%) | 0 (0.0%) |
| 5 to 17 Years | 0 (0.0%) | 0 (0.0%) |
| 18 to 34 Years | 51 (10.6%) | 0 (0.0%) |
| 35 to 64 Years | 100 (7.1%) | 18 (1.5%) |
| 65 to 74 Years | 33 (11.9%) | 49 (20.8%) |
| 75 Years and over | 73 (29.9%) | 14 (5.4%) |
Disability Class: Vision Difficulty
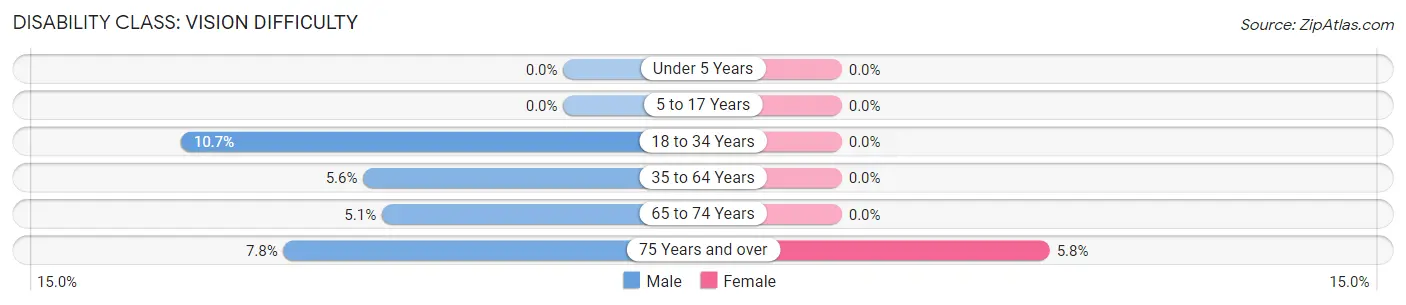
| Age Bracket | Male | Female |
| Under 5 Years | 0 (0.0%) | 0 (0.0%) |
| 5 to 17 Years | 0 (0.0%) | 0 (0.0%) |
| 18 to 34 Years | 51 (10.6%) | 0 (0.0%) |
| 35 to 64 Years | 78 (5.6%) | 0 (0.0%) |
| 65 to 74 Years | 14 (5.1%) | 0 (0.0%) |
| 75 Years and over | 19 (7.8%) | 15 (5.8%) |
Disability Class: Cognitive Difficulty
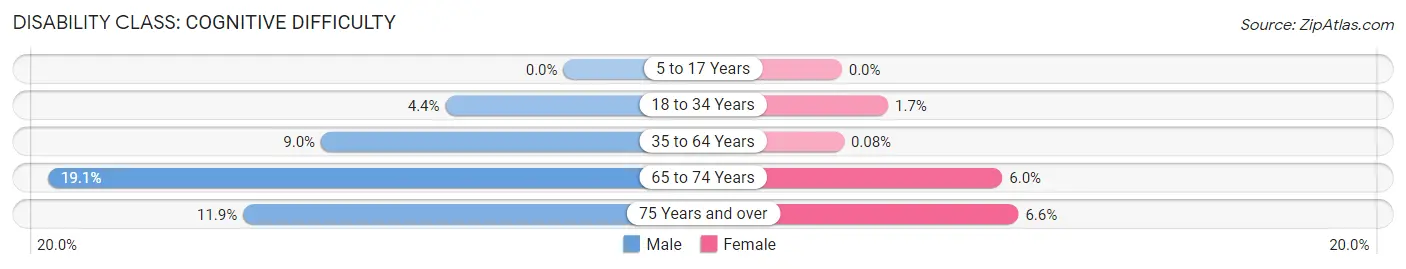
| Age Bracket | Male | Female |
| 5 to 17 Years | 0 (0.0%) | 0 (0.0%) |
| 18 to 34 Years | 21 (4.4%) | 14 (1.7%) |
| 35 to 64 Years | 126 (9.0%) | 1 (0.1%) |
| 65 to 74 Years | 53 (19.1%) | 14 (6.0%) |
| 75 Years and over | 29 (11.9%) | 17 (6.6%) |
Disability Class: Ambulatory Difficulty
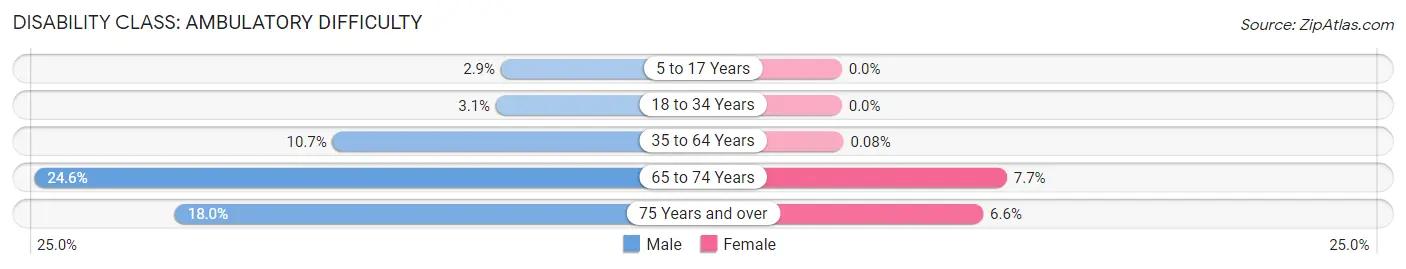
| Age Bracket | Male | Female |
| 5 to 17 Years | 9 (2.9%) | 0 (0.0%) |
| 18 to 34 Years | 15 (3.1%) | 0 (0.0%) |
| 35 to 64 Years | 150 (10.7%) | 1 (0.1%) |
| 65 to 74 Years | 68 (24.5%) | 18 (7.7%) |
| 75 Years and over | 44 (18.0%) | 17 (6.6%) |
Disability Class: Self-Care Difficulty
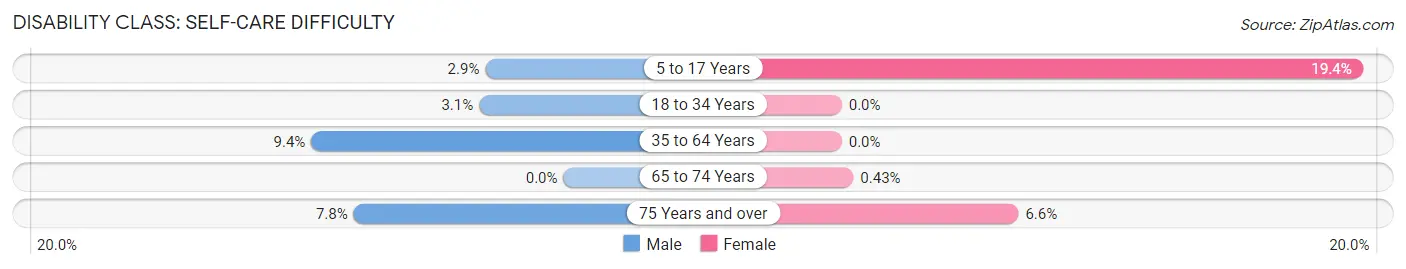
| Age Bracket | Male | Female |
| 5 to 17 Years | 9 (2.9%) | 80 (19.4%) |
| 18 to 34 Years | 15 (3.1%) | 0 (0.0%) |
| 35 to 64 Years | 131 (9.4%) | 0 (0.0%) |
| 65 to 74 Years | 0 (0.0%) | 1 (0.4%) |
| 75 Years and over | 19 (7.8%) | 17 (6.6%) |
Technology Access in Rochester
Computing Device Access in Rochester
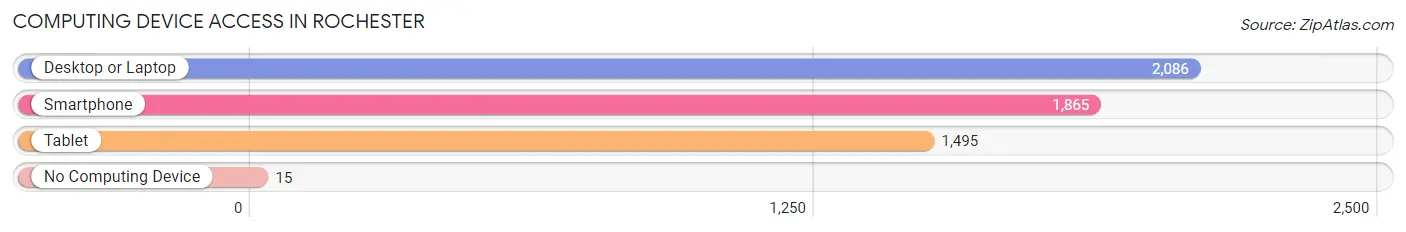
| Device Type | # Households | % Households |
| Desktop or Laptop | 2,086 | 96.5% |
| Smartphone | 1,865 | 86.3% |
| Tablet | 1,495 | 69.2% |
| No Computing Device | 15 | 0.7% |
| Total | 2,161 | 100.0% |
Internet Access in Rochester
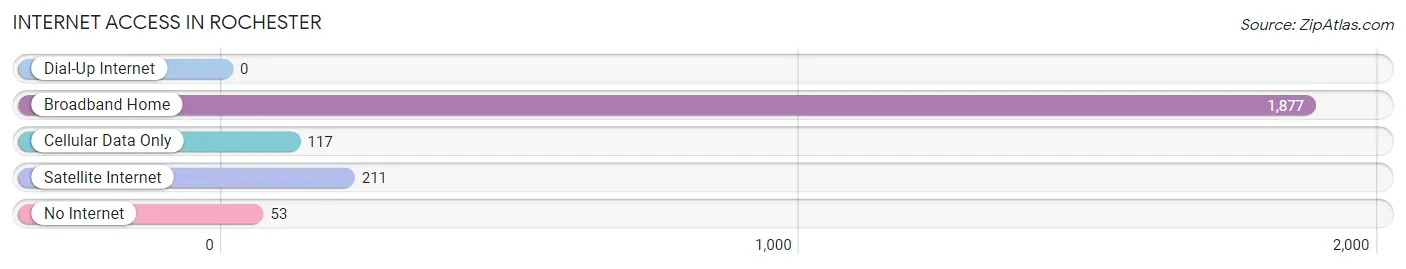
| Internet Type | # Households | % Households |
| Dial-Up Internet | 0 | 0.0% |
| Broadband Home | 1,877 | 86.9% |
| Cellular Data Only | 117 | 5.4% |
| Satellite Internet | 211 | 9.8% |
| No Internet | 53 | 2.5% |
| Total | 2,161 | 100.0% |
Rochester Summary
Rochester, Washington is a small city located in Thurston County, Washington, United States. It is situated on the banks of the Chehalis River, approximately 10 miles south of the state capital, Olympia. The city has a population of approximately 8,000 people and is part of the Olympia-Lacey-Tumwater Metropolitan Statistical Area.
History
Rochester was first settled in 1853 by a group of settlers from the East Coast. The settlers were attracted to the area by the abundance of timber and the potential for farming. The town was originally named “Rochester” after the city of Rochester, New York. The first post office was established in 1854 and the town was officially incorporated in 1891.
In the early 1900s, the town experienced a period of growth and prosperity due to the logging industry. The town was home to several sawmills and lumber companies, which provided employment for many of the town’s residents. The town also had a thriving agricultural industry, with many farmers growing apples, pears, and other fruits and vegetables.
In the 1950s, the town began to experience a decline in population as the logging industry began to decline. The town’s economy shifted to focus more on tourism and retail. The town is now home to several small businesses, including antique stores, restaurants, and a winery.
Geography
Rochester is located in the western part of Thurston County, Washington. It is situated on the banks of the Chehalis River, approximately 10 miles south of the state capital, Olympia. The city has a total area of 2.3 square miles, all of which is land. The city is located in a temperate climate zone, with mild winters and warm summers.
Economy
Rochester’s economy is largely based on tourism and retail. The city is home to several small businesses, including antique stores, restaurants, and a winery. The city is also home to a number of manufacturing companies, including a paper mill and a wood products plant. The city is also home to a number of government offices, including the Thurston County Courthouse and the Washington State Department of Transportation.
Demographics
As of the 2010 census, Rochester had a population of 8,000 people. The racial makeup of the city was 87.3% White, 4.2% Hispanic or Latino, 2.2% Asian, 1.2% African American, and 0.3% Native American. The median household income was $50,000 and the median family income was $60,000. The per capita income was $25,000.
Rochester is a small city with a rich history and a diverse population. The city has a thriving economy based on tourism and retail, as well as a number of manufacturing and government offices. The city is home to a number of small businesses, including antique stores, restaurants, and a winery. The city is also home to a number of government offices, including the Thurston County Courthouse and the Washington State Department of Transportation.
Common Questions
What is Per Capita Income in Rochester?
Per Capita income in Rochester is $33,330.
What is the Median Family Income in Rochester?
Median Family Income in Rochester is $96,778.
What is the Median Household income in Rochester?
Median Household Income in Rochester is $92,883.
What is Income or Wage Gap in Rochester?
Income or Wage Gap in Rochester is 22.2%.
Women in Rochester earn 77.8 cents for every dollar earned by a man.
What is Inequality or Gini Index in Rochester?
Inequality or Gini Index in Rochester is 0.34.
What is the Total Population of Rochester?
Total Population of Rochester is 6,282.
What is the Total Male Population of Rochester?
Total Male Population of Rochester is 3,114.
What is the Total Female Population of Rochester?
Total Female Population of Rochester is 3,168.
What is the Ratio of Males per 100 Females in Rochester?
There are 98.30 Males per 100 Females in Rochester.
What is the Ratio of Females per 100 Males in Rochester?
There are 101.73 Females per 100 Males in Rochester.
What is the Median Population Age in Rochester?
Median Population Age in Rochester is 42.7 Years.
What is the Average Family Size in Rochester
Average Family Size in Rochester is 3.3 People.
What is the Average Household Size in Rochester
Average Household Size in Rochester is 2.9 People.
How Large is the Labor Force in Rochester?
There are 2,935 People in the Labor Forcein in Rochester.
What is the Percentage of People in the Labor Force in Rochester?
58.6% of People are in the Labor Force in Rochester.
What is the Unemployment Rate in Rochester?
Unemployment Rate in Rochester is 0.4%.