Neilton, WA Map & Demographics
Neilton Map
Neilton Overview
$25,083
PER CAPITA INCOME
5.5%
WAGE / INCOME GAP [ % ]
94.5¢/ $1
WAGE / INCOME GAP [ $ ]
0.63
INEQUALITY / GINI INDEX
278
TOTAL POPULATION
173
MALE POPULATION
105
FEMALE POPULATION
164.76
MALES / 100 FEMALES
60.69
FEMALES / 100 MALES
38.3
MEDIAN AGE
3.3
AVG FAMILY SIZE
3.0
AVG HOUSEHOLD SIZE
103
LABOR FORCE [ PEOPLE ]
53.1%
PERCENT IN LABOR FORCE
Neilton Zip Codes
Neilton Area Codes
Income in Neilton
Income Overview in Neilton
| Characteristic | Number | Measure |
| Per Capita Income | 278 | $25,083 |
| Median Family Income | 56 | $0 |
| Mean Family Income | 56 | $89,466 |
| Median Household Income | 91 | $0 |
| Mean Household Income | 91 | $69,455 |
| Income Deficit | 56 | $0 |
| Wage / Income Gap (%) | 278 | 5.50% |
| Wage / Income Gap ($) | 278 | 94.50¢ per $1 |
| Gini / Inequality Index | 278 | 0.63 |
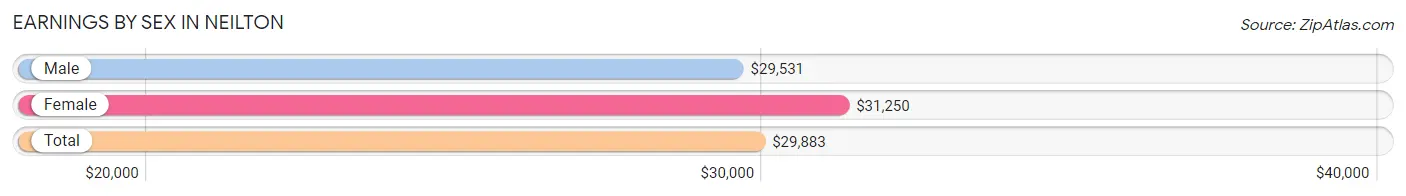
Earnings by Sex in Neilton
Average Earnings in Neilton are $29,883, $29,531 for men and $31,250 for women, a difference of 5.5%.
| Sex | Number | Average Earnings |
| Male | 72 (69.9%) | $29,531 |
| Female | 31 (30.1%) | $31,250 |
| Total | 103 (100.0%) | $29,883 |
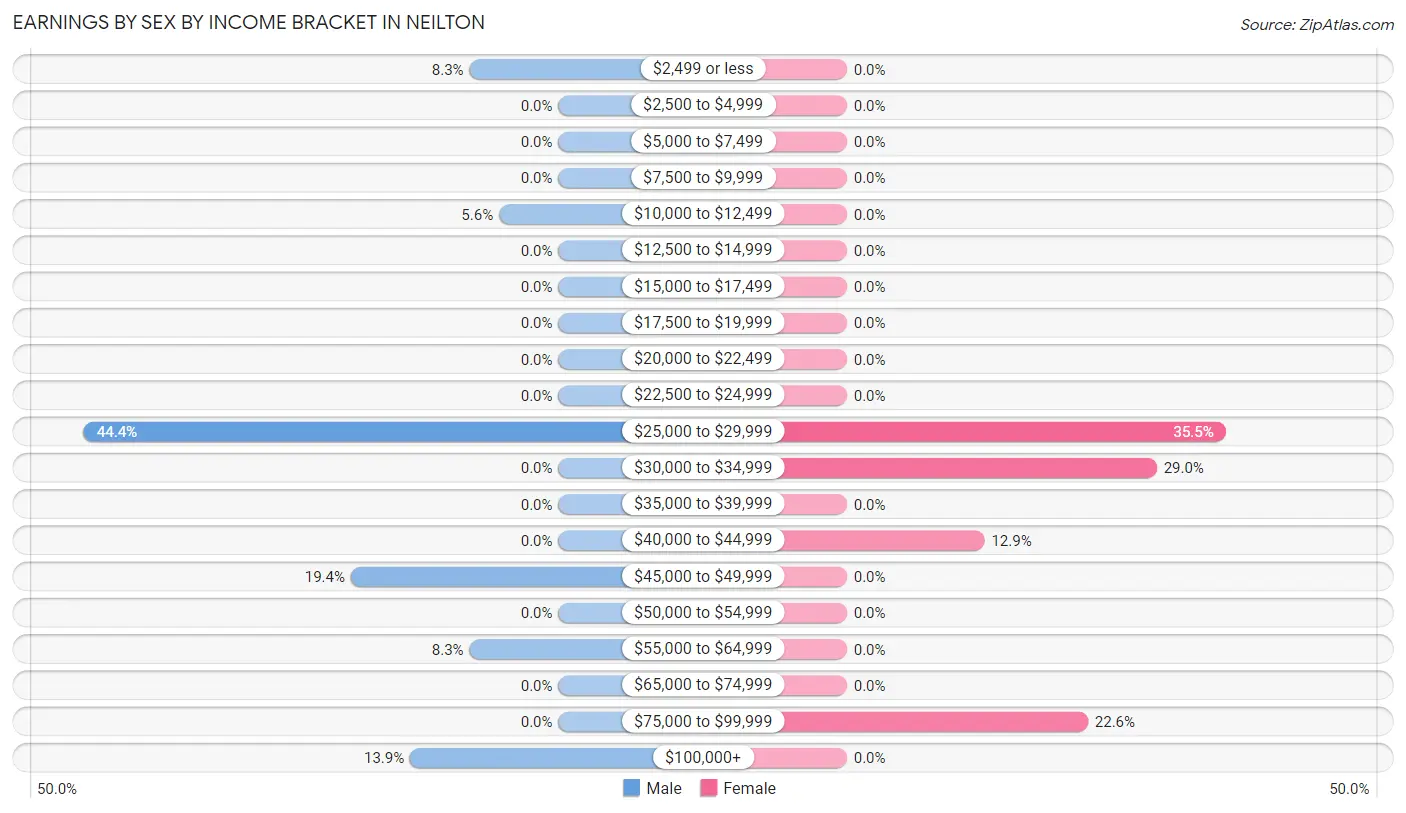
Earnings by Sex by Income Bracket in Neilton
The most common earnings brackets in Neilton are $25,000 to $29,999 for men (32 | 44.4%) and $25,000 to $29,999 for women (11 | 35.5%).
| Income | Male | Female |
| $2,499 or less | 6 (8.3%) | 0 (0.0%) |
| $2,500 to $4,999 | 0 (0.0%) | 0 (0.0%) |
| $5,000 to $7,499 | 0 (0.0%) | 0 (0.0%) |
| $7,500 to $9,999 | 0 (0.0%) | 0 (0.0%) |
| $10,000 to $12,499 | 4 (5.6%) | 0 (0.0%) |
| $12,500 to $14,999 | 0 (0.0%) | 0 (0.0%) |
| $15,000 to $17,499 | 0 (0.0%) | 0 (0.0%) |
| $17,500 to $19,999 | 0 (0.0%) | 0 (0.0%) |
| $20,000 to $22,499 | 0 (0.0%) | 0 (0.0%) |
| $22,500 to $24,999 | 0 (0.0%) | 0 (0.0%) |
| $25,000 to $29,999 | 32 (44.4%) | 11 (35.5%) |
| $30,000 to $34,999 | 0 (0.0%) | 9 (29.0%) |
| $35,000 to $39,999 | 0 (0.0%) | 0 (0.0%) |
| $40,000 to $44,999 | 0 (0.0%) | 4 (12.9%) |
| $45,000 to $49,999 | 14 (19.4%) | 0 (0.0%) |
| $50,000 to $54,999 | 0 (0.0%) | 0 (0.0%) |
| $55,000 to $64,999 | 6 (8.3%) | 0 (0.0%) |
| $65,000 to $74,999 | 0 (0.0%) | 0 (0.0%) |
| $75,000 to $99,999 | 0 (0.0%) | 7 (22.6%) |
| $100,000+ | 10 (13.9%) | 0 (0.0%) |
| Total | 72 (100.0%) | 31 (100.0%) |
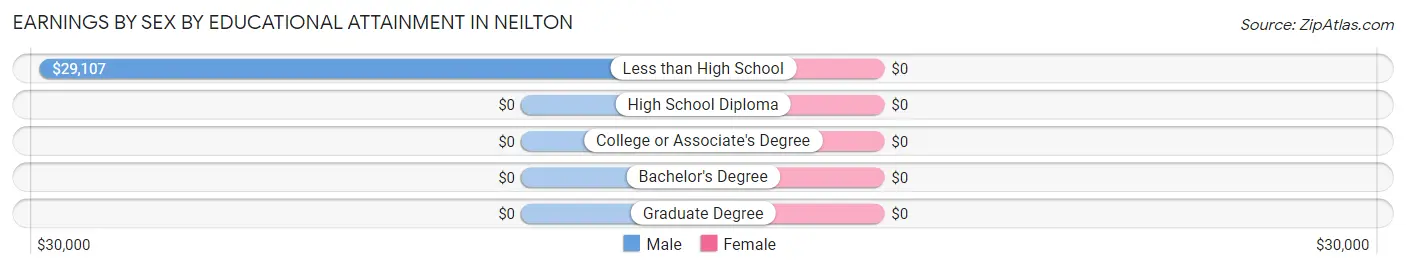
Earnings by Sex by Educational Attainment in Neilton
| Educational Attainment | Male Income | Female Income |
| Less than High School | $29,107 | $0 |
| High School Diploma | - | - |
| College or Associate's Degree | - | - |
| Bachelor's Degree | - | - |
| Graduate Degree | - | - |
| Total | $29,531 | $31,250 |
Family Income in Neilton
Family Income Brackets in Neilton
According to the Neilton family income data, there are 11 families falling into the $15,000 to $24,999 income range, which is the most common income bracket and makes up 19.6% of all families.
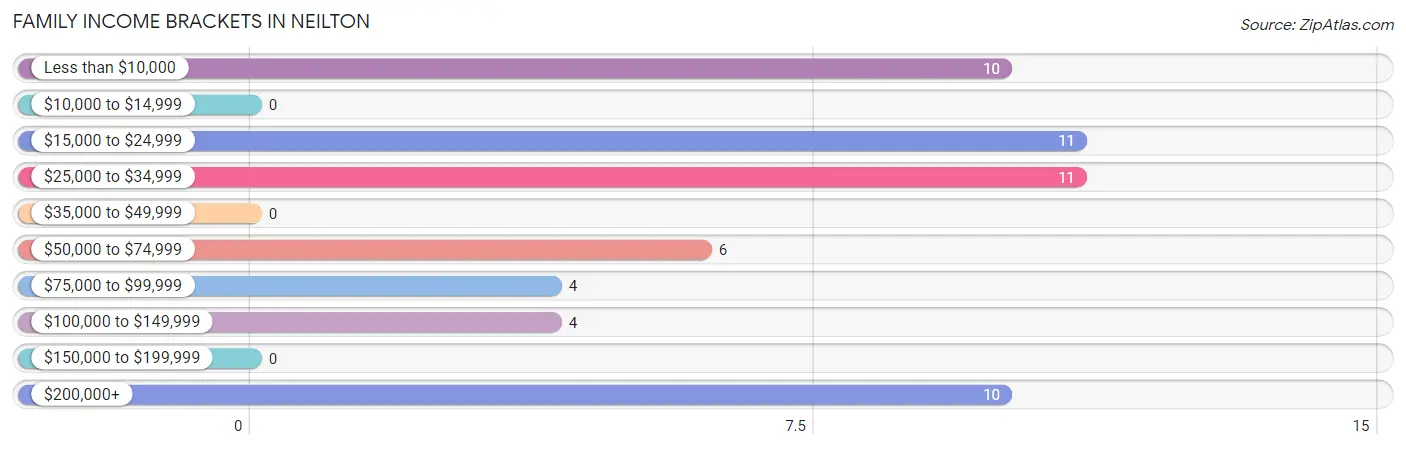
| Income Bracket | # Families | % Families |
| Less than $10,000 | 10 | 17.9% |
| $10,000 to $14,999 | 0 | 0.0% |
| $15,000 to $24,999 | 11 | 19.6% |
| $25,000 to $34,999 | 11 | 19.6% |
| $35,000 to $49,999 | 0 | 0.0% |
| $50,000 to $74,999 | 6 | 10.7% |
| $75,000 to $99,999 | 4 | 7.1% |
| $100,000 to $149,999 | 4 | 7.1% |
| $150,000 to $199,999 | 0 | 0.0% |
| $200,000+ | 10 | 17.9% |
Family Income by Famaliy Size in Neilton
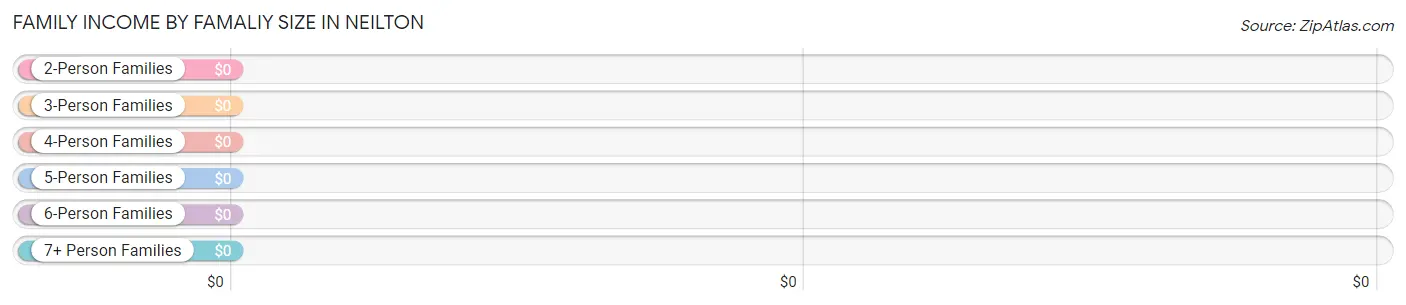
| Income Bracket | # Families | Median Income |
| 2-Person Families | 21 (37.5%) | $0 |
| 3-Person Families | 25 (44.6%) | $0 |
| 4-Person Families | 4 (7.1%) | $0 |
| 5-Person Families | 0 (0.0%) | $0 |
| 6-Person Families | 6 (10.7%) | $0 |
| 7+ Person Families | 0 (0.0%) | $0 |
| Total | 56 (100.0%) | $0 |
Family Income by Number of Earners in Neilton
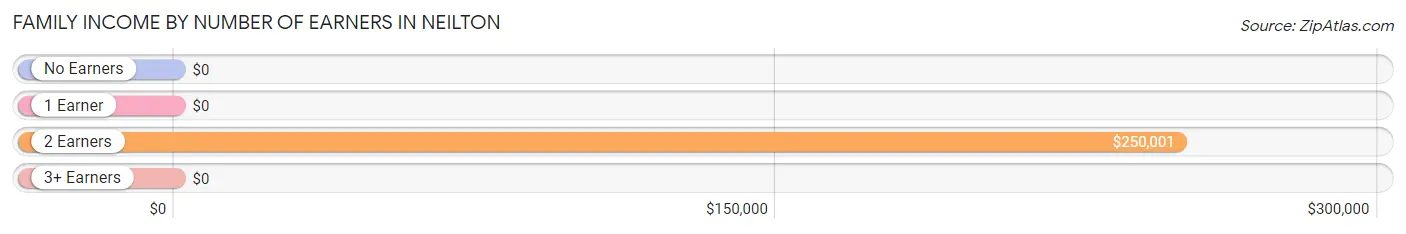
| Number of Earners | # Families | Median Income |
| No Earners | 21 (37.5%) | $0 |
| 1 Earner | 17 (30.4%) | $0 |
| 2 Earners | 18 (32.1%) | $250,001 |
| 3+ Earners | 0 (0.0%) | $0 |
| Total | 56 (100.0%) | $0 |
Household Income in Neilton
Household Income Brackets in Neilton
With 20 households falling in the category, the less than $10,000 income range is the most frequent in Neilton, accounting for 22.0% of all households.
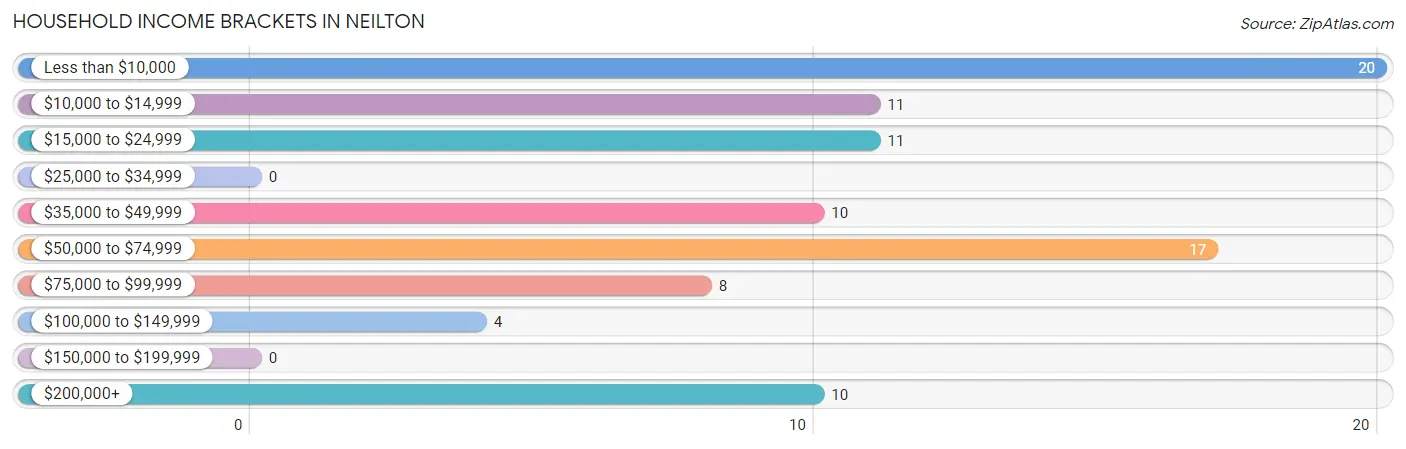
| Income Bracket | # Households | % Households |
| Less than $10,000 | 20 | 22.0% |
| $10,000 to $14,999 | 11 | 12.1% |
| $15,000 to $24,999 | 11 | 12.1% |
| $25,000 to $34,999 | 0 | 0.0% |
| $35,000 to $49,999 | 10 | 11.0% |
| $50,000 to $74,999 | 17 | 18.7% |
| $75,000 to $99,999 | 8 | 8.8% |
| $100,000 to $149,999 | 4 | 4.4% |
| $150,000 to $199,999 | 0 | 0.0% |
| $200,000+ | 10 | 11.0% |
Household Income by Householder Age in Neilton
The median household income in Neilton is $0, with the highest median household income of $250,001 found in the 45 to 64 years age bracket for the primary householder. A total of 18 households (19.8%) fall into this category.
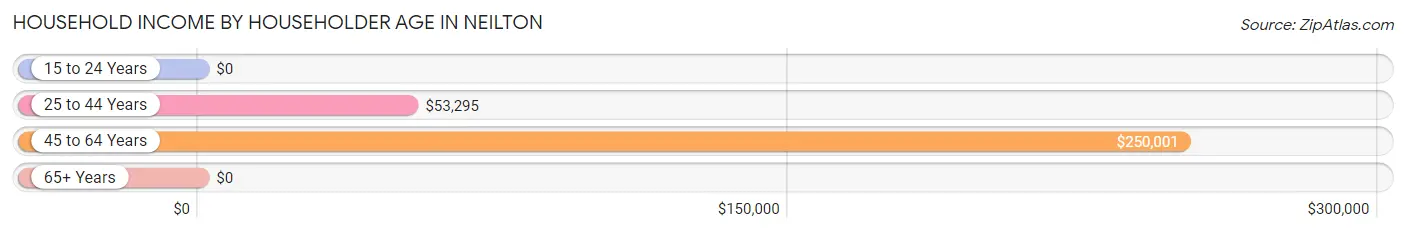
| Income Bracket | # Households | Median Income |
| 15 to 24 Years | 0 (0.0%) | $0 |
| 25 to 44 Years | 27 (29.7%) | $53,295 |
| 45 to 64 Years | 18 (19.8%) | $250,001 |
| 65+ Years | 46 (50.5%) | $0 |
| Total | 91 (100.0%) | $0 |
Poverty in Neilton
Income Below Poverty by Sex and Age in Neilton
With 43.3% poverty level for males and 20.0% for females among the residents of Neilton, under 5 year old males and 65 to 74 year old females are the most vulnerable to poverty, with 22 males (100.0%) and 11 females (100.0%) in their respective age groups living below the poverty level.
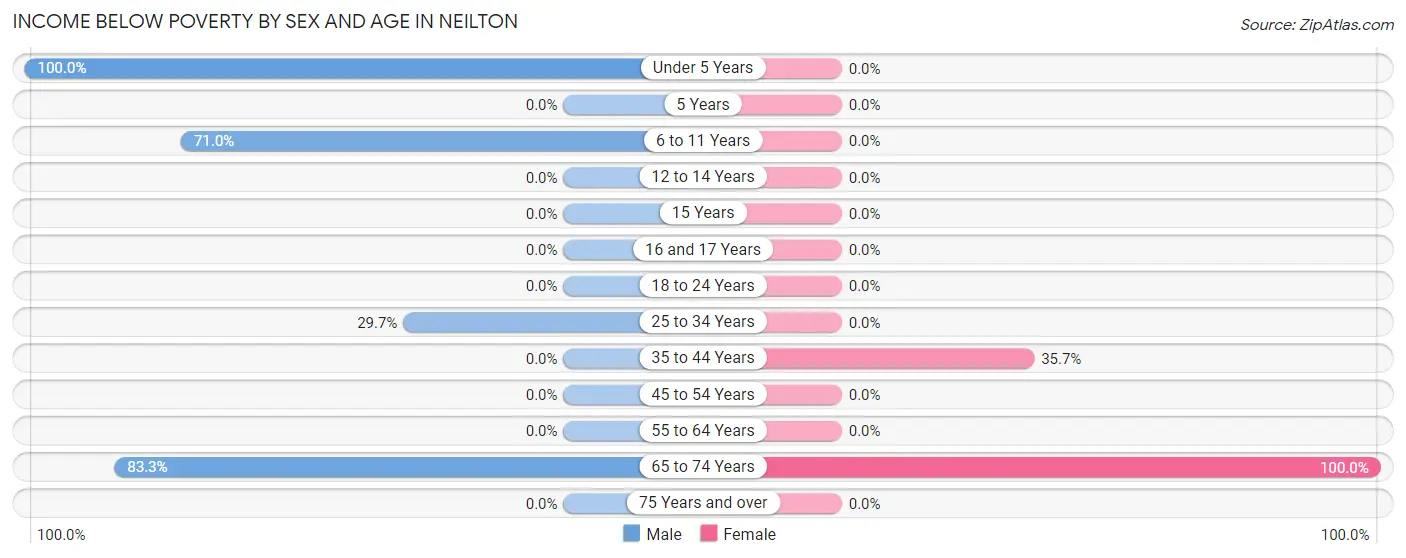
| Age Bracket | Male | Female |
| Under 5 Years | 22 (100.0%) | 0 (0.0%) |
| 5 Years | 0 (0.0%) | 0 (0.0%) |
| 6 to 11 Years | 22 (71.0%) | 0 (0.0%) |
| 12 to 14 Years | 0 (0.0%) | 0 (0.0%) |
| 15 Years | 0 (0.0%) | 0 (0.0%) |
| 16 and 17 Years | 0 (0.0%) | 0 (0.0%) |
| 18 to 24 Years | 0 (0.0%) | 0 (0.0%) |
| 25 to 34 Years | 11 (29.7%) | 0 (0.0%) |
| 35 to 44 Years | 0 (0.0%) | 10 (35.7%) |
| 45 to 54 Years | 0 (0.0%) | 0 (0.0%) |
| 55 to 64 Years | 0 (0.0%) | 0 (0.0%) |
| 65 to 74 Years | 20 (83.3%) | 11 (100.0%) |
| 75 Years and over | 0 (0.0%) | 0 (0.0%) |
| Total | 75 (43.3%) | 21 (20.0%) |
Income Above Poverty by Sex and Age in Neilton
According to the poverty statistics in Neilton, males aged 35 to 44 years and females aged under 5 years are the age groups that are most secure financially, with 100.0% of males and 100.0% of females in these age groups living above the poverty line.
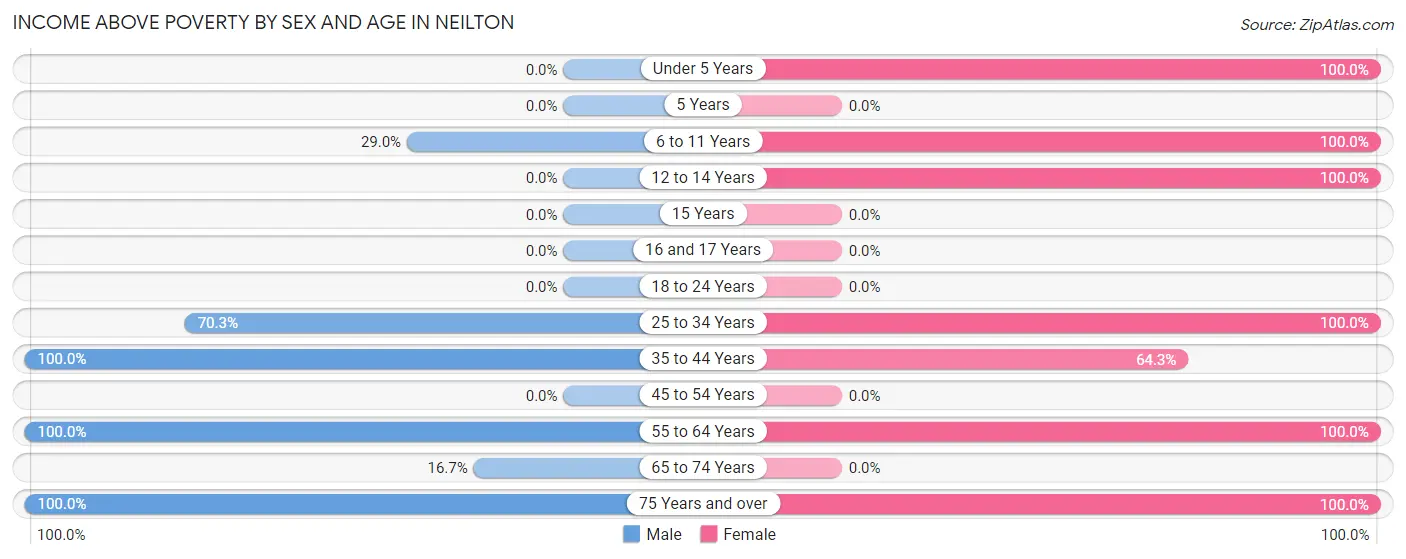
| Age Bracket | Male | Female |
| Under 5 Years | 0 (0.0%) | 3 (100.0%) |
| 5 Years | 0 (0.0%) | 0 (0.0%) |
| 6 to 11 Years | 9 (29.0%) | 17 (100.0%) |
| 12 to 14 Years | 0 (0.0%) | 11 (100.0%) |
| 15 Years | 0 (0.0%) | 0 (0.0%) |
| 16 and 17 Years | 0 (0.0%) | 0 (0.0%) |
| 18 to 24 Years | 0 (0.0%) | 0 (0.0%) |
| 25 to 34 Years | 26 (70.3%) | 4 (100.0%) |
| 35 to 44 Years | 32 (100.0%) | 18 (64.3%) |
| 45 to 54 Years | 0 (0.0%) | 0 (0.0%) |
| 55 to 64 Years | 10 (100.0%) | 20 (100.0%) |
| 65 to 74 Years | 4 (16.7%) | 0 (0.0%) |
| 75 Years and over | 17 (100.0%) | 11 (100.0%) |
| Total | 98 (56.7%) | 84 (80.0%) |
Income Below Poverty Among Married-Couple Families in Neilton
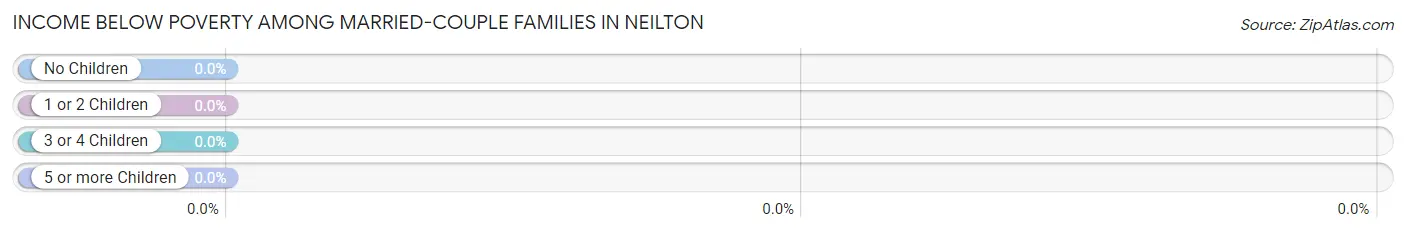
| Children | Above Poverty | Below Poverty |
| No Children | 25 (100.0%) | 0 (0.0%) |
| 1 or 2 Children | 4 (100.0%) | 0 (0.0%) |
| 3 or 4 Children | 6 (100.0%) | 0 (0.0%) |
| 5 or more Children | 0 (0.0%) | 0 (0.0%) |
| Total | 35 (100.0%) | 0 (0.0%) |
Income Below Poverty Among Single-Parent Households in Neilton
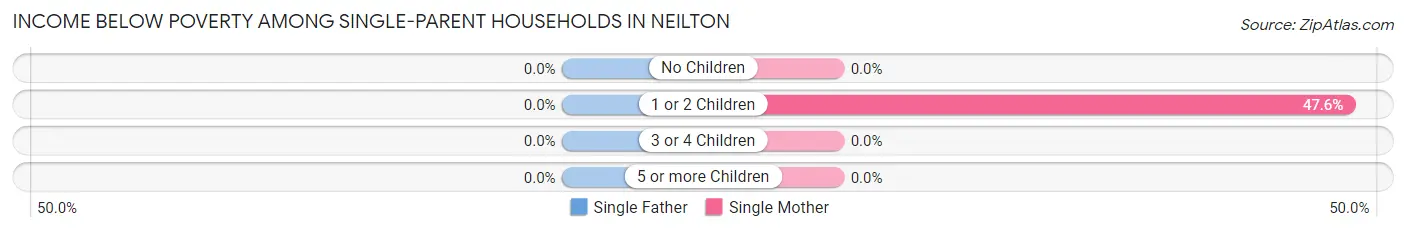
| Children | Single Father | Single Mother |
| No Children | 0 (0.0%) | 0 (0.0%) |
| 1 or 2 Children | 0 (0.0%) | 10 (47.6%) |
| 3 or 4 Children | 0 (0.0%) | 0 (0.0%) |
| 5 or more Children | 0 (0.0%) | 0 (0.0%) |
| Total | 0 (0.0%) | 10 (47.6%) |
Income Below Poverty Among Married-Couple vs Single-Parent Households in Neilton
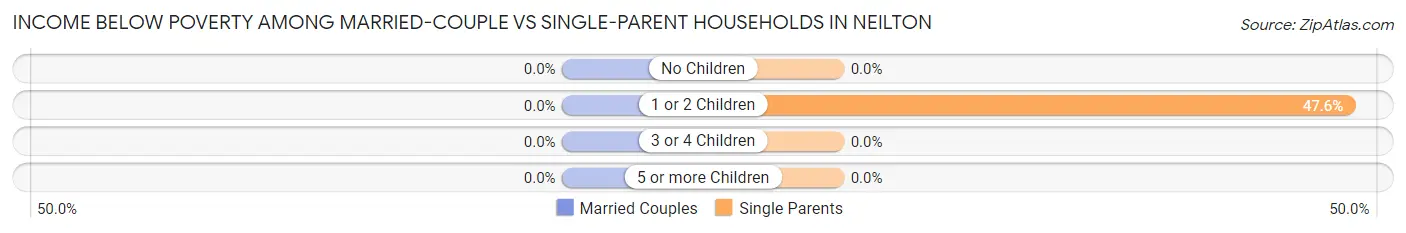
| Children | Married-Couple Families | Single-Parent Households |
| No Children | 0 (0.0%) | 0 (0.0%) |
| 1 or 2 Children | 0 (0.0%) | 10 (47.6%) |
| 3 or 4 Children | 0 (0.0%) | 0 (0.0%) |
| 5 or more Children | 0 (0.0%) | 0 (0.0%) |
| Total | 0 (0.0%) | 10 (47.6%) |
Race in Neilton
The most populous races in Neilton are White / Caucasian (176 | 63.3%), Hispanic or Latino (120 | 43.2%), and Some other Race (96 | 34.5%).
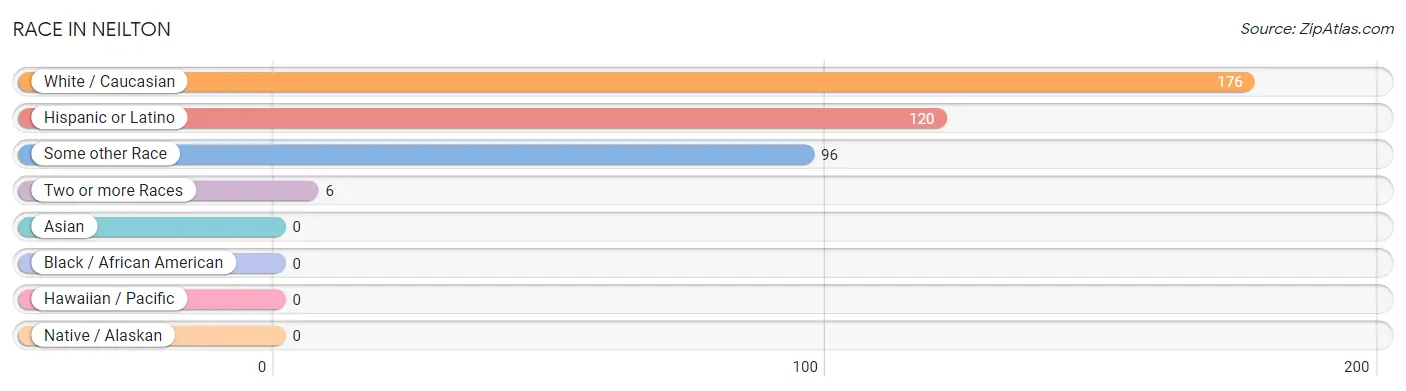
| Race | # Population | % Population |
| Asian | 0 | 0.0% |
| Black / African American | 0 | 0.0% |
| Hawaiian / Pacific | 0 | 0.0% |
| Hispanic or Latino | 120 | 43.2% |
| Native / Alaskan | 0 | 0.0% |
| White / Caucasian | 176 | 63.3% |
| Two or more Races | 6 | 2.2% |
| Some other Race | 96 | 34.5% |
| Total | 278 | 100.0% |
Ancestry in Neilton
The most populous ancestries reported in Neilton are Mexican (120 | 43.2%), European (68 | 24.5%), Irish (41 | 14.7%), English (37 | 13.3%), and German (33 | 11.9%), together accounting for 107.6% of all Neilton residents.
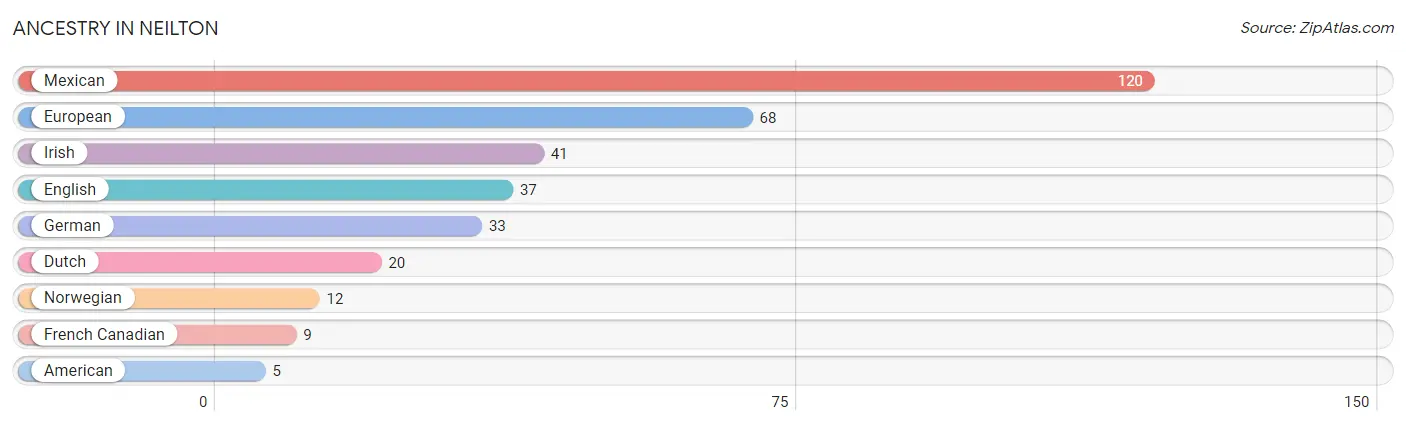
| Ancestry | # Population | % Population |
| American | 5 | 1.8% |
| Dutch | 20 | 7.2% |
| English | 37 | 13.3% |
| European | 68 | 24.5% |
| French Canadian | 9 | 3.2% |
| German | 33 | 11.9% |
| Irish | 41 | 14.7% |
| Mexican | 120 | 43.2% |
| Norwegian | 12 | 4.3% | View All 9 Rows |
Immigrants in Neilton
The most numerous immigrant groups reported in Neilton came from Central America (52 | 18.7%), Latin America (52 | 18.7%), and Mexico (52 | 18.7%), together accounting for 56.1% of all Neilton residents.
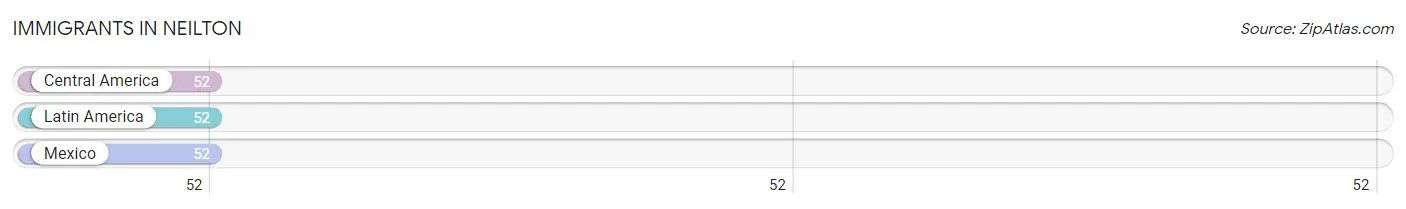
| Immigration Origin | # Population | % Population |
| Central America | 52 | 18.7% |
| Latin America | 52 | 18.7% |
| Mexico | 52 | 18.7% | View All 3 Rows |
Sex and Age in Neilton
Sex and Age in Neilton
The most populous age groups in Neilton are 5 to 9 Years (28 | 16.2%) for men and 35 to 39 Years (21 | 20.0%) for women.
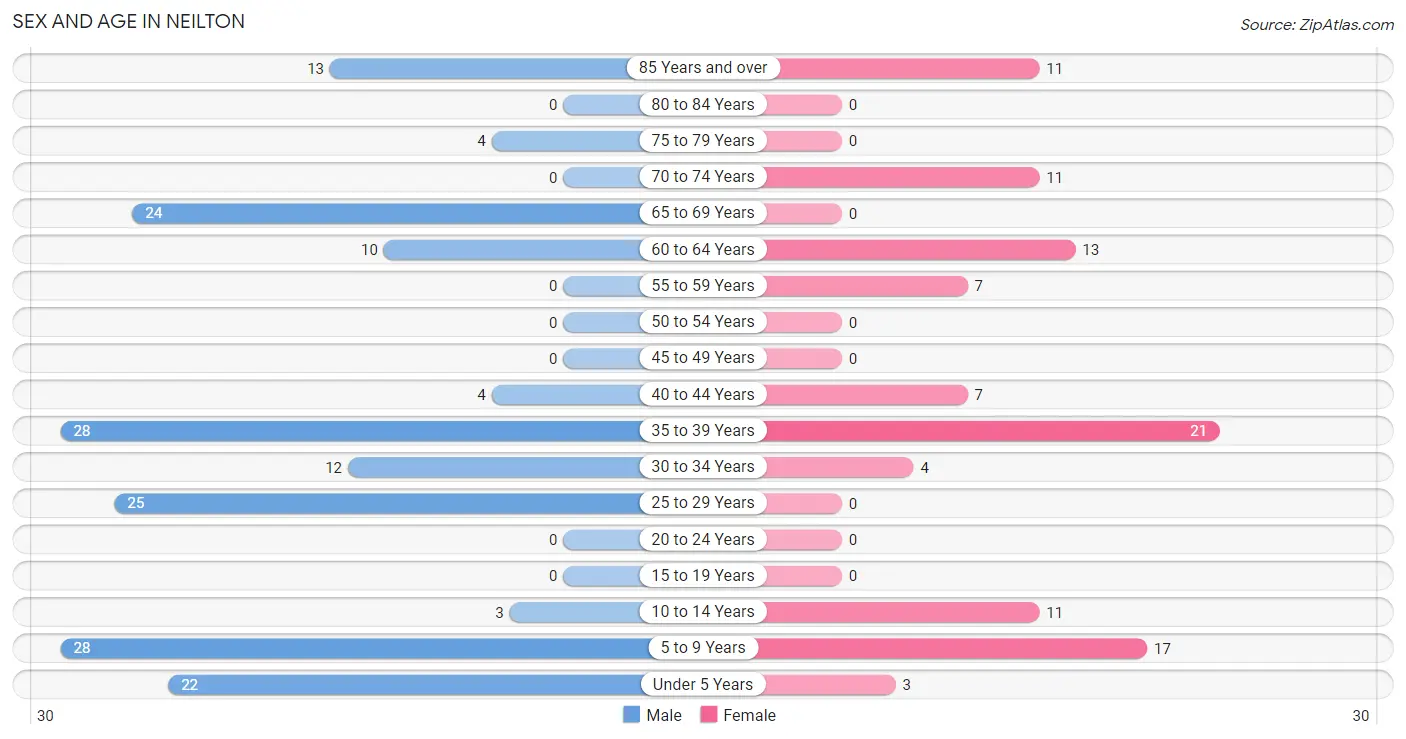
| Age Bracket | Male | Female |
| Under 5 Years | 22 (12.7%) | 3 (2.9%) |
| 5 to 9 Years | 28 (16.2%) | 17 (16.2%) |
| 10 to 14 Years | 3 (1.7%) | 11 (10.5%) |
| 15 to 19 Years | 0 (0.0%) | 0 (0.0%) |
| 20 to 24 Years | 0 (0.0%) | 0 (0.0%) |
| 25 to 29 Years | 25 (14.4%) | 0 (0.0%) |
| 30 to 34 Years | 12 (6.9%) | 4 (3.8%) |
| 35 to 39 Years | 28 (16.2%) | 21 (20.0%) |
| 40 to 44 Years | 4 (2.3%) | 7 (6.7%) |
| 45 to 49 Years | 0 (0.0%) | 0 (0.0%) |
| 50 to 54 Years | 0 (0.0%) | 0 (0.0%) |
| 55 to 59 Years | 0 (0.0%) | 7 (6.7%) |
| 60 to 64 Years | 10 (5.8%) | 13 (12.4%) |
| 65 to 69 Years | 24 (13.9%) | 0 (0.0%) |
| 70 to 74 Years | 0 (0.0%) | 11 (10.5%) |
| 75 to 79 Years | 4 (2.3%) | 0 (0.0%) |
| 80 to 84 Years | 0 (0.0%) | 0 (0.0%) |
| 85 Years and over | 13 (7.5%) | 11 (10.5%) |
| Total | 173 (100.0%) | 105 (100.0%) |
Families and Households in Neilton
Median Family Size in Neilton
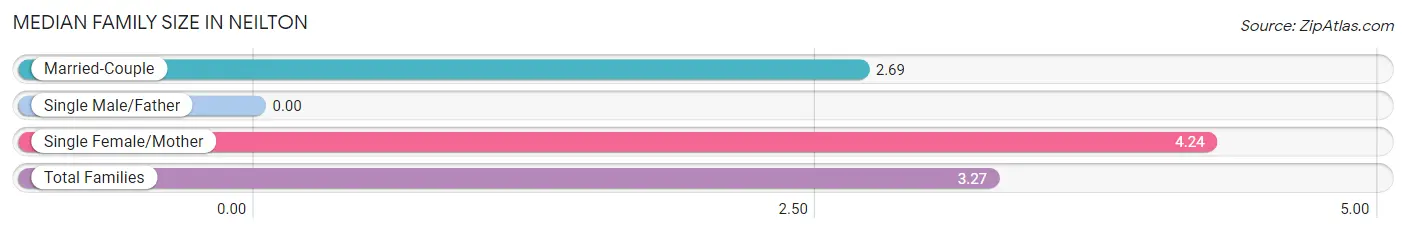
| Family Type | # Families | Family Size |
| Married-Couple | 35 (62.5%) | 2.69 |
| Single Male/Father | 0 (0.0%) | - |
| Single Female/Mother | 21 (37.5%) | 4.24 |
| Total Families | 56 (100.0%) | 3.27 |
Median Household Size in Neilton
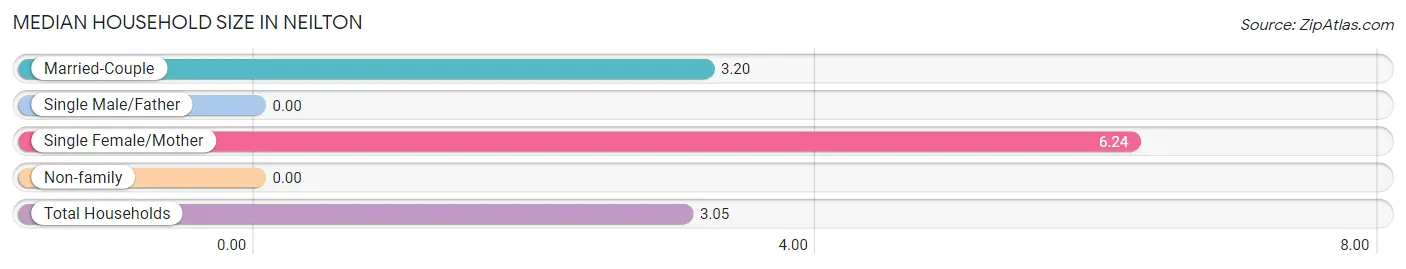
| Household Type | # Households | Household Size |
| Married-Couple | 35 (38.5%) | 3.20 |
| Single Male/Father | 0 (0.0%) | - |
| Single Female/Mother | 21 (23.1%) | 6.24 |
| Non-family | 35 (38.5%) | - |
| Total Households | 91 (100.0%) | 3.05 |
Household Size by Marriage Status in Neilton
Out of a total of 91 households in Neilton, 56 (61.5%) are family households, while 35 (38.5%) are nonfamily households. The most numerous type of family households are 4-person households, comprising 25, and the most common type of nonfamily households are 1-person households, comprising 35.
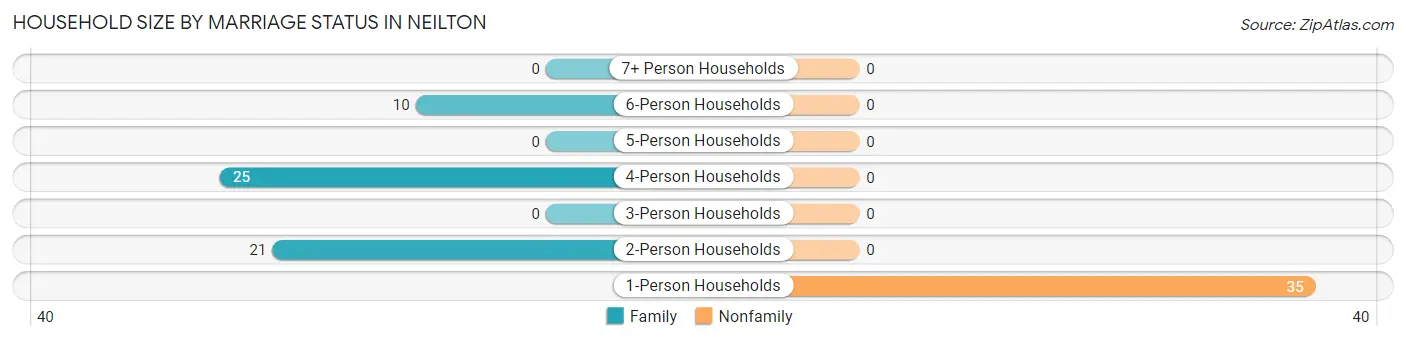
| Household Size | Family Households | Nonfamily Households |
| 1-Person Households | - | 35 (38.5%) |
| 2-Person Households | 21 (23.1%) | 0 (0.0%) |
| 3-Person Households | 0 (0.0%) | 0 (0.0%) |
| 4-Person Households | 25 (27.5%) | 0 (0.0%) |
| 5-Person Households | 0 (0.0%) | 0 (0.0%) |
| 6-Person Households | 10 (11.0%) | 0 (0.0%) |
| 7+ Person Households | 0 (0.0%) | 0 (0.0%) |
| Total | 56 (61.5%) | 35 (38.5%) |
Female Fertility in Neilton
Fertility by Age in Neilton
| Age Bracket | Women with Births | Births / 1,000 Women |
| 15 to 19 years | 0 (0.0%) | 0.0 |
| 20 to 34 years | 0 (0.0%) | 0.0 |
| 35 to 50 years | 0 (0.0%) | 0.0 |
| Total | 0 (0.0%) | 0.0 |
Fertility by Age by Marriage Status in Neilton
| Age Bracket | Married | Unmarried |
| 15 to 19 years | 0 (0.0%) | 0 (0.0%) |
| 20 to 34 years | 0 (0.0%) | 0 (0.0%) |
| 35 to 50 years | 0 (0.0%) | 0 (0.0%) |
| Total | 0 (0.0%) | 0 (0.0%) |
Fertility by Education in Neilton
| Educational Attainment | Women with Births | Births / 1,000 Women |
| Less than High School | 0 (0.0%) | 0.0 |
| High School Diploma | 0 (0.0%) | 0.0 |
| College or Associate's Degree | 0 (0.0%) | 0.0 |
| Bachelor's Degree | 0 (0.0%) | 0.0 |
| Graduate Degree | 0 (0.0%) | 0.0 |
| Total | 0 (0.0%) | 0.0 |
Fertility by Education by Marriage Status in Neilton
| Educational Attainment | Married | Unmarried |
| Less than High School | 0 (0.0%) | 0 (0.0%) |
| High School Diploma | 0 (0.0%) | 0 (0.0%) |
| College or Associate's Degree | 0 (0.0%) | 0 (0.0%) |
| Bachelor's Degree | 0 (0.0%) | 0 (0.0%) |
| Graduate Degree | 0 (0.0%) | 0 (0.0%) |
| Total | 0 (0.0%) | 0 (0.0%) |
Employment Characteristics in Neilton
Employment by Class of Employer in Neilton
Among the 93 employed individuals in Neilton, private company employees (73 | 78.5%), local government employees (11 | 11.8%), and state government employees (9 | 9.7%) make up the most common classes of employment.
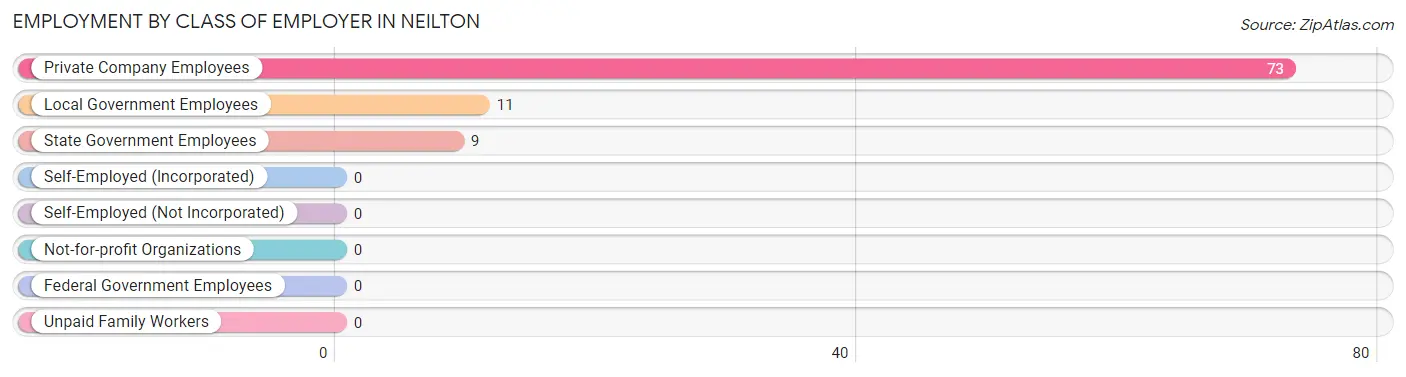
| Employer Class | # Employees | % Employees |
| Private Company Employees | 73 | 78.5% |
| Self-Employed (Incorporated) | 0 | 0.0% |
| Self-Employed (Not Incorporated) | 0 | 0.0% |
| Not-for-profit Organizations | 0 | 0.0% |
| Local Government Employees | 11 | 11.8% |
| State Government Employees | 9 | 9.7% |
| Federal Government Employees | 0 | 0.0% |
| Unpaid Family Workers | 0 | 0.0% |
| Total | 93 | 100.0% |
Employment Status by Age in Neilton
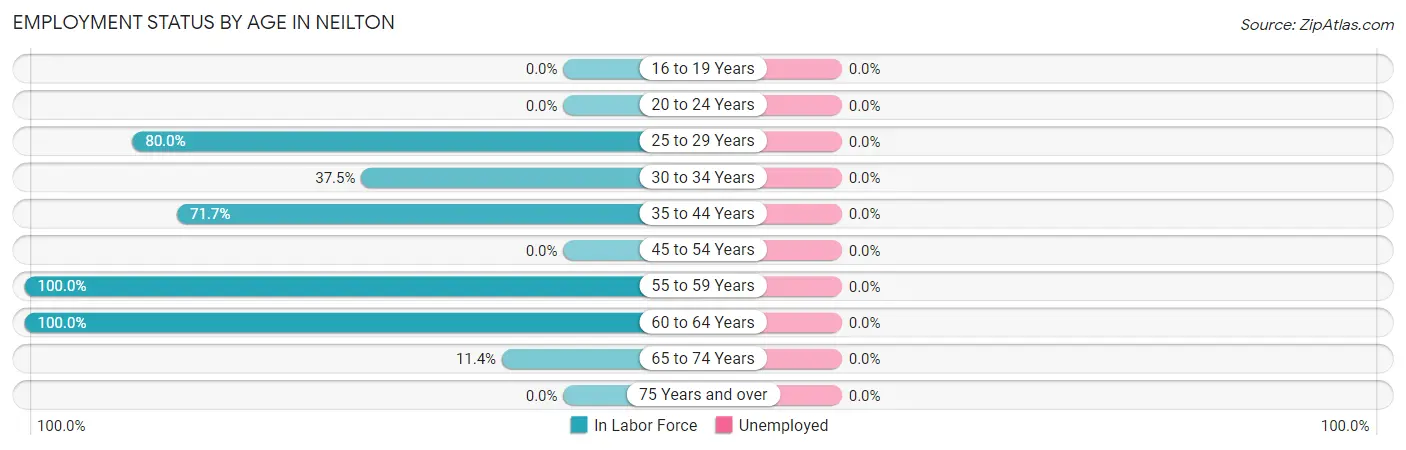
| Age Bracket | In Labor Force | Unemployed |
| 16 to 19 Years | 0 (0.0%) | 0 (0.0%) |
| 20 to 24 Years | 0 (0.0%) | 0 (0.0%) |
| 25 to 29 Years | 20 (80.0%) | 0 (0.0%) |
| 30 to 34 Years | 6 (37.5%) | 0 (0.0%) |
| 35 to 44 Years | 43 (71.7%) | 0 (0.0%) |
| 45 to 54 Years | 0 (0.0%) | 0 (0.0%) |
| 55 to 59 Years | 7 (100.0%) | 0 (0.0%) |
| 60 to 64 Years | 23 (100.0%) | 0 (0.0%) |
| 65 to 74 Years | 4 (11.4%) | 0 (0.0%) |
| 75 Years and over | 0 (0.0%) | 0 (0.0%) |
| Total | 103 (53.1%) | 0 (0.0%) |
Employment Status by Educational Attainment in Neilton
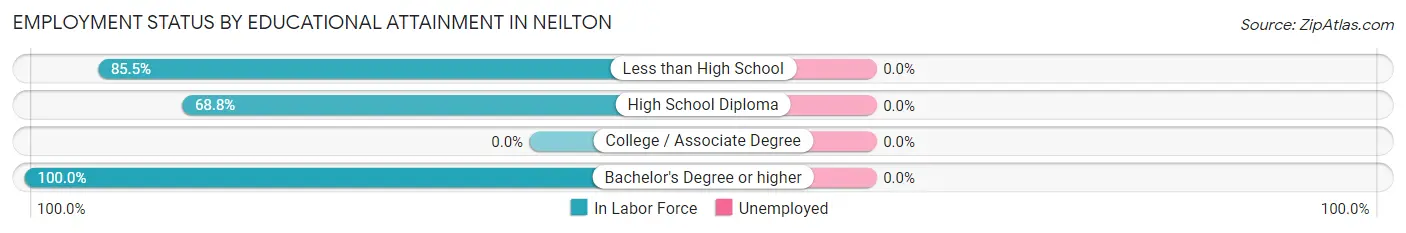
| Educational Attainment | In Labor Force | Unemployed |
| Less than High School | 59 (85.5%) | 0 (0.0%) |
| High School Diploma | 33 (68.8%) | 0 (0.0%) |
| College / Associate Degree | 0 (0.0%) | 0 (0.0%) |
| Bachelor's Degree or higher | 7 (100.0%) | 0 (0.0%) |
| Total | 99 (75.6%) | 0 (0.0%) |
Employment Occupations by Sex in Neilton
Management, Business, Science and Arts Occupations
The most common Management, Business, Science and Arts occupations in Neilton are Community & Social Service (16 | 15.5%), Education Instruction & Library (16 | 15.5%), and Management (6 | 5.8%).
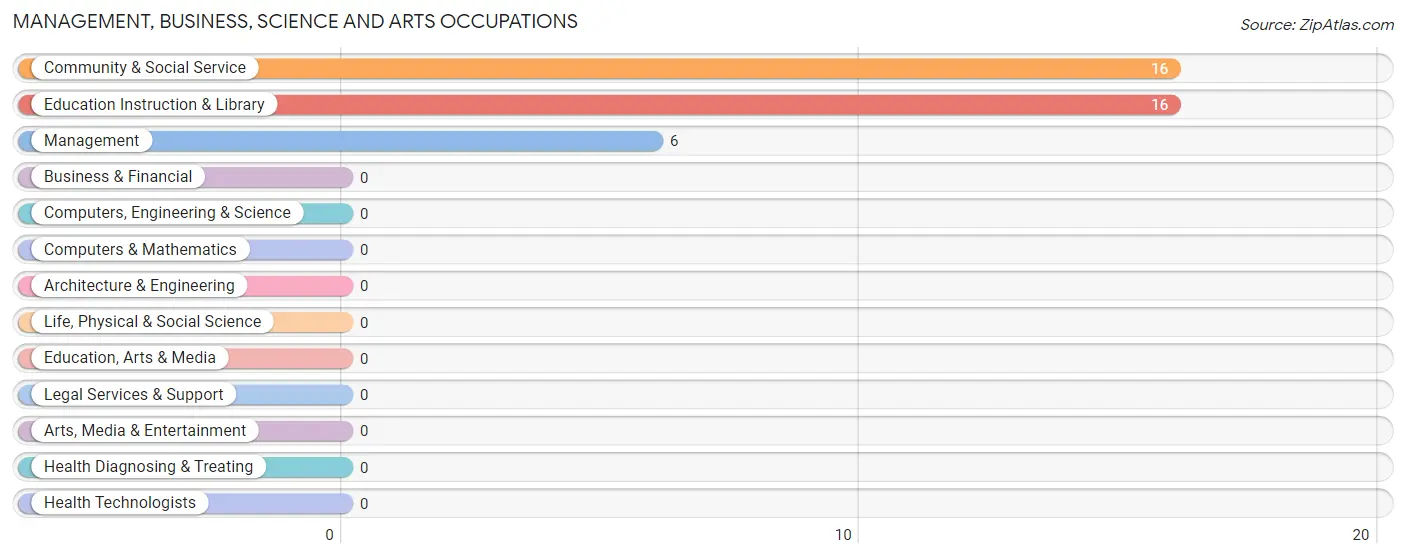
Management, Business, Science and Arts Occupations by Sex
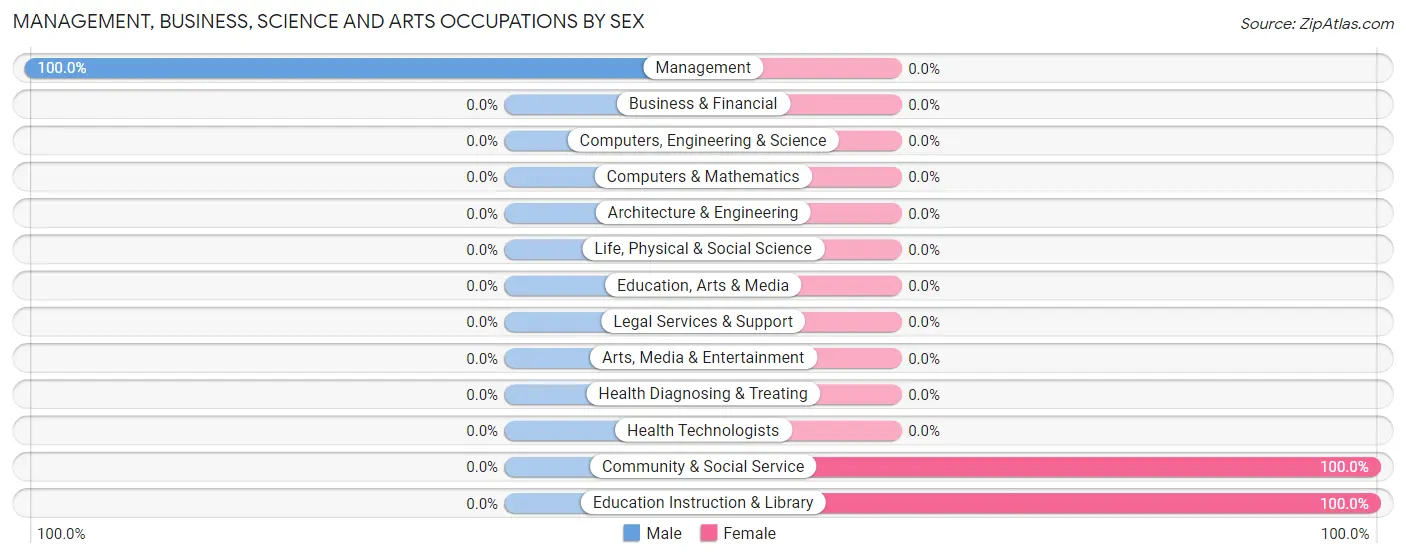
| Occupation | Male | Female |
| Management | 6 (100.0%) | 0 (0.0%) |
| Business & Financial | 0 (0.0%) | 0 (0.0%) |
| Computers, Engineering & Science | 0 (0.0%) | 0 (0.0%) |
| Computers & Mathematics | 0 (0.0%) | 0 (0.0%) |
| Architecture & Engineering | 0 (0.0%) | 0 (0.0%) |
| Life, Physical & Social Science | 0 (0.0%) | 0 (0.0%) |
| Community & Social Service | 0 (0.0%) | 16 (100.0%) |
| Education, Arts & Media | 0 (0.0%) | 0 (0.0%) |
| Legal Services & Support | 0 (0.0%) | 0 (0.0%) |
| Education Instruction & Library | 0 (0.0%) | 16 (100.0%) |
| Arts, Media & Entertainment | 0 (0.0%) | 0 (0.0%) |
| Health Diagnosing & Treating | 0 (0.0%) | 0 (0.0%) |
| Health Technologists | 0 (0.0%) | 0 (0.0%) |
| Total (Category) | 6 (27.3%) | 16 (72.7%) |
| Total (Overall) | 72 (69.9%) | 31 (30.1%) |
Services Occupations
The most common Services occupations in Neilton are Cleaning & Maintenance (14 | 13.6%), and Food Preparation & Serving (4 | 3.9%).
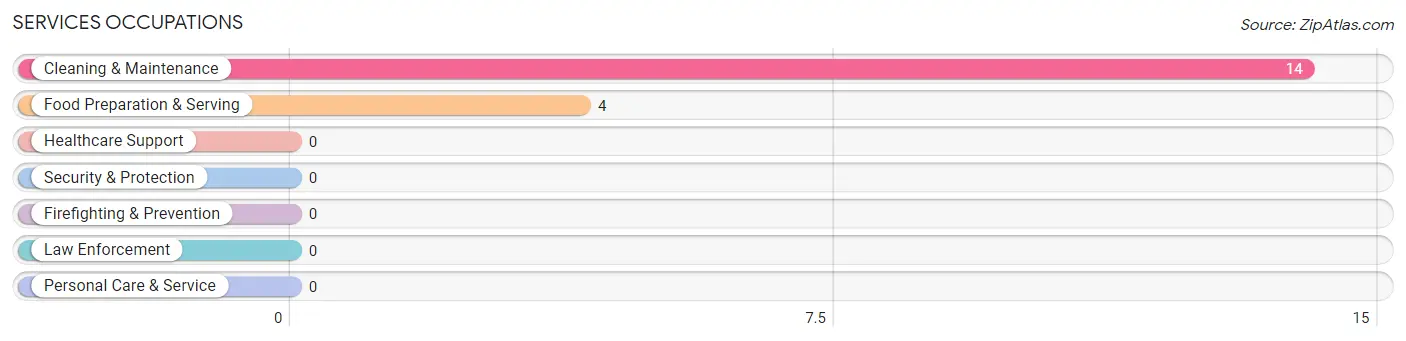
Services Occupations by Sex
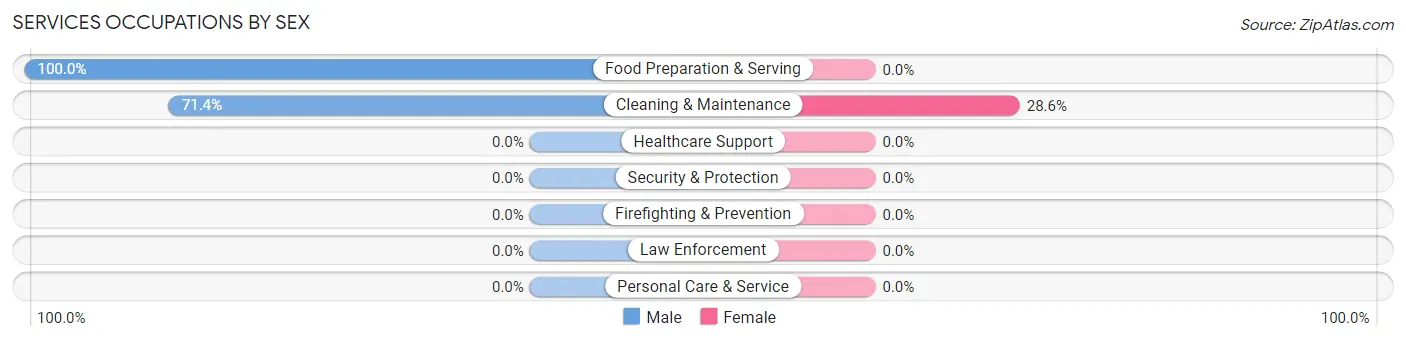
| Occupation | Male | Female |
| Healthcare Support | 0 (0.0%) | 0 (0.0%) |
| Security & Protection | 0 (0.0%) | 0 (0.0%) |
| Firefighting & Prevention | 0 (0.0%) | 0 (0.0%) |
| Law Enforcement | 0 (0.0%) | 0 (0.0%) |
| Food Preparation & Serving | 4 (100.0%) | 0 (0.0%) |
| Cleaning & Maintenance | 10 (71.4%) | 4 (28.6%) |
| Personal Care & Service | 0 (0.0%) | 0 (0.0%) |
| Total (Category) | 14 (77.8%) | 4 (22.2%) |
| Total (Overall) | 72 (69.9%) | 31 (30.1%) |
Sales and Office Occupations
The most common Sales and Office occupations in Neilton are , and Sales & Related (11 | 10.7%).
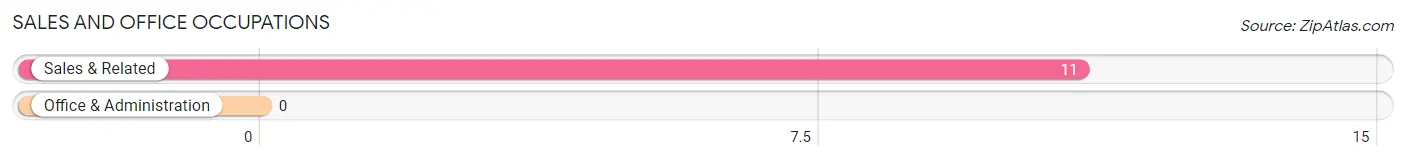
Sales and Office Occupations by Sex
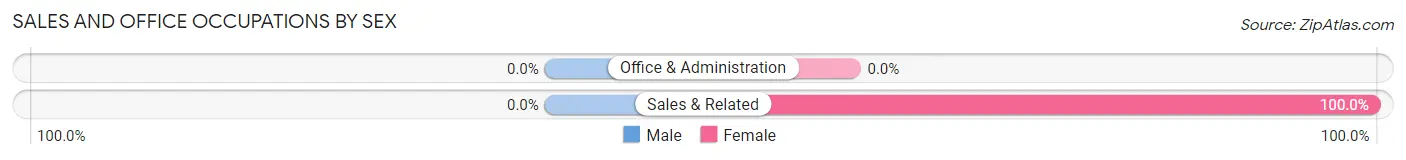
| Occupation | Male | Female |
| Sales & Related | 0 (0.0%) | 11 (100.0%) |
| Office & Administration | 0 (0.0%) | 0 (0.0%) |
| Total (Category) | 0 (0.0%) | 11 (100.0%) |
| Total (Overall) | 72 (69.9%) | 31 (30.1%) |
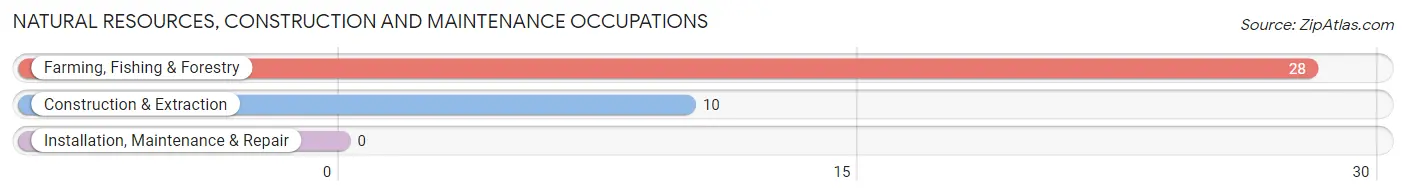
Natural Resources, Construction and Maintenance Occupations
The most common Natural Resources, Construction and Maintenance occupations in Neilton are Farming, Fishing & Forestry (28 | 27.2%), and Construction & Extraction (10 | 9.7%).
Natural Resources, Construction and Maintenance Occupations by Sex
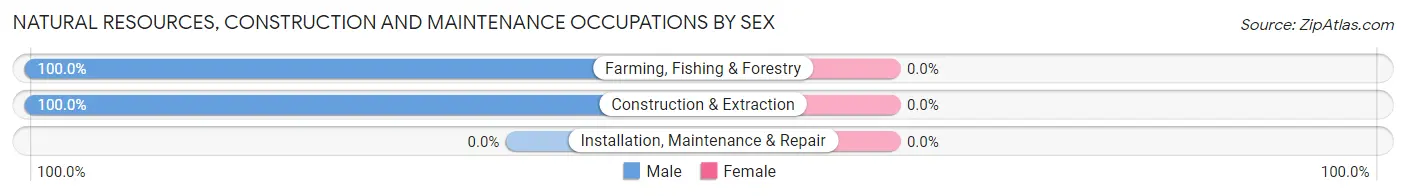
| Occupation | Male | Female |
| Farming, Fishing & Forestry | 28 (100.0%) | 0 (0.0%) |
| Construction & Extraction | 10 (100.0%) | 0 (0.0%) |
| Installation, Maintenance & Repair | 0 (0.0%) | 0 (0.0%) |
| Total (Category) | 38 (100.0%) | 0 (0.0%) |
| Total (Overall) | 72 (69.9%) | 31 (30.1%) |
Production, Transportation and Moving Occupations
The most common Production, Transportation and Moving occupations in Neilton are , and Production (14 | 13.6%).
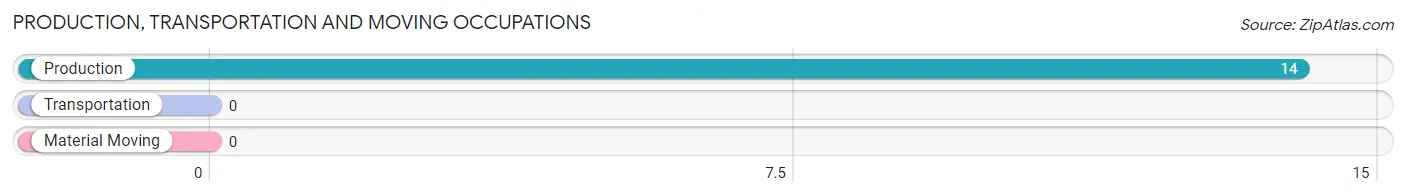
Production, Transportation and Moving Occupations by Sex
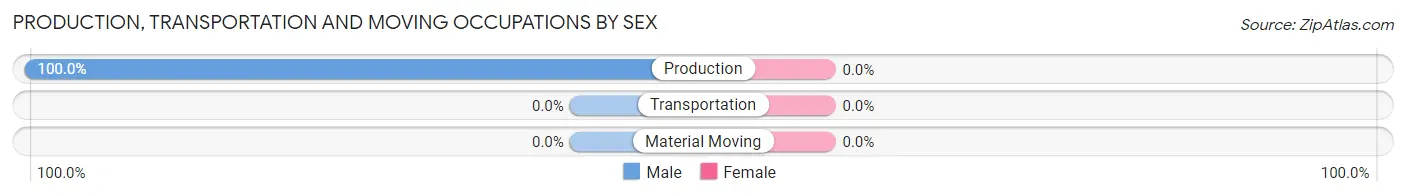
| Occupation | Male | Female |
| Production | 14 (100.0%) | 0 (0.0%) |
| Transportation | 0 (0.0%) | 0 (0.0%) |
| Material Moving | 0 (0.0%) | 0 (0.0%) |
| Total (Category) | 14 (100.0%) | 0 (0.0%) |
| Total (Overall) | 72 (69.9%) | 31 (30.1%) |
Employment Industries by Sex in Neilton
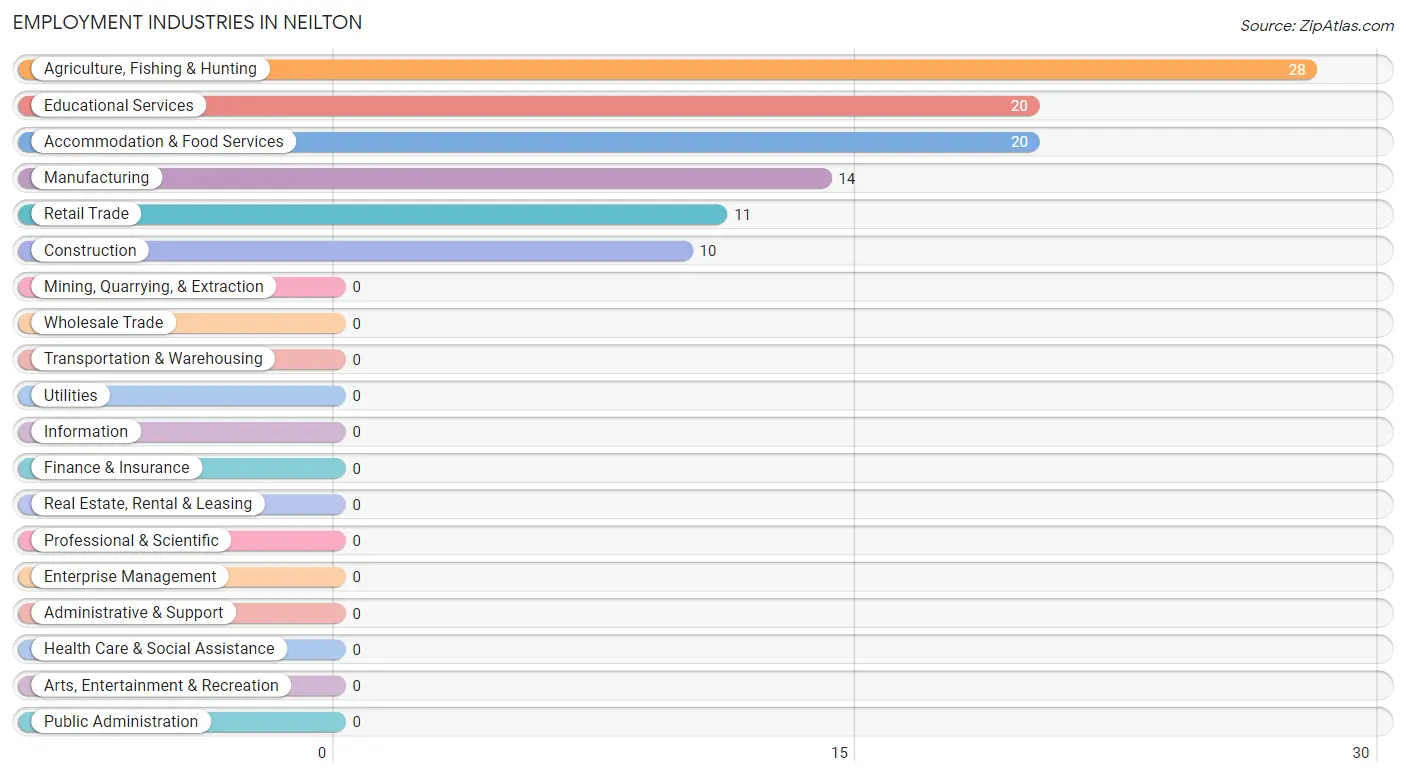
Employment Industries in Neilton
The major employment industries in Neilton include Agriculture, Fishing & Hunting (28 | 27.2%), Educational Services (20 | 19.4%), Accommodation & Food Services (20 | 19.4%), Manufacturing (14 | 13.6%), and Retail Trade (11 | 10.7%).
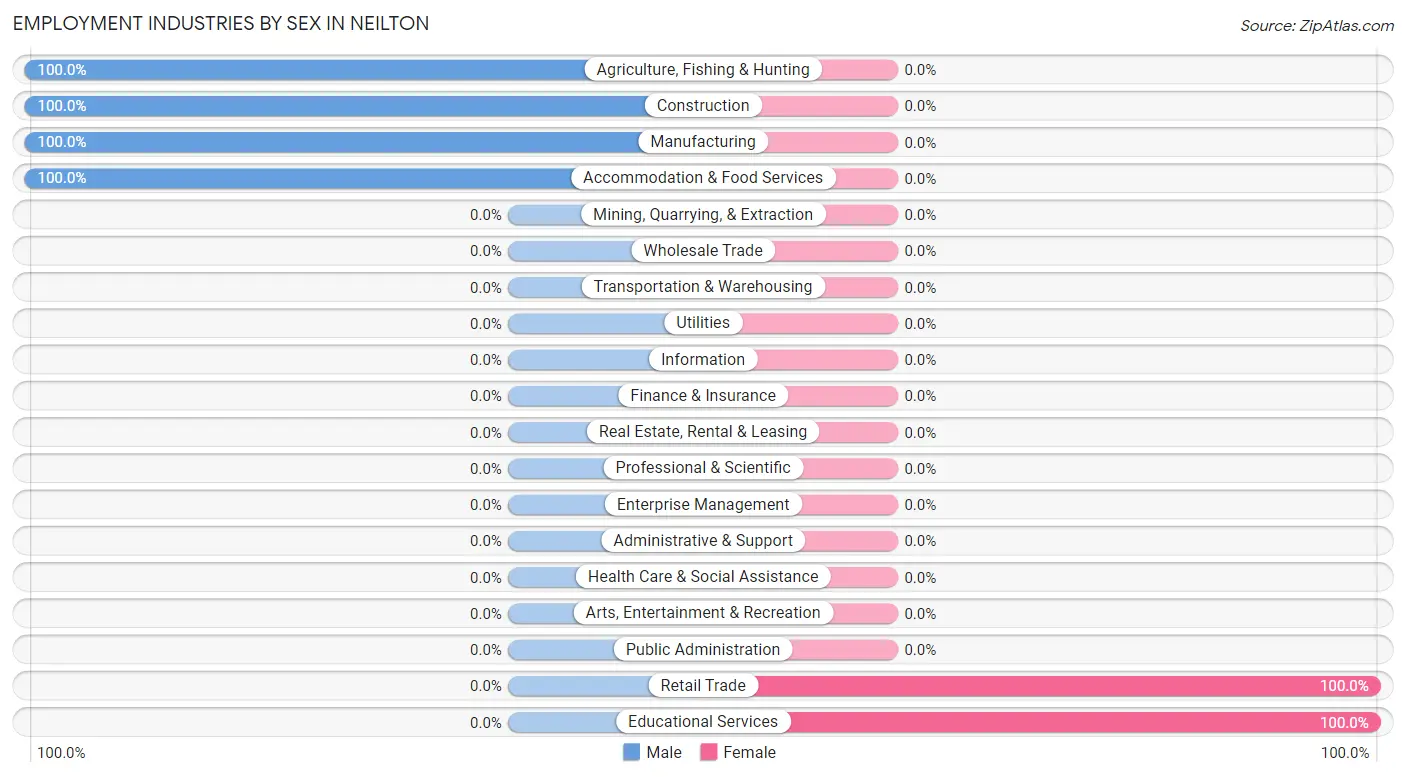
Employment Industries by Sex in Neilton
The Neilton industries that see more men than women are Agriculture, Fishing & Hunting (100.0%), Construction (100.0%), and Manufacturing (100.0%), whereas the industries that tend to have a higher number of women are Retail Trade (100.0%), and Educational Services (100.0%).
| Industry | Male | Female |
| Agriculture, Fishing & Hunting | 28 (100.0%) | 0 (0.0%) |
| Mining, Quarrying, & Extraction | 0 (0.0%) | 0 (0.0%) |
| Construction | 10 (100.0%) | 0 (0.0%) |
| Manufacturing | 14 (100.0%) | 0 (0.0%) |
| Wholesale Trade | 0 (0.0%) | 0 (0.0%) |
| Retail Trade | 0 (0.0%) | 11 (100.0%) |
| Transportation & Warehousing | 0 (0.0%) | 0 (0.0%) |
| Utilities | 0 (0.0%) | 0 (0.0%) |
| Information | 0 (0.0%) | 0 (0.0%) |
| Finance & Insurance | 0 (0.0%) | 0 (0.0%) |
| Real Estate, Rental & Leasing | 0 (0.0%) | 0 (0.0%) |
| Professional & Scientific | 0 (0.0%) | 0 (0.0%) |
| Enterprise Management | 0 (0.0%) | 0 (0.0%) |
| Administrative & Support | 0 (0.0%) | 0 (0.0%) |
| Educational Services | 0 (0.0%) | 20 (100.0%) |
| Health Care & Social Assistance | 0 (0.0%) | 0 (0.0%) |
| Arts, Entertainment & Recreation | 0 (0.0%) | 0 (0.0%) |
| Accommodation & Food Services | 20 (100.0%) | 0 (0.0%) |
| Public Administration | 0 (0.0%) | 0 (0.0%) |
| Total | 72 (69.9%) | 31 (30.1%) |
Education in Neilton
School Enrollment in Neilton
The most common levels of schooling among the 59 students in Neilton are elementary school (41 | 69.5%), middle school (14 | 23.7%), and kindergarten (4 | 6.8%).
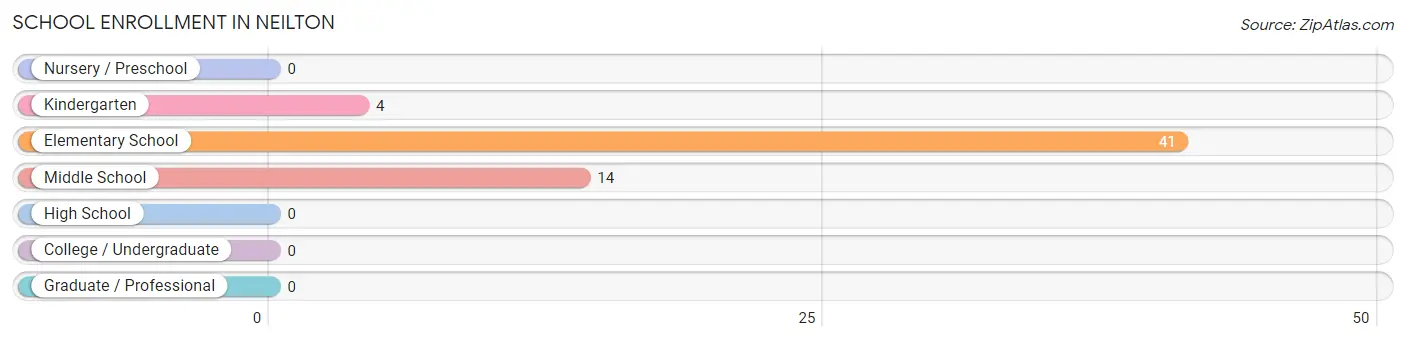
| School Level | # Students | % Students |
| Nursery / Preschool | 0 | 0.0% |
| Kindergarten | 4 | 6.8% |
| Elementary School | 41 | 69.5% |
| Middle School | 14 | 23.7% |
| High School | 0 | 0.0% |
| College / Undergraduate | 0 | 0.0% |
| Graduate / Professional | 0 | 0.0% |
| Total | 59 | 100.0% |
School Enrollment by Age by Funding Source in Neilton
Out of a total of 59 students who are enrolled in schools in Neilton, 9 (15.3%) attend a private institution, while the remaining 50 (84.7%) are enrolled in public schools. The age group of 10 to 14 year olds has the highest likelihood of being enrolled in private schools, with 3 (21.4% in the age bracket) enrolled. Conversely, the age group of 5 to 9 year old has the lowest likelihood of being enrolled in a private school, with 39 (86.7% in the age bracket) attending a public institution.
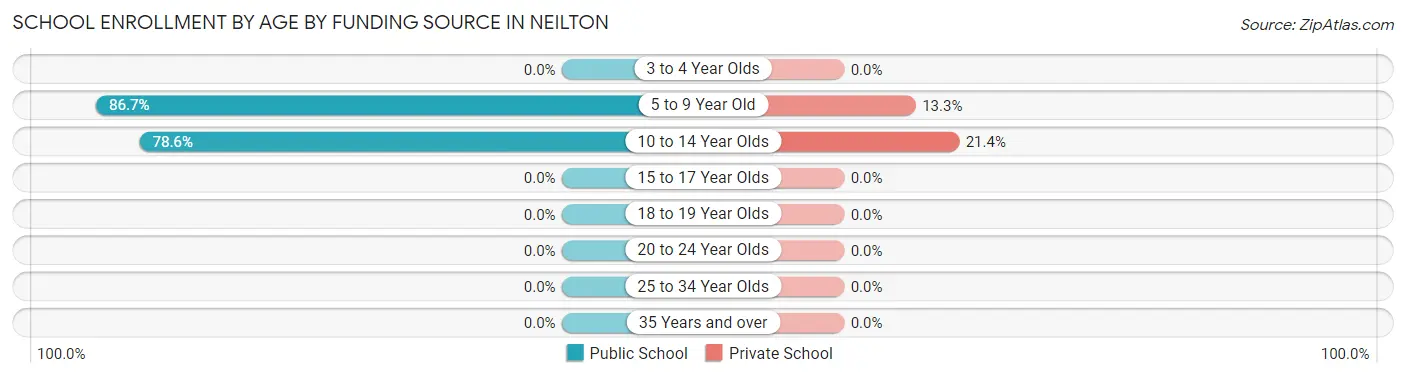
| Age Bracket | Public School | Private School |
| 3 to 4 Year Olds | 0 (0.0%) | 0 (0.0%) |
| 5 to 9 Year Old | 39 (86.7%) | 6 (13.3%) |
| 10 to 14 Year Olds | 11 (78.6%) | 3 (21.4%) |
| 15 to 17 Year Olds | 0 (0.0%) | 0 (0.0%) |
| 18 to 19 Year Olds | 0 (0.0%) | 0 (0.0%) |
| 20 to 24 Year Olds | 0 (0.0%) | 0 (0.0%) |
| 25 to 34 Year Olds | 0 (0.0%) | 0 (0.0%) |
| 35 Years and over | 0 (0.0%) | 0 (0.0%) |
| Total | 50 (84.7%) | 9 (15.3%) |
Educational Attainment by Field of Study in Neilton
, and education (7 | 100.0%) are the most common fields of study among 7 individuals in Neilton who have obtained a bachelor's degree or higher.
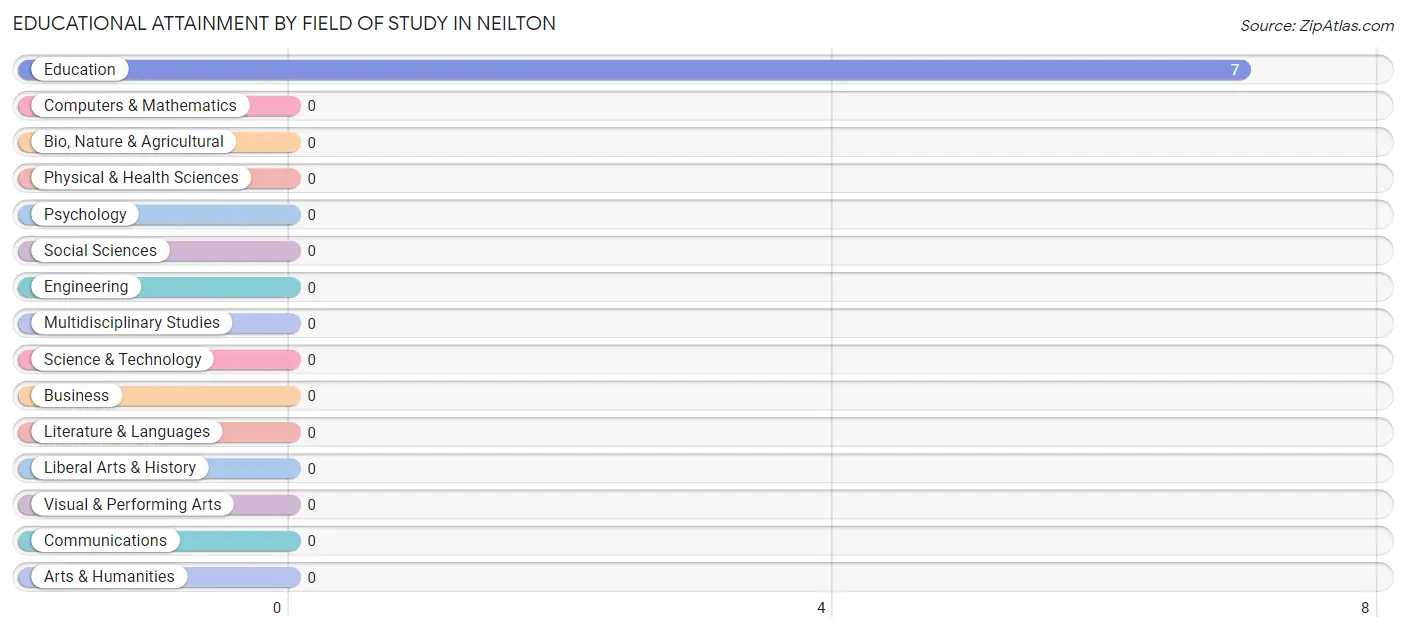
| Field of Study | # Graduates | % Graduates |
| Computers & Mathematics | 0 | 0.0% |
| Bio, Nature & Agricultural | 0 | 0.0% |
| Physical & Health Sciences | 0 | 0.0% |
| Psychology | 0 | 0.0% |
| Social Sciences | 0 | 0.0% |
| Engineering | 0 | 0.0% |
| Multidisciplinary Studies | 0 | 0.0% |
| Science & Technology | 0 | 0.0% |
| Business | 0 | 0.0% |
| Education | 7 | 100.0% |
| Literature & Languages | 0 | 0.0% |
| Liberal Arts & History | 0 | 0.0% |
| Visual & Performing Arts | 0 | 0.0% |
| Communications | 0 | 0.0% |
| Arts & Humanities | 0 | 0.0% |
| Total | 7 | 100.0% |
Transportation & Commute in Neilton
Vehicle Availability by Sex in Neilton
The most prevalent vehicle ownership categories in Neilton are males with 2 vehicles (30, accounting for 48.4%) and females with 2 vehicles (9, making up 96.8%).
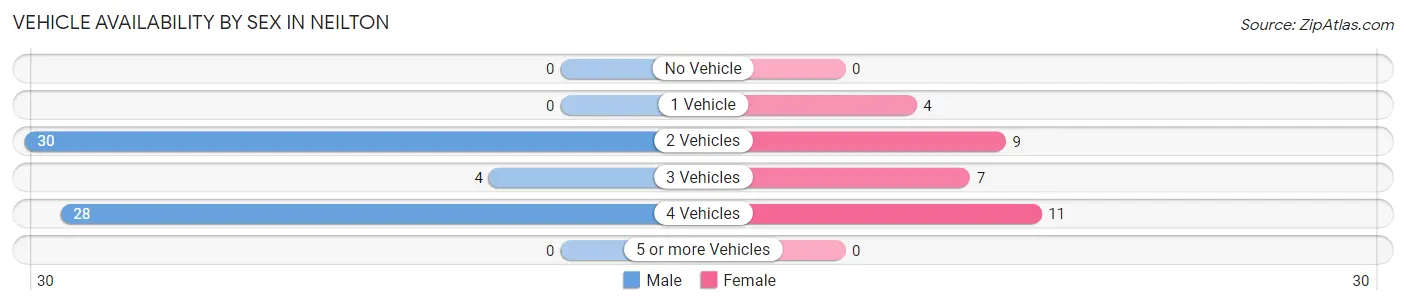
| Vehicles Available | Male | Female |
| No Vehicle | 0 (0.0%) | 0 (0.0%) |
| 1 Vehicle | 0 (0.0%) | 4 (12.9%) |
| 2 Vehicles | 30 (48.4%) | 9 (29.0%) |
| 3 Vehicles | 4 (6.5%) | 7 (22.6%) |
| 4 Vehicles | 28 (45.2%) | 11 (35.5%) |
| 5 or more Vehicles | 0 (0.0%) | 0 (0.0%) |
| Total | 62 (100.0%) | 31 (100.0%) |
Commute Time in Neilton
The most frequently occuring commute durations in Neilton are 10 to 14 minutes (29 commuters, 31.2%), 15 to 19 minutes (28 commuters, 30.1%), and 30 to 34 minutes (10 commuters, 10.7%).
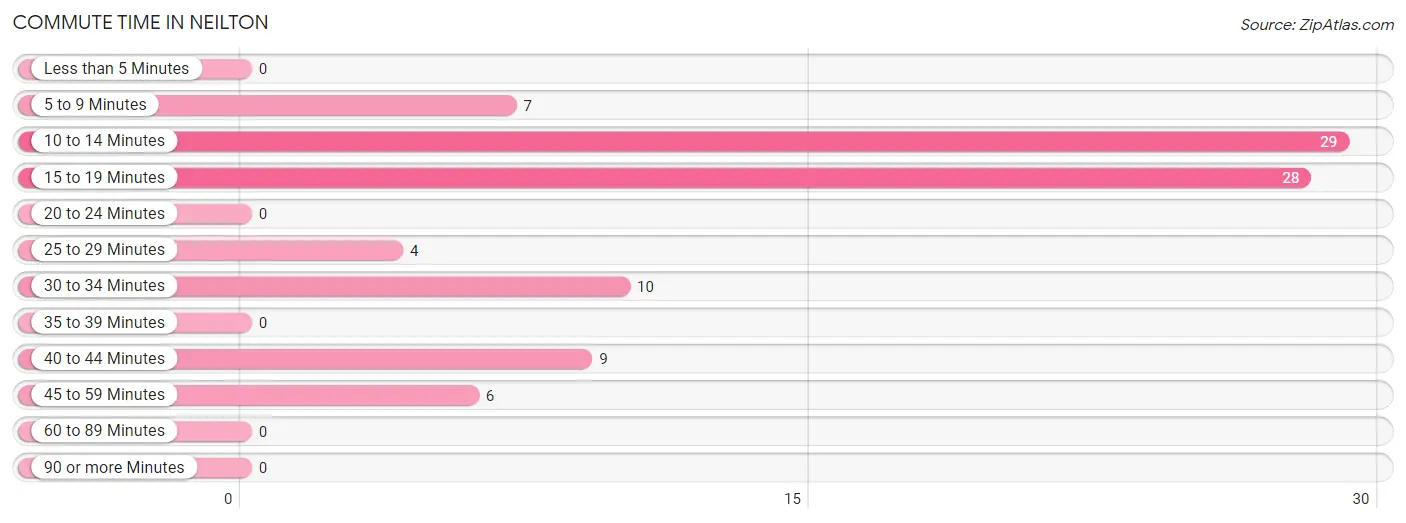
| Commute Time | # Commuters | % Commuters |
| Less than 5 Minutes | 0 | 0.0% |
| 5 to 9 Minutes | 7 | 7.5% |
| 10 to 14 Minutes | 29 | 31.2% |
| 15 to 19 Minutes | 28 | 30.1% |
| 20 to 24 Minutes | 0 | 0.0% |
| 25 to 29 Minutes | 4 | 4.3% |
| 30 to 34 Minutes | 10 | 10.7% |
| 35 to 39 Minutes | 0 | 0.0% |
| 40 to 44 Minutes | 9 | 9.7% |
| 45 to 59 Minutes | 6 | 6.5% |
| 60 to 89 Minutes | 0 | 0.0% |
| 90 or more Minutes | 0 | 0.0% |
Commute Time by Sex in Neilton
The most common commute times in Neilton are 15 to 19 minutes (28 commuters, 45.2%) for males and 10 to 14 minutes (11 commuters, 35.5%) for females.
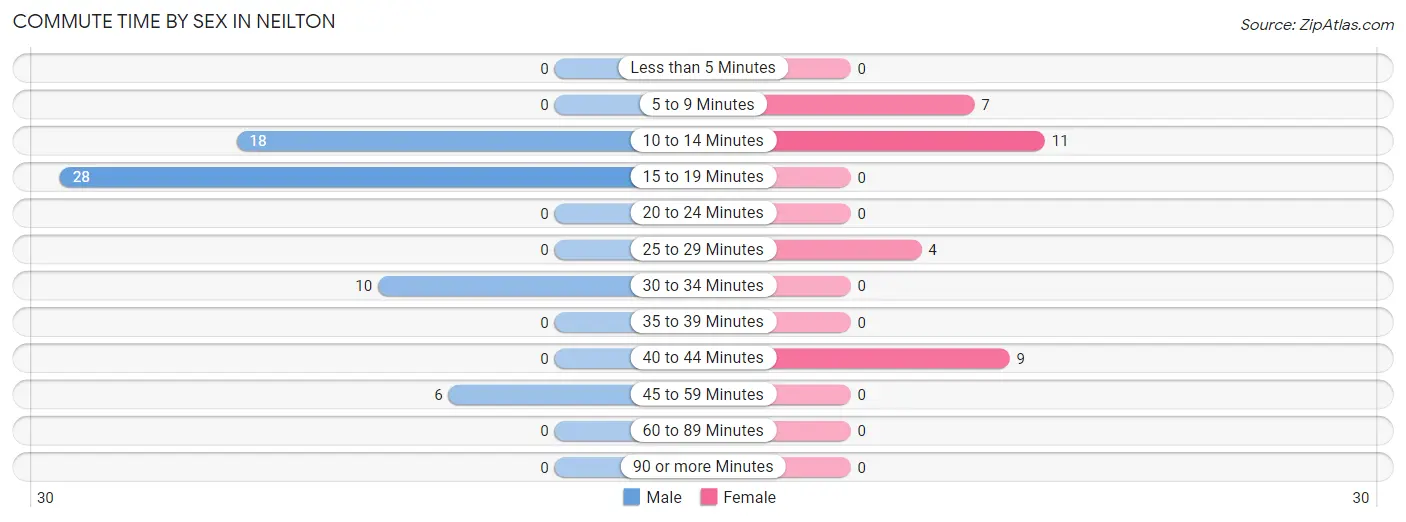
| Commute Time | Male | Female |
| Less than 5 Minutes | 0 (0.0%) | 0 (0.0%) |
| 5 to 9 Minutes | 0 (0.0%) | 7 (22.6%) |
| 10 to 14 Minutes | 18 (29.0%) | 11 (35.5%) |
| 15 to 19 Minutes | 28 (45.2%) | 0 (0.0%) |
| 20 to 24 Minutes | 0 (0.0%) | 0 (0.0%) |
| 25 to 29 Minutes | 0 (0.0%) | 4 (12.9%) |
| 30 to 34 Minutes | 10 (16.1%) | 0 (0.0%) |
| 35 to 39 Minutes | 0 (0.0%) | 0 (0.0%) |
| 40 to 44 Minutes | 0 (0.0%) | 9 (29.0%) |
| 45 to 59 Minutes | 6 (9.7%) | 0 (0.0%) |
| 60 to 89 Minutes | 0 (0.0%) | 0 (0.0%) |
| 90 or more Minutes | 0 (0.0%) | 0 (0.0%) |
Time of Departure to Work by Sex in Neilton
The most frequent times of departure to work in Neilton are 5:30 AM to 5:59 AM (28, 45.2%) for males and 7:00 AM to 7:29 AM (12, 38.7%) for females.
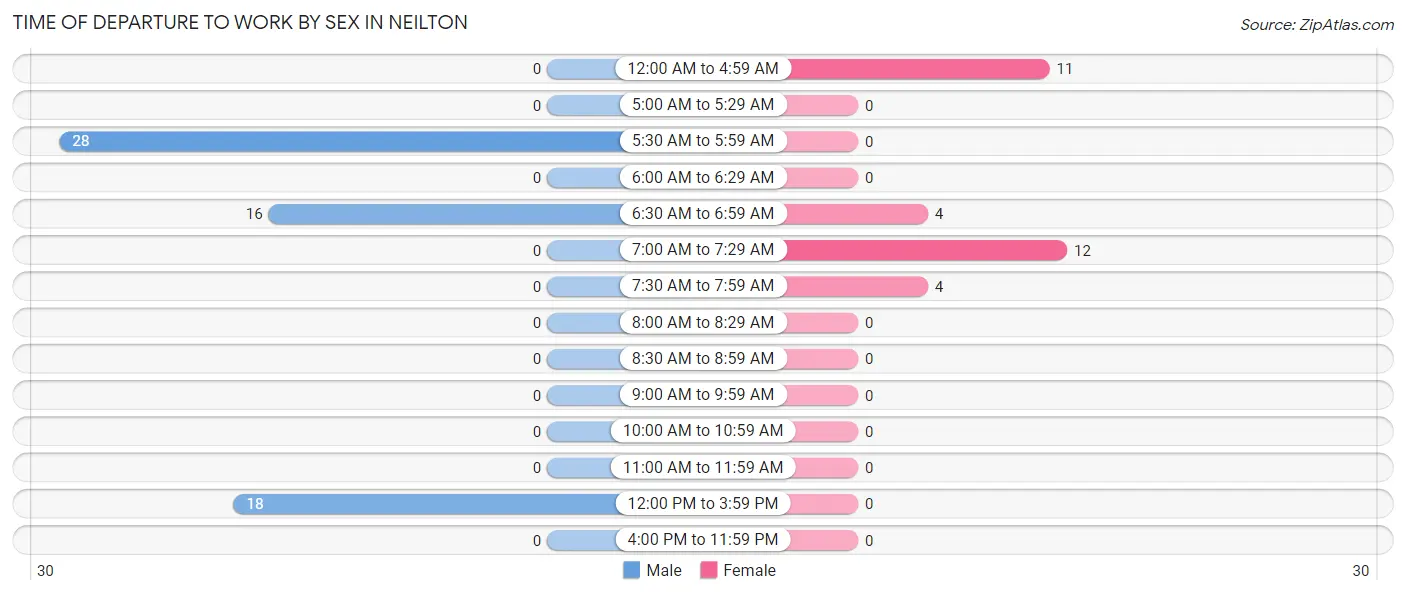
| Time of Departure | Male | Female |
| 12:00 AM to 4:59 AM | 0 (0.0%) | 11 (35.5%) |
| 5:00 AM to 5:29 AM | 0 (0.0%) | 0 (0.0%) |
| 5:30 AM to 5:59 AM | 28 (45.2%) | 0 (0.0%) |
| 6:00 AM to 6:29 AM | 0 (0.0%) | 0 (0.0%) |
| 6:30 AM to 6:59 AM | 16 (25.8%) | 4 (12.9%) |
| 7:00 AM to 7:29 AM | 0 (0.0%) | 12 (38.7%) |
| 7:30 AM to 7:59 AM | 0 (0.0%) | 4 (12.9%) |
| 8:00 AM to 8:29 AM | 0 (0.0%) | 0 (0.0%) |
| 8:30 AM to 8:59 AM | 0 (0.0%) | 0 (0.0%) |
| 9:00 AM to 9:59 AM | 0 (0.0%) | 0 (0.0%) |
| 10:00 AM to 10:59 AM | 0 (0.0%) | 0 (0.0%) |
| 11:00 AM to 11:59 AM | 0 (0.0%) | 0 (0.0%) |
| 12:00 PM to 3:59 PM | 18 (29.0%) | 0 (0.0%) |
| 4:00 PM to 11:59 PM | 0 (0.0%) | 0 (0.0%) |
| Total | 62 (100.0%) | 31 (100.0%) |
Housing Occupancy in Neilton
Occupancy by Ownership in Neilton
Of the total 91 dwellings in Neilton, owner-occupied units account for 87 (95.6%), while renter-occupied units make up 4 (4.4%).
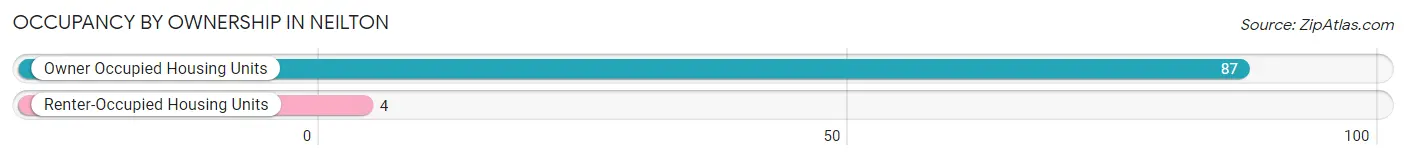
| Occupancy | # Housing Units | % Housing Units |
| Owner Occupied Housing Units | 87 | 95.6% |
| Renter-Occupied Housing Units | 4 | 4.4% |
| Total Occupied Housing Units | 91 | 100.0% |
Occupancy by Household Size in Neilton
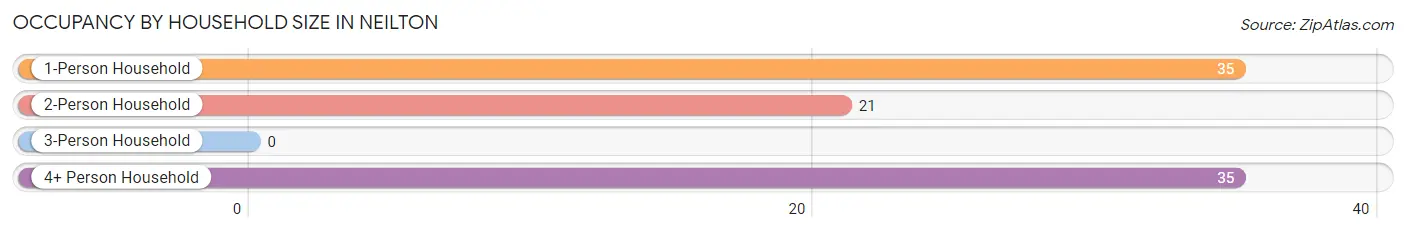
| Household Size | # Housing Units | % Housing Units |
| 1-Person Household | 35 | 38.5% |
| 2-Person Household | 21 | 23.1% |
| 3-Person Household | 0 | 0.0% |
| 4+ Person Household | 35 | 38.5% |
| Total Housing Units | 91 | 100.0% |
Occupancy by Ownership by Household Size in Neilton
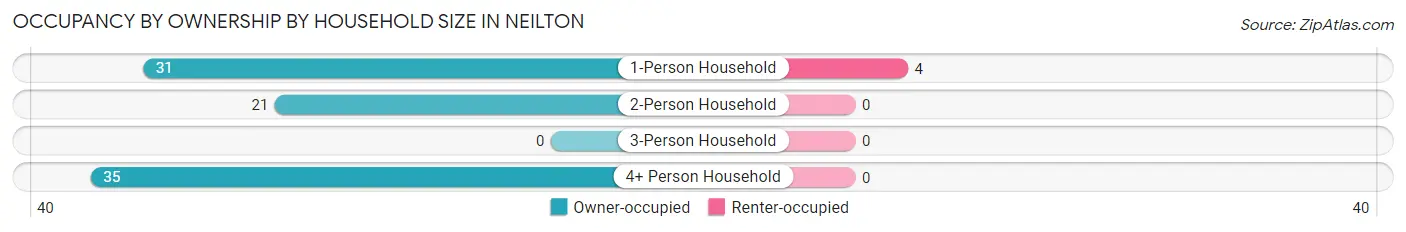
| Household Size | Owner-occupied | Renter-occupied |
| 1-Person Household | 31 (88.6%) | 4 (11.4%) |
| 2-Person Household | 21 (100.0%) | 0 (0.0%) |
| 3-Person Household | 0 (0.0%) | 0 (0.0%) |
| 4+ Person Household | 35 (100.0%) | 0 (0.0%) |
| Total Housing Units | 87 (95.6%) | 4 (4.4%) |
Occupancy by Educational Attainment in Neilton
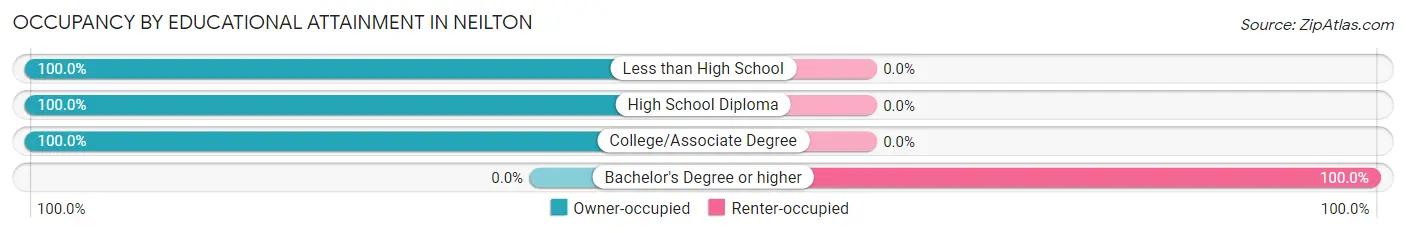
| Household Size | Owner-occupied | Renter-occupied |
| Less than High School | 21 (100.0%) | 0 (0.0%) |
| High School Diploma | 31 (100.0%) | 0 (0.0%) |
| College/Associate Degree | 35 (100.0%) | 0 (0.0%) |
| Bachelor's Degree or higher | 0 (0.0%) | 4 (100.0%) |
Occupancy by Age of Householder in Neilton
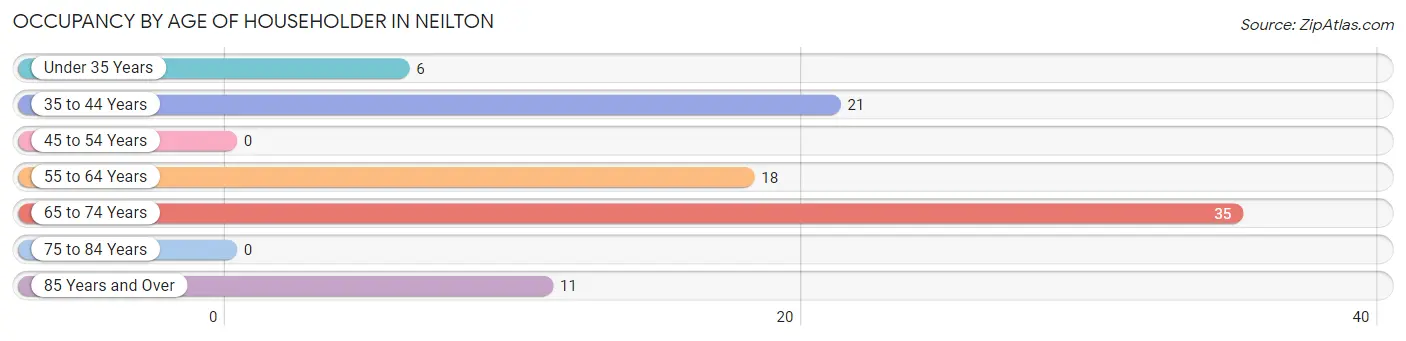
| Age Bracket | # Households | % Households |
| Under 35 Years | 6 | 6.6% |
| 35 to 44 Years | 21 | 23.1% |
| 45 to 54 Years | 0 | 0.0% |
| 55 to 64 Years | 18 | 19.8% |
| 65 to 74 Years | 35 | 38.5% |
| 75 to 84 Years | 0 | 0.0% |
| 85 Years and Over | 11 | 12.1% |
| Total | 91 | 100.0% |
Housing Finances in Neilton
Median Income by Occupancy in Neilton
| Occupancy Type | # Households | Median Income |
| Owner-Occupied | 87 (95.6%) | $0 |
| Renter-Occupied | 4 (4.4%) | $0 |
| Average | 91 (100.0%) | $0 |
Occupancy by Householder Income Bracket in Neilton
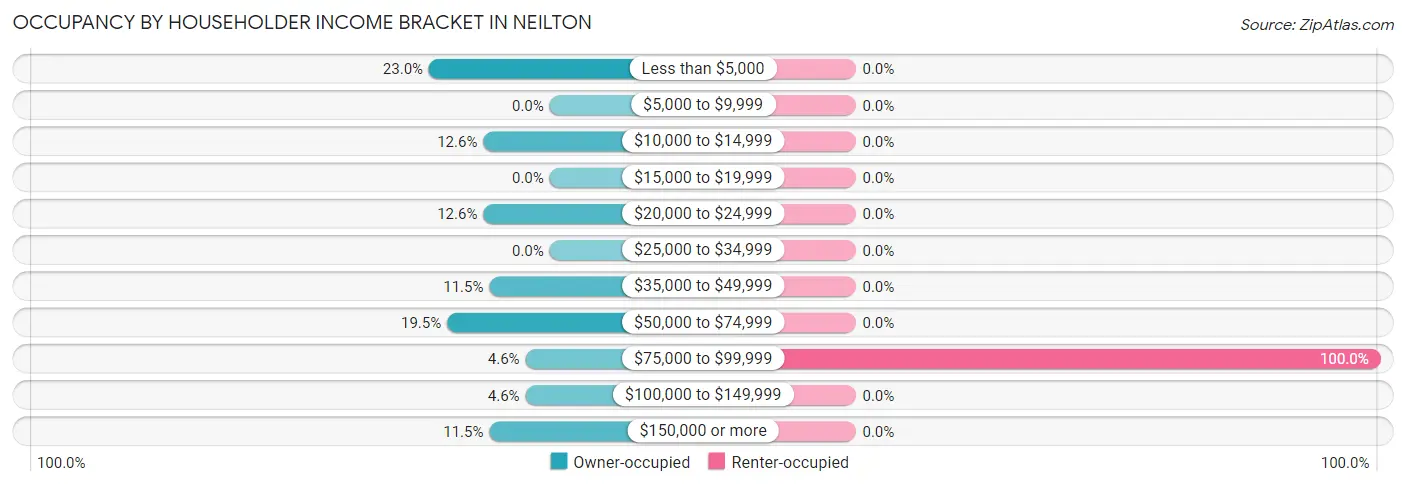
| Income Bracket | Owner-occupied | Renter-occupied |
| Less than $5,000 | 20 (23.0%) | 0 (0.0%) |
| $5,000 to $9,999 | 0 (0.0%) | 0 (0.0%) |
| $10,000 to $14,999 | 11 (12.6%) | 0 (0.0%) |
| $15,000 to $19,999 | 0 (0.0%) | 0 (0.0%) |
| $20,000 to $24,999 | 11 (12.6%) | 0 (0.0%) |
| $25,000 to $34,999 | 0 (0.0%) | 0 (0.0%) |
| $35,000 to $49,999 | 10 (11.5%) | 0 (0.0%) |
| $50,000 to $74,999 | 17 (19.5%) | 0 (0.0%) |
| $75,000 to $99,999 | 4 (4.6%) | 4 (100.0%) |
| $100,000 to $149,999 | 4 (4.6%) | 0 (0.0%) |
| $150,000 or more | 10 (11.5%) | 0 (0.0%) |
| Total | 87 (100.0%) | 4 (100.0%) |
Monthly Housing Cost Tiers in Neilton
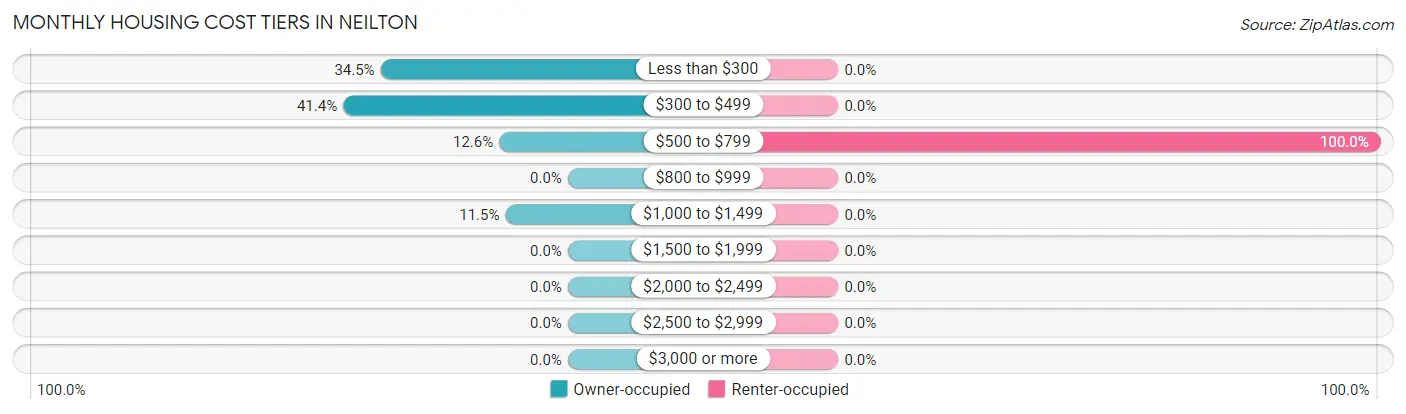
| Monthly Cost | Owner-occupied | Renter-occupied |
| Less than $300 | 30 (34.5%) | 0 (0.0%) |
| $300 to $499 | 36 (41.4%) | 0 (0.0%) |
| $500 to $799 | 11 (12.6%) | 4 (100.0%) |
| $800 to $999 | 0 (0.0%) | 0 (0.0%) |
| $1,000 to $1,499 | 10 (11.5%) | 0 (0.0%) |
| $1,500 to $1,999 | 0 (0.0%) | 0 (0.0%) |
| $2,000 to $2,499 | 0 (0.0%) | 0 (0.0%) |
| $2,500 to $2,999 | 0 (0.0%) | 0 (0.0%) |
| $3,000 or more | 0 (0.0%) | 0 (0.0%) |
| Total | 87 (100.0%) | 4 (100.0%) |
Physical Housing Characteristics in Neilton
Housing Structures in Neilton
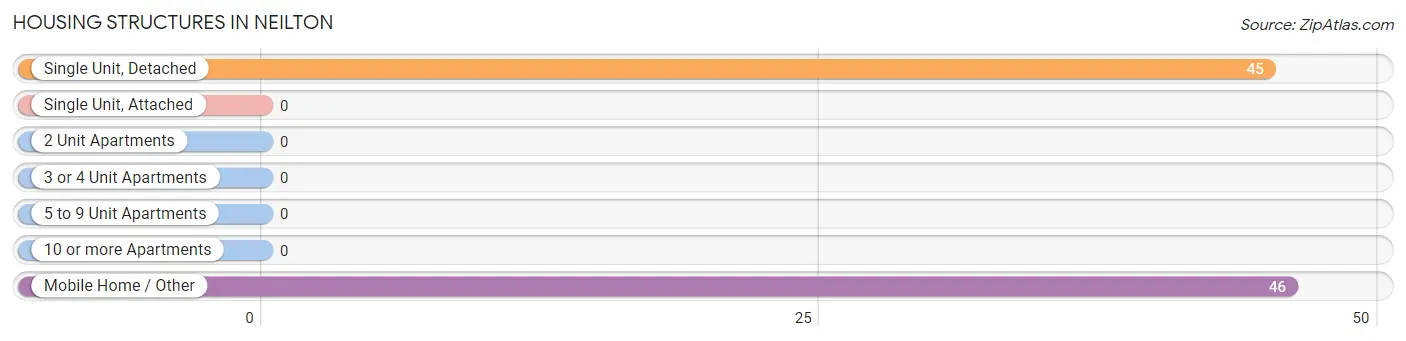
| Structure Type | # Housing Units | % Housing Units |
| Single Unit, Detached | 45 | 49.4% |
| Single Unit, Attached | 0 | 0.0% |
| 2 Unit Apartments | 0 | 0.0% |
| 3 or 4 Unit Apartments | 0 | 0.0% |
| 5 to 9 Unit Apartments | 0 | 0.0% |
| 10 or more Apartments | 0 | 0.0% |
| Mobile Home / Other | 46 | 50.5% |
| Total | 91 | 100.0% |
Housing Structures by Occupancy in Neilton
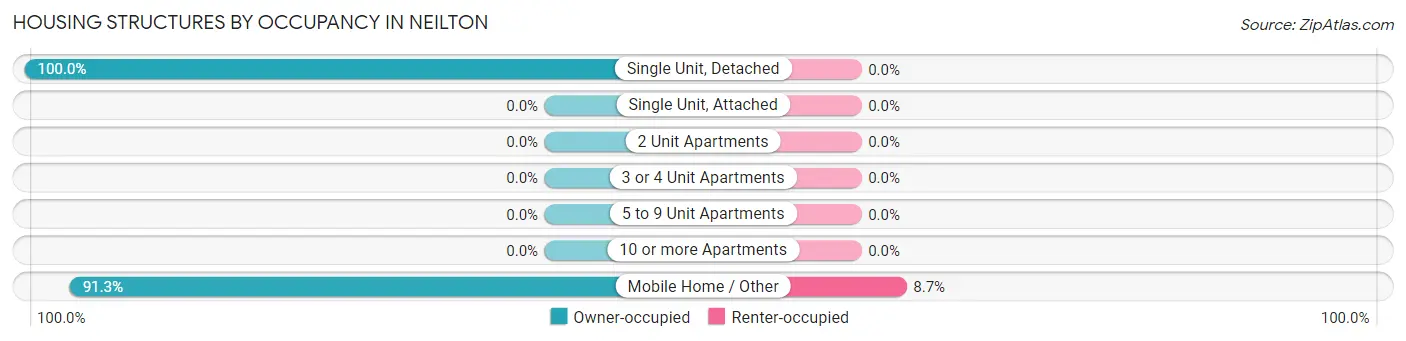
| Structure Type | Owner-occupied | Renter-occupied |
| Single Unit, Detached | 45 (100.0%) | 0 (0.0%) |
| Single Unit, Attached | 0 (0.0%) | 0 (0.0%) |
| 2 Unit Apartments | 0 (0.0%) | 0 (0.0%) |
| 3 or 4 Unit Apartments | 0 (0.0%) | 0 (0.0%) |
| 5 to 9 Unit Apartments | 0 (0.0%) | 0 (0.0%) |
| 10 or more Apartments | 0 (0.0%) | 0 (0.0%) |
| Mobile Home / Other | 42 (91.3%) | 4 (8.7%) |
| Total | 87 (95.6%) | 4 (4.4%) |
Housing Structures by Number of Rooms in Neilton
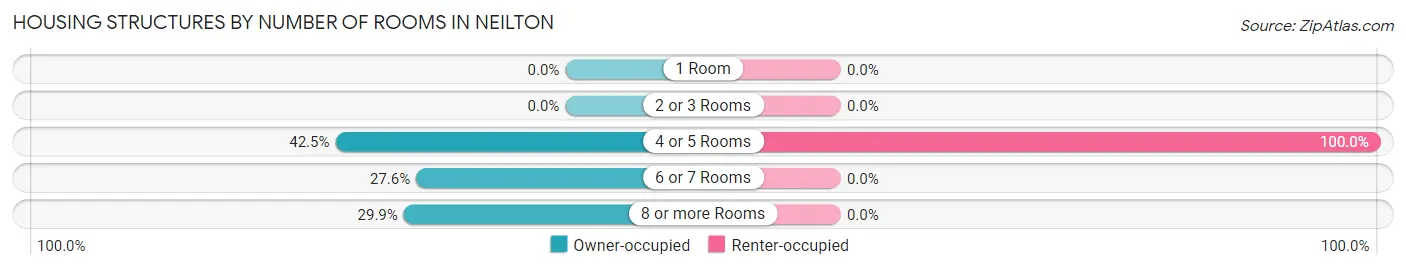
| Number of Rooms | Owner-occupied | Renter-occupied |
| 1 Room | 0 (0.0%) | 0 (0.0%) |
| 2 or 3 Rooms | 0 (0.0%) | 0 (0.0%) |
| 4 or 5 Rooms | 37 (42.5%) | 4 (100.0%) |
| 6 or 7 Rooms | 24 (27.6%) | 0 (0.0%) |
| 8 or more Rooms | 26 (29.9%) | 0 (0.0%) |
| Total | 87 (100.0%) | 4 (100.0%) |
Housing Structure by Heating Type in Neilton
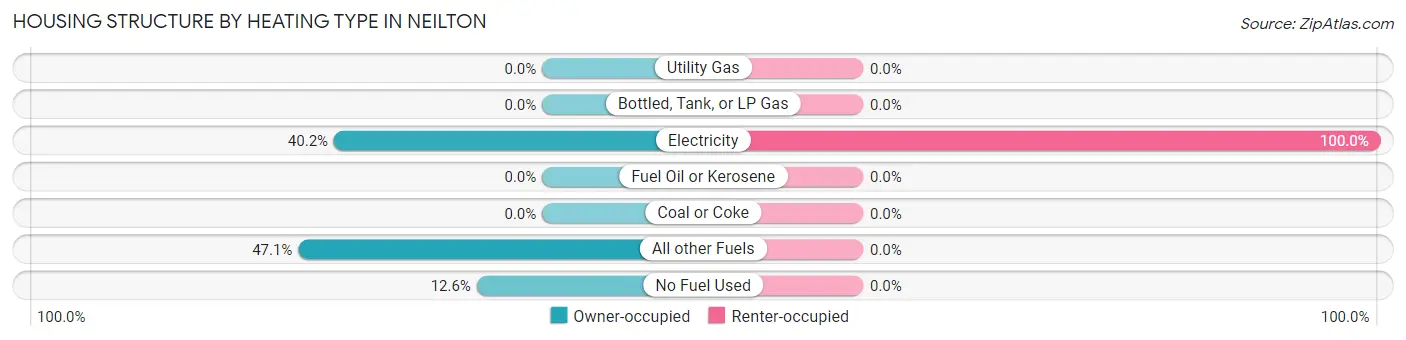
| Heating Type | Owner-occupied | Renter-occupied |
| Utility Gas | 0 (0.0%) | 0 (0.0%) |
| Bottled, Tank, or LP Gas | 0 (0.0%) | 0 (0.0%) |
| Electricity | 35 (40.2%) | 4 (100.0%) |
| Fuel Oil or Kerosene | 0 (0.0%) | 0 (0.0%) |
| Coal or Coke | 0 (0.0%) | 0 (0.0%) |
| All other Fuels | 41 (47.1%) | 0 (0.0%) |
| No Fuel Used | 11 (12.6%) | 0 (0.0%) |
| Total | 87 (100.0%) | 4 (100.0%) |
Household Vehicle Usage in Neilton
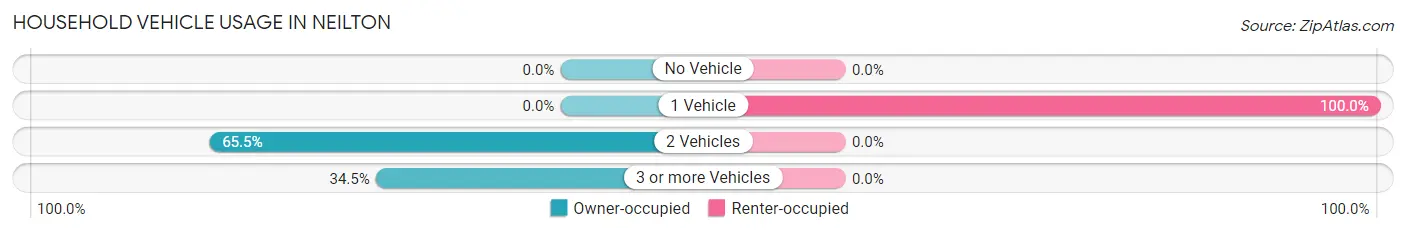
| Vehicles per Household | Owner-occupied | Renter-occupied |
| No Vehicle | 0 (0.0%) | 0 (0.0%) |
| 1 Vehicle | 0 (0.0%) | 4 (100.0%) |
| 2 Vehicles | 57 (65.5%) | 0 (0.0%) |
| 3 or more Vehicles | 30 (34.5%) | 0 (0.0%) |
| Total | 87 (100.0%) | 4 (100.0%) |
Real Estate & Mortgages in Neilton
Real Estate and Mortgage Overview in Neilton
| Characteristic | Without Mortgage | With Mortgage |
| Housing Units | 77 | 10 |
| Median Property Value | - | - |
| Median Household Income | - | - |
| Monthly Housing Costs | $424 | $0 |
| Real Estate Taxes | - | - |
Property Value by Mortgage Status in Neilton
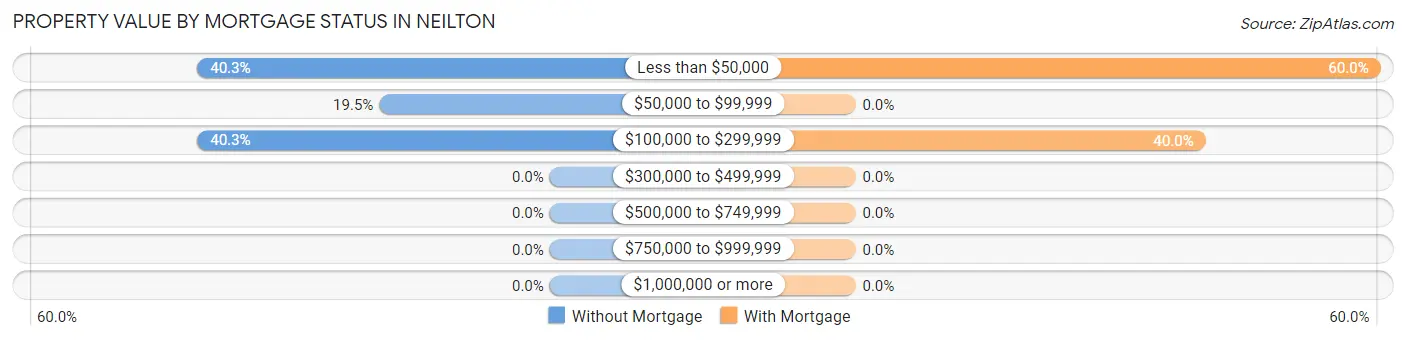
| Property Value | Without Mortgage | With Mortgage |
| Less than $50,000 | 31 (40.3%) | 6 (60.0%) |
| $50,000 to $99,999 | 15 (19.5%) | 0 (0.0%) |
| $100,000 to $299,999 | 31 (40.3%) | 4 (40.0%) |
| $300,000 to $499,999 | 0 (0.0%) | 0 (0.0%) |
| $500,000 to $749,999 | 0 (0.0%) | 0 (0.0%) |
| $750,000 to $999,999 | 0 (0.0%) | 0 (0.0%) |
| $1,000,000 or more | 0 (0.0%) | 0 (0.0%) |
| Total | 77 (100.0%) | 10 (100.0%) |
Household Income by Mortgage Status in Neilton
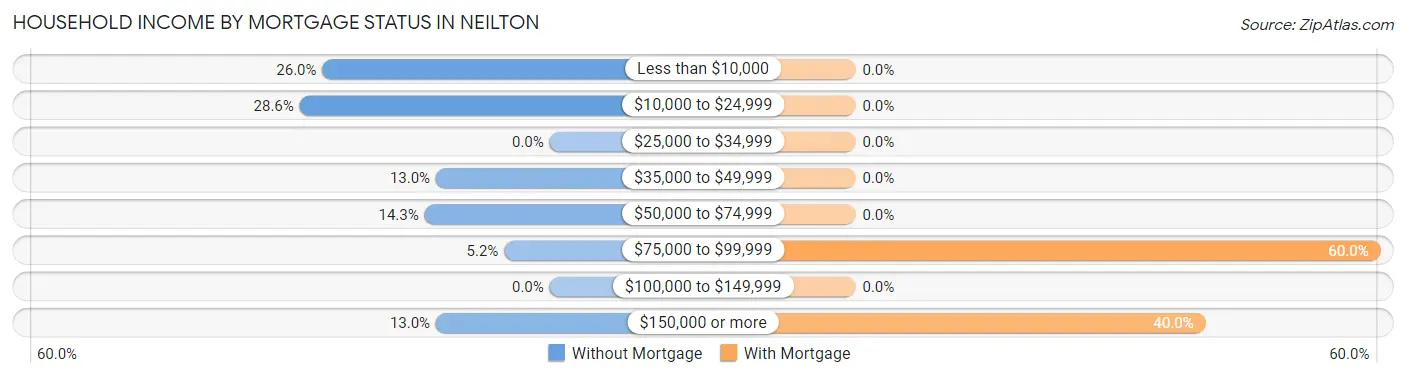
| Household Income | Without Mortgage | With Mortgage |
| Less than $10,000 | 20 (26.0%) | 0 (0.0%) |
| $10,000 to $24,999 | 22 (28.6%) | 0 (0.0%) |
| $25,000 to $34,999 | 0 (0.0%) | 0 (0.0%) |
| $35,000 to $49,999 | 10 (13.0%) | 0 (0.0%) |
| $50,000 to $74,999 | 11 (14.3%) | 0 (0.0%) |
| $75,000 to $99,999 | 4 (5.2%) | 6 (60.0%) |
| $100,000 to $149,999 | 0 (0.0%) | 0 (0.0%) |
| $150,000 or more | 10 (13.0%) | 4 (40.0%) |
| Total | 77 (100.0%) | 10 (100.0%) |
Property Value to Household Income Ratio in Neilton
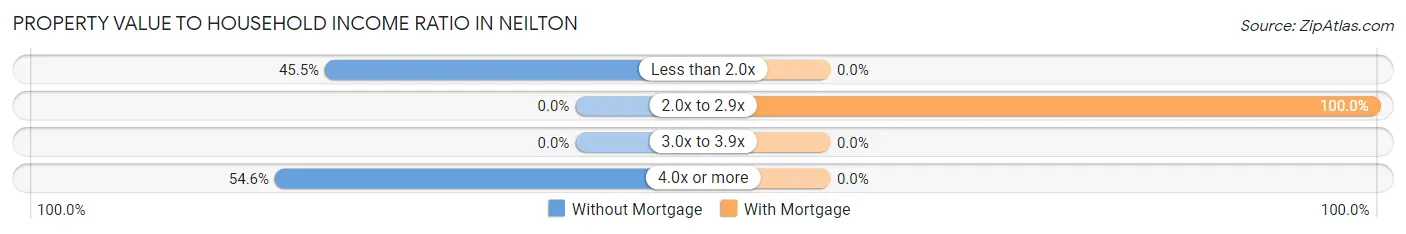
| Value-to-Income Ratio | Without Mortgage | With Mortgage |
| Less than 2.0x | 35 (45.5%) | 0 (0.0%) |
| 2.0x to 2.9x | 0 (0.0%) | 10 (100.0%) |
| 3.0x to 3.9x | 0 (0.0%) | 0 (0.0%) |
| 4.0x or more | 42 (54.5%) | 0 (0.0%) |
| Total | 77 (100.0%) | 10 (100.0%) |
Real Estate Taxes by Mortgage Status in Neilton
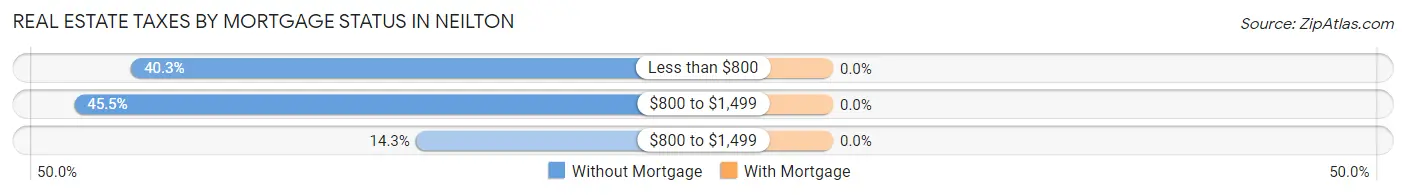
| Property Taxes | Without Mortgage | With Mortgage |
| Less than $800 | 31 (40.3%) | 0 (0.0%) |
| $800 to $1,499 | 35 (45.5%) | 0 (0.0%) |
| $800 to $1,499 | 11 (14.3%) | 0 (0.0%) |
| Total | 77 (100.0%) | 10 (100.0%) |
Health & Disability in Neilton
Health Insurance Coverage by Age in Neilton
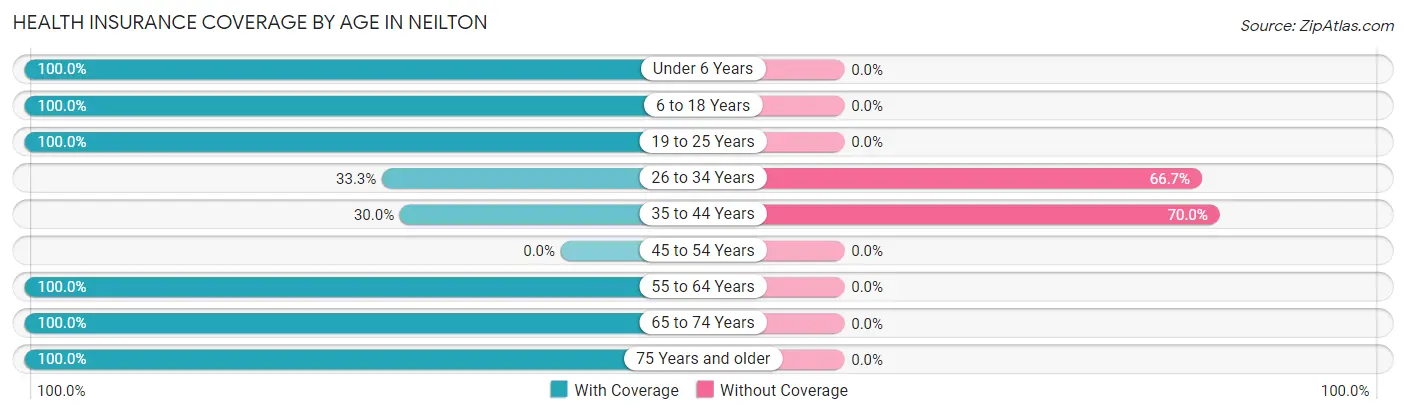
| Age Bracket | With Coverage | Without Coverage |
| Under 6 Years | 25 (100.0%) | 0 (0.0%) |
| 6 to 18 Years | 59 (100.0%) | 0 (0.0%) |
| 19 to 25 Years | 5 (100.0%) | 0 (0.0%) |
| 26 to 34 Years | 12 (33.3%) | 24 (66.7%) |
| 35 to 44 Years | 18 (30.0%) | 42 (70.0%) |
| 45 to 54 Years | 0 (0.0%) | 0 (0.0%) |
| 55 to 64 Years | 30 (100.0%) | 0 (0.0%) |
| 65 to 74 Years | 35 (100.0%) | 0 (0.0%) |
| 75 Years and older | 28 (100.0%) | 0 (0.0%) |
| Total | 212 (76.3%) | 66 (23.7%) |
Health Insurance Coverage by Citizenship Status in Neilton
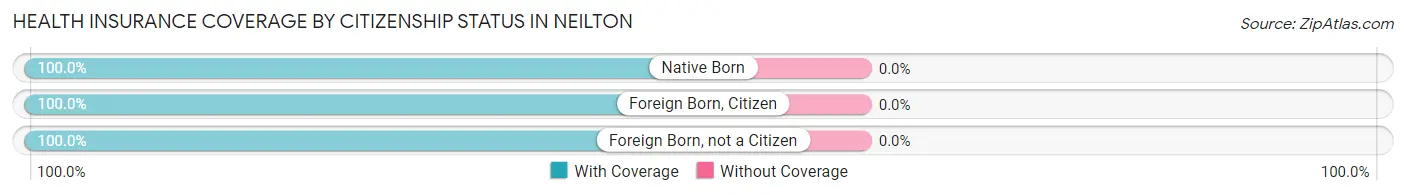
| Citizenship Status | With Coverage | Without Coverage |
| Native Born | 25 (100.0%) | 0 (0.0%) |
| Foreign Born, Citizen | 59 (100.0%) | 0 (0.0%) |
| Foreign Born, not a Citizen | 5 (100.0%) | 0 (0.0%) |
Health Insurance Coverage by Household Income in Neilton
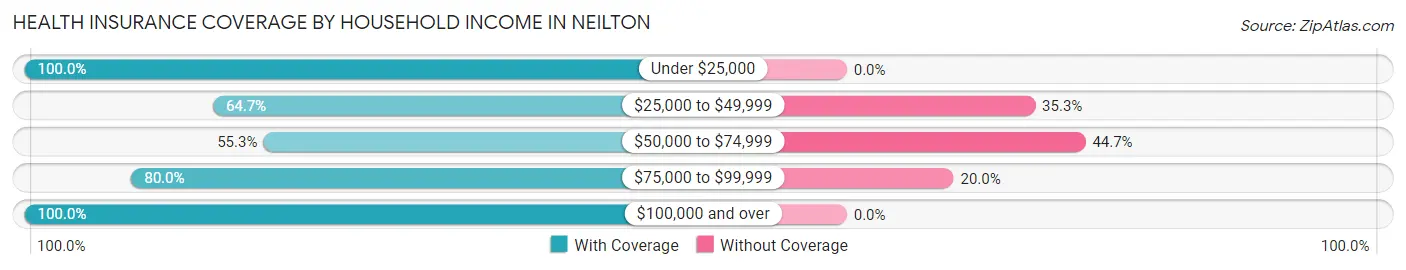
| Household Income | With Coverage | Without Coverage |
| Under $25,000 | 55 (100.0%) | 0 (0.0%) |
| $25,000 to $49,999 | 44 (64.7%) | 24 (35.3%) |
| $50,000 to $74,999 | 47 (55.3%) | 38 (44.7%) |
| $75,000 to $99,999 | 16 (80.0%) | 4 (20.0%) |
| $100,000 and over | 50 (100.0%) | 0 (0.0%) |
Public vs Private Health Insurance Coverage by Age in Neilton
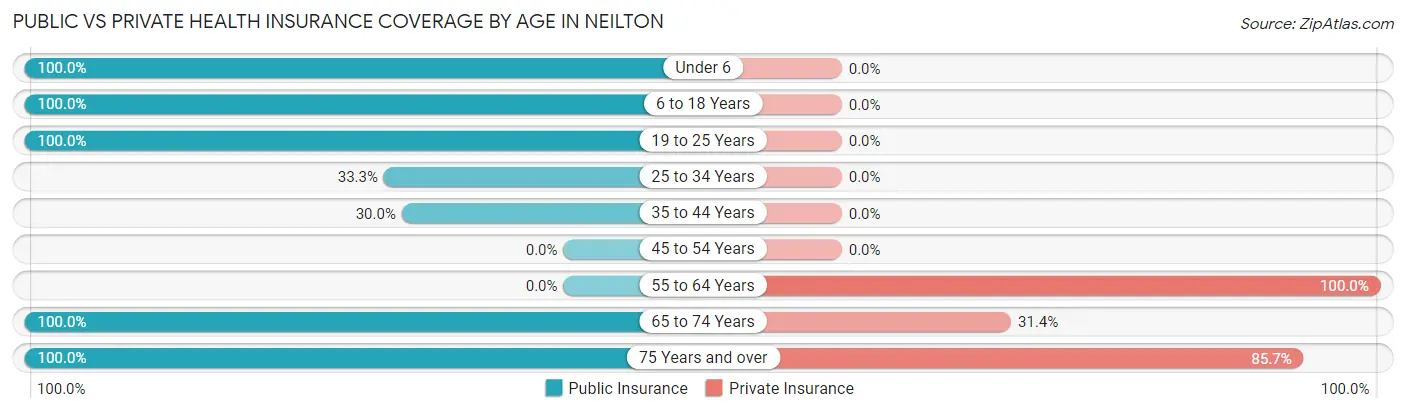
| Age Bracket | Public Insurance | Private Insurance |
| Under 6 | 25 (100.0%) | 0 (0.0%) |
| 6 to 18 Years | 59 (100.0%) | 0 (0.0%) |
| 19 to 25 Years | 5 (100.0%) | 0 (0.0%) |
| 25 to 34 Years | 12 (33.3%) | 0 (0.0%) |
| 35 to 44 Years | 18 (30.0%) | 0 (0.0%) |
| 45 to 54 Years | 0 (0.0%) | 0 (0.0%) |
| 55 to 64 Years | 0 (0.0%) | 30 (100.0%) |
| 65 to 74 Years | 35 (100.0%) | 11 (31.4%) |
| 75 Years and over | 28 (100.0%) | 24 (85.7%) |
| Total | 182 (65.5%) | 65 (23.4%) |
Disability Status by Sex by Age in Neilton
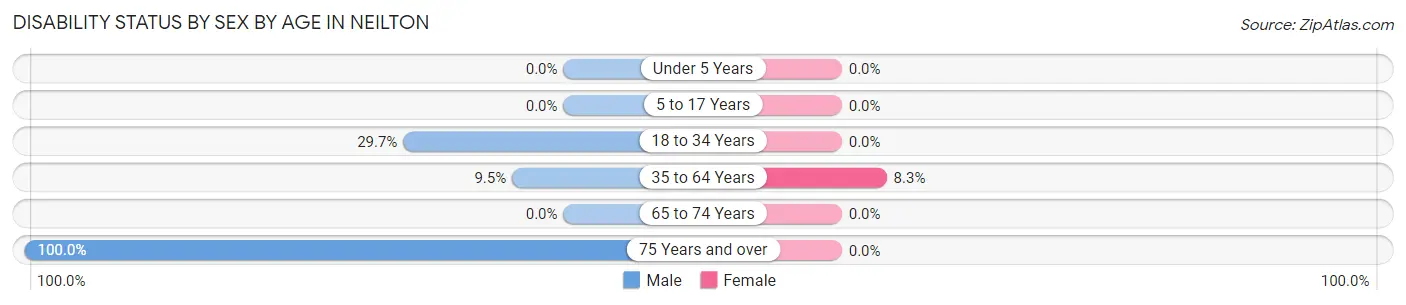
| Age Bracket | Male | Female |
| Under 5 Years | 0 (0.0%) | 0 (0.0%) |
| 5 to 17 Years | 0 (0.0%) | 0 (0.0%) |
| 18 to 34 Years | 11 (29.7%) | 0 (0.0%) |
| 35 to 64 Years | 4 (9.5%) | 4 (8.3%) |
| 65 to 74 Years | 0 (0.0%) | 0 (0.0%) |
| 75 Years and over | 17 (100.0%) | 0 (0.0%) |
Disability Class by Sex by Age in Neilton
Disability Class: Hearing Difficulty
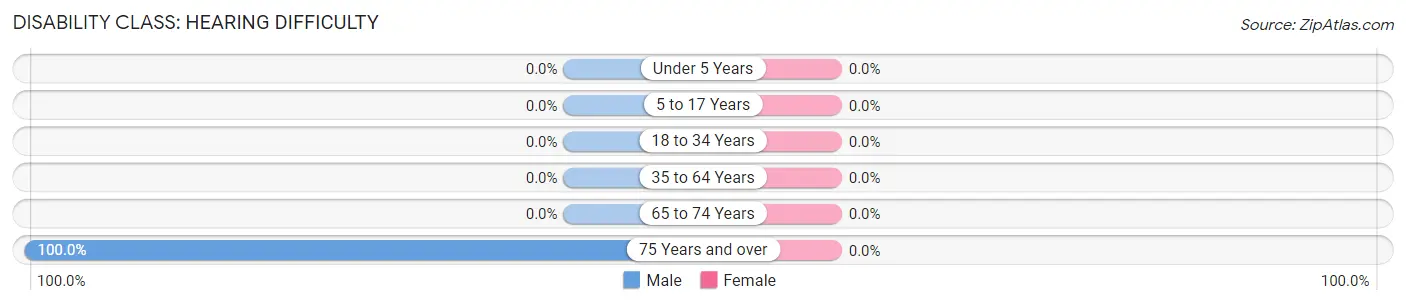
| Age Bracket | Male | Female |
| Under 5 Years | 0 (0.0%) | 0 (0.0%) |
| 5 to 17 Years | 0 (0.0%) | 0 (0.0%) |
| 18 to 34 Years | 0 (0.0%) | 0 (0.0%) |
| 35 to 64 Years | 0 (0.0%) | 0 (0.0%) |
| 65 to 74 Years | 0 (0.0%) | 0 (0.0%) |
| 75 Years and over | 17 (100.0%) | 0 (0.0%) |
Disability Class: Vision Difficulty
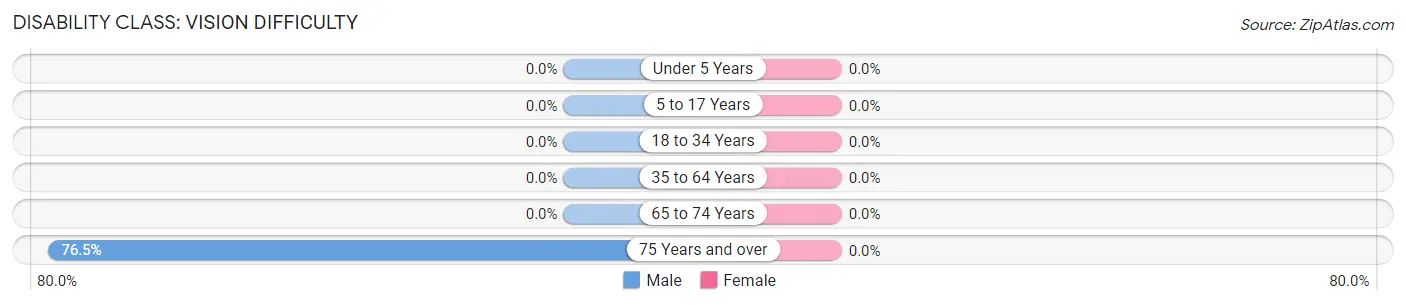
| Age Bracket | Male | Female |
| Under 5 Years | 0 (0.0%) | 0 (0.0%) |
| 5 to 17 Years | 0 (0.0%) | 0 (0.0%) |
| 18 to 34 Years | 0 (0.0%) | 0 (0.0%) |
| 35 to 64 Years | 0 (0.0%) | 0 (0.0%) |
| 65 to 74 Years | 0 (0.0%) | 0 (0.0%) |
| 75 Years and over | 13 (76.5%) | 0 (0.0%) |
Disability Class: Cognitive Difficulty
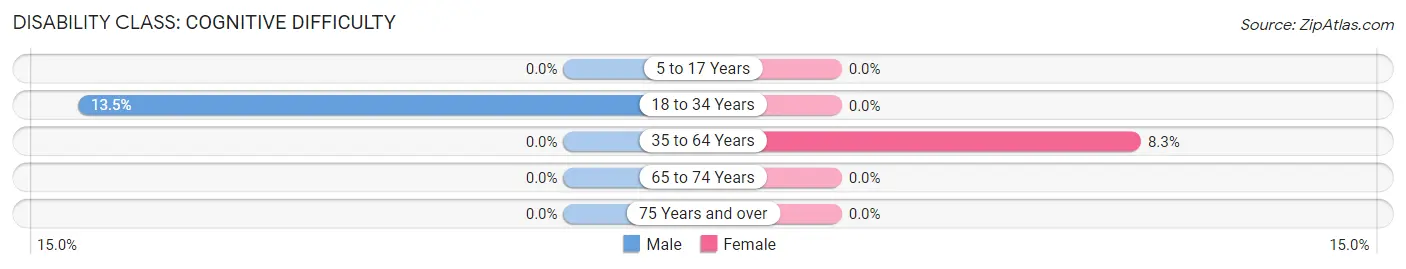
| Age Bracket | Male | Female |
| 5 to 17 Years | 0 (0.0%) | 0 (0.0%) |
| 18 to 34 Years | 5 (13.5%) | 0 (0.0%) |
| 35 to 64 Years | 0 (0.0%) | 4 (8.3%) |
| 65 to 74 Years | 0 (0.0%) | 0 (0.0%) |
| 75 Years and over | 0 (0.0%) | 0 (0.0%) |
Disability Class: Ambulatory Difficulty
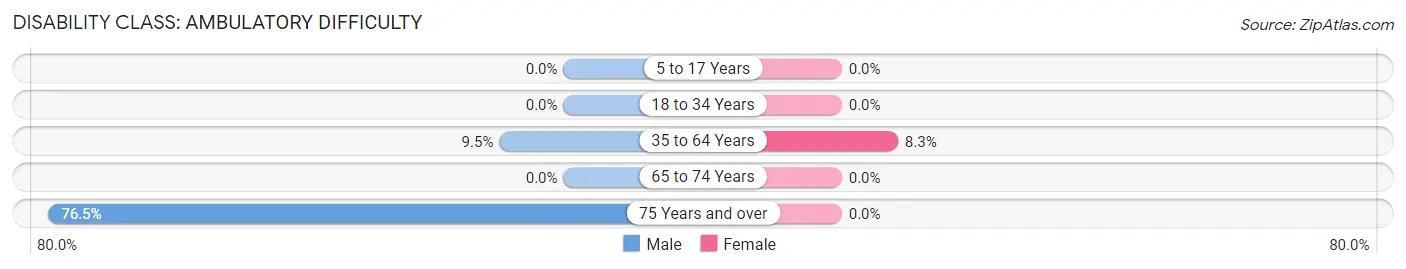
| Age Bracket | Male | Female |
| 5 to 17 Years | 0 (0.0%) | 0 (0.0%) |
| 18 to 34 Years | 0 (0.0%) | 0 (0.0%) |
| 35 to 64 Years | 4 (9.5%) | 4 (8.3%) |
| 65 to 74 Years | 0 (0.0%) | 0 (0.0%) |
| 75 Years and over | 13 (76.5%) | 0 (0.0%) |
Disability Class: Self-Care Difficulty
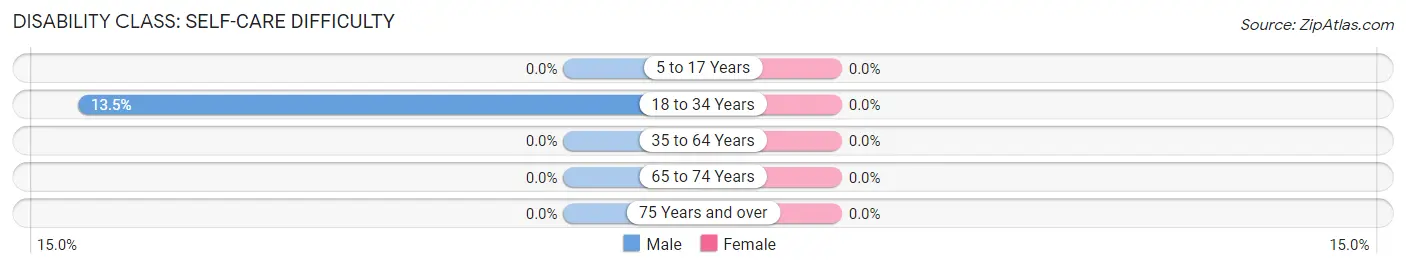
| Age Bracket | Male | Female |
| 5 to 17 Years | 0 (0.0%) | 0 (0.0%) |
| 18 to 34 Years | 5 (13.5%) | 0 (0.0%) |
| 35 to 64 Years | 0 (0.0%) | 0 (0.0%) |
| 65 to 74 Years | 0 (0.0%) | 0 (0.0%) |
| 75 Years and over | 0 (0.0%) | 0 (0.0%) |
Technology Access in Neilton
Computing Device Access in Neilton
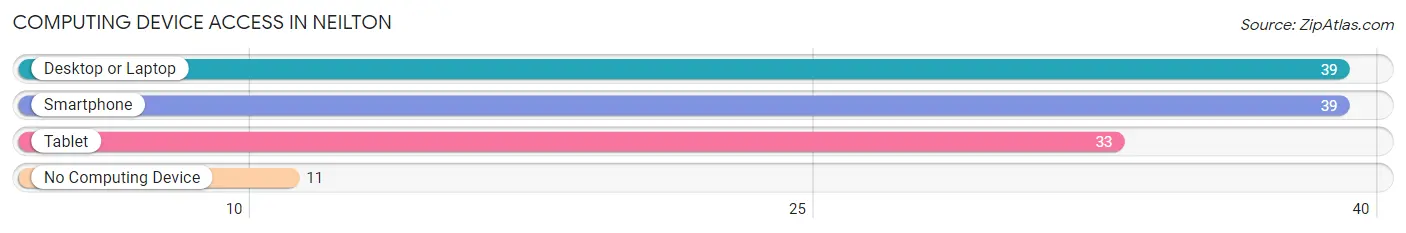
| Device Type | # Households | % Households |
| Desktop or Laptop | 39 | 42.9% |
| Smartphone | 39 | 42.9% |
| Tablet | 33 | 36.3% |
| No Computing Device | 11 | 12.1% |
| Total | 91 | 100.0% |
Internet Access in Neilton
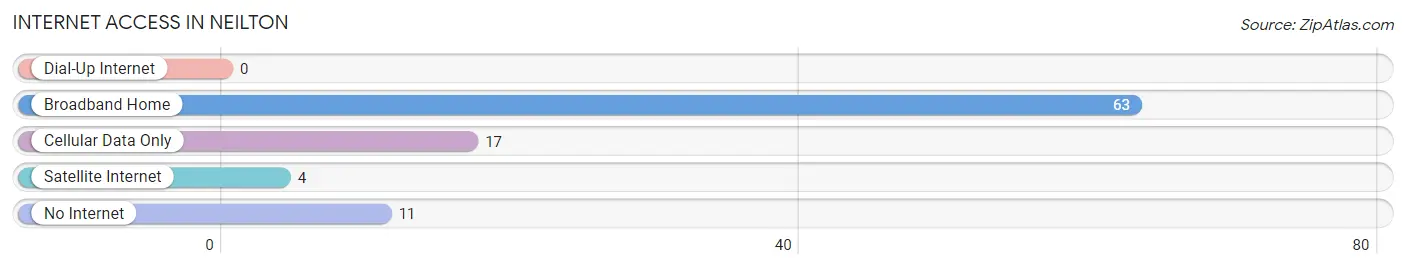
| Internet Type | # Households | % Households |
| Dial-Up Internet | 0 | 0.0% |
| Broadband Home | 63 | 69.2% |
| Cellular Data Only | 17 | 18.7% |
| Satellite Internet | 4 | 4.4% |
| No Internet | 11 | 12.1% |
| Total | 91 | 100.0% |
Neilton Summary
Neilton is a small unincorporated community located in Grays Harbor County, Washington, United States. It is situated in the foothills of the Olympic Mountains, approximately 20 miles east of the Pacific Ocean. Neilton is located in the Quinault Indian Reservation, and is home to the Quinault Indian Nation.
History
Neilton was originally inhabited by the Quinault Indian Nation, who have lived in the area for thousands of years. The Quinault people were a hunter-gatherer society, and relied heavily on the abundant resources of the area for their sustenance. The Quinault people were known for their skill in fishing, hunting, and gathering, and were also known for their basket weaving and cedar bark weaving.
In the late 1800s, settlers began to move into the area, and the Quinault people were forced to relocate to the Quinault Indian Reservation. The reservation was established in 1855, and the Quinault people were given a small portion of land to call their own.
In the early 1900s, Neilton was established as a logging town. The town was named after a local logger, John Neilton, who was one of the first settlers in the area. The town quickly grew, and by the 1920s, it had become a bustling logging community.
Geography
Neilton is located in the foothills of the Olympic Mountains, approximately 20 miles east of the Pacific Ocean. The town is situated in the Quinault Indian Reservation, and is surrounded by lush forests and rolling hills. The nearby Quinault River provides a source of water for the town, and the nearby Quinault Lake is a popular destination for fishing and boating.
The climate in Neilton is mild and temperate, with warm summers and cool winters. The average temperature in the summer is around 70 degrees Fahrenheit, and the average temperature in the winter is around 40 degrees Fahrenheit.
Economy
The economy of Neilton is largely based on logging and tourism. The town is home to several logging companies, and the nearby forests provide a steady source of timber for the local economy. The town is also a popular destination for tourists, who come to enjoy the nearby forests, lakes, and rivers.
The Quinault Indian Nation also plays an important role in the local economy. The tribe operates several businesses in the area, including a casino, a hotel, and a restaurant. The tribe also operates a fish hatchery, which provides a steady source of income for the tribe.
Demographics
As of the 2010 census, the population of Neilton was 1,093. The population is largely made up of Native Americans, with the Quinault Indian Nation making up the majority of the population. The town also has a small population of non-Native Americans, mostly of European descent.
The median household income in Neilton is $30,000, and the median age is 35. The town has a high rate of poverty, with nearly one-third of the population living below the poverty line.
Conclusion
Neilton is a small unincorporated community located in Grays Harbor County, Washington. It is situated in the Quinault Indian Reservation, and is home to the Quinault Indian Nation. The town is largely dependent on logging and tourism for its economy, and the Quinault Indian Nation plays an important role in the local economy. The population of Neilton is largely made up of Native Americans, and the town has a high rate of poverty.
Common Questions
What is Per Capita Income in Neilton?
Per Capita income in Neilton is $25,083.
What is Income or Wage Gap in Neilton?
Income or Wage Gap in Neilton is 5.5%.
Women in Neilton earn 94.5 cents for every dollar earned by a man.
What is Inequality or Gini Index in Neilton?
Inequality or Gini Index in Neilton is 0.63.
What is the Total Population of Neilton?
Total Population of Neilton is 278.
What is the Total Male Population of Neilton?
Total Male Population of Neilton is 173.
What is the Total Female Population of Neilton?
Total Female Population of Neilton is 105.
What is the Ratio of Males per 100 Females in Neilton?
There are 164.76 Males per 100 Females in Neilton.
What is the Ratio of Females per 100 Males in Neilton?
There are 60.69 Females per 100 Males in Neilton.
What is the Median Population Age in Neilton?
Median Population Age in Neilton is 38.3 Years.
What is the Average Family Size in Neilton
Average Family Size in Neilton is 3.3 People.
What is the Average Household Size in Neilton
Average Household Size in Neilton is 3.0 People.
How Large is the Labor Force in Neilton?
There are 103 People in the Labor Forcein in Neilton.
What is the Percentage of People in the Labor Force in Neilton?
53.1% of People are in the Labor Force in Neilton.