Zip Codes with the Highest Percentage of Population with a Degree in Education in New Jersey
RELATED REPORTS & OPTIONS
Education
New Jersey
Compare Zip Codes
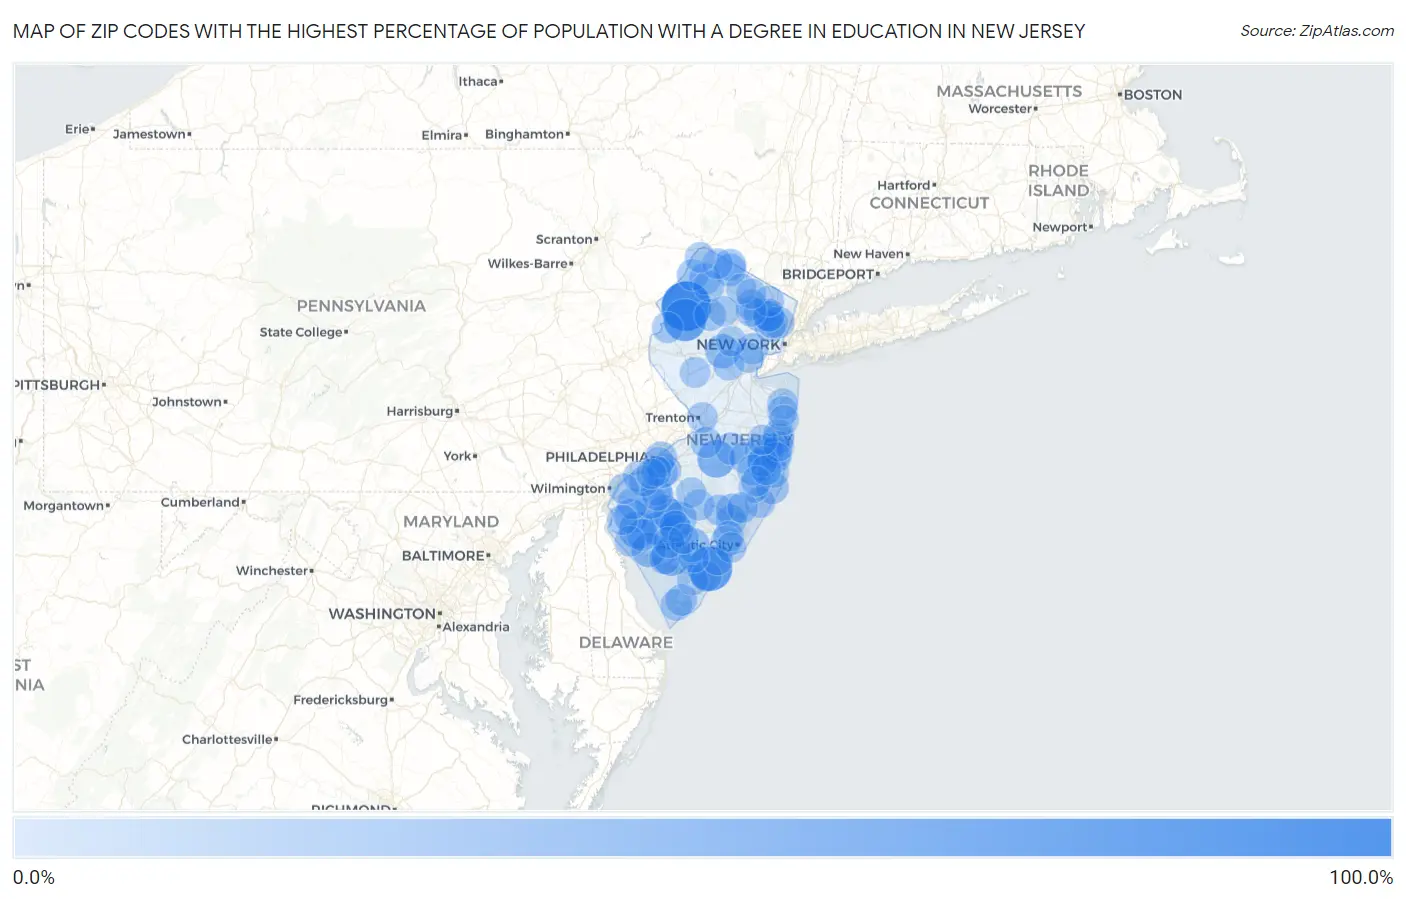
Map of Zip Codes with the Highest Percentage of Population with a Degree in Education in New Jersey
0.0%
100.0%
Zip Codes with the Highest Percentage of Population with a Degree in Education in New Jersey
| Zip Code | % Graduates | vs State | vs National | |
| 1. | 07846 | 100.0% | 10.3%(+89.7)#1 | 11.1%(+88.9)#297 |
| 2. | 08248 | 77.1% | 10.3%(+66.8)#2 | 11.1%(+66.1)#427 |
| 3. | 07880 | 68.2% | 10.3%(+57.8)#3 | 11.1%(+57.1)#533 |
| 4. | 08329 | 54.1% | 10.3%(+43.7)#4 | 11.1%(+43.0)#961 |
| 5. | 08064 | 48.4% | 10.3%(+38.1)#5 | 11.1%(+37.3)#1,314 |
| 6. | 08353 | 44.2% | 10.3%(+33.9)#6 | 11.1%(+33.1)#1,645 |
| 7. | 08311 | 34.6% | 10.3%(+24.3)#7 | 11.1%(+23.5)#3,126 |
| 8. | 08328 | 34.3% | 10.3%(+24.0)#8 | 11.1%(+23.3)#3,180 |
| 9. | 08001 | 34.2% | 10.3%(+23.9)#9 | 11.1%(+23.2)#3,209 |
| 10. | 07939 | 33.9% | 10.3%(+23.5)#10 | 11.1%(+22.8)#3,297 |
| 11. | 08319 | 33.7% | 10.3%(+23.4)#11 | 11.1%(+22.7)#3,340 |
| 12. | 08352 | 31.0% | 10.3%(+20.7)#12 | 11.1%(+20.0)#4,109 |
| 13. | 08326 | 30.4% | 10.3%(+20.1)#13 | 11.1%(+19.4)#4,336 |
| 14. | 08361 | 29.5% | 10.3%(+19.2)#14 | 11.1%(+18.5)#4,651 |
| 15. | 08344 | 27.7% | 10.3%(+17.3)#15 | 11.1%(+16.6)#5,463 |
| 16. | 08224 | 27.3% | 10.3%(+16.9)#16 | 11.1%(+16.2)#5,675 |
| 17. | 07512 | 27.0% | 10.3%(+16.6)#17 | 11.1%(+15.9)#5,802 |
| 18. | 08006 | 26.2% | 10.3%(+15.9)#18 | 11.1%(+15.2)#6,187 |
| 19. | 07462 | 25.8% | 10.3%(+15.4)#19 | 11.1%(+14.7)#6,422 |
| 20. | 08533 | 25.6% | 10.3%(+15.3)#20 | 11.1%(+14.5)#6,527 |
| 21. | 08343 | 25.2% | 10.3%(+14.8)#21 | 11.1%(+14.1)#6,759 |
| 22. | 07418 | 24.4% | 10.3%(+14.1)#22 | 11.1%(+13.4)#7,239 |
| 23. | 07513 | 24.3% | 10.3%(+13.9)#23 | 11.1%(+13.2)#7,351 |
| 24. | 08007 | 23.5% | 10.3%(+13.1)#24 | 11.1%(+12.4)#7,903 |
| 25. | 08302 | 22.8% | 10.3%(+12.4)#25 | 11.1%(+11.7)#8,371 |
| 26. | 08105 | 22.7% | 10.3%(+12.3)#26 | 11.1%(+11.6)#8,437 |
| 27. | 07850 | 22.6% | 10.3%(+12.3)#27 | 11.1%(+11.6)#8,447 |
| 28. | 08721 | 22.4% | 10.3%(+12.0)#28 | 11.1%(+11.3)#8,642 |
| 29. | 07608 | 22.2% | 10.3%(+11.9)#29 | 11.1%(+11.2)#8,793 |
| 30. | 08212 | 22.0% | 10.3%(+11.6)#30 | 11.1%(+10.9)#8,971 |
| 31. | 07822 | 21.9% | 10.3%(+11.5)#31 | 11.1%(+10.8)#9,018 |
| 32. | 08204 | 21.8% | 10.3%(+11.4)#32 | 11.1%(+10.7)#9,112 |
| 33. | 08759 | 21.7% | 10.3%(+11.4)#33 | 11.1%(+10.7)#9,137 |
| 34. | 07014 | 21.4% | 10.3%(+11.1)#34 | 11.1%(+10.4)#9,391 |
| 35. | 07826 | 21.4% | 10.3%(+11.1)#35 | 11.1%(+10.3)#9,398 |
| 36. | 08360 | 21.1% | 10.3%(+10.8)#36 | 11.1%(+10.0)#9,642 |
| 37. | 07848 | 20.7% | 10.3%(+10.3)#37 | 11.1%(+9.59)#9,978 |
| 38. | 08071 | 20.6% | 10.3%(+10.3)#38 | 11.1%(+9.57)#10,000 |
| 39. | 08349 | 20.5% | 10.3%(+10.1)#39 | 11.1%(+9.40)#10,141 |
| 40. | 08332 | 20.4% | 10.3%(+10.1)#40 | 11.1%(+9.37)#10,170 |
| 41. | 08028 | 20.3% | 10.3%(+9.97)#41 | 11.1%(+9.24)#10,272 |
| 42. | 08730 | 20.3% | 10.3%(+9.95)#42 | 11.1%(+9.23)#10,286 |
| 43. | 08241 | 20.2% | 10.3%(+9.87)#43 | 11.1%(+9.14)#10,357 |
| 44. | 07823 | 20.2% | 10.3%(+9.83)#44 | 11.1%(+9.10)#10,396 |
| 45. | 08037 | 20.1% | 10.3%(+9.81)#45 | 11.1%(+9.08)#10,410 |
| 46. | 08735 | 20.1% | 10.3%(+9.72)#46 | 11.1%(+9.00)#10,463 |
| 47. | 07033 | 20.0% | 10.3%(+9.69)#47 | 11.1%(+8.97)#10,484 |
| 48. | 08098 | 19.7% | 10.3%(+9.40)#48 | 11.1%(+8.68)#10,772 |
| 49. | 08022 | 19.7% | 10.3%(+9.37)#49 | 11.1%(+8.64)#10,812 |
| 50. | 08846 | 19.7% | 10.3%(+9.35)#50 | 11.1%(+8.63)#10,829 |
| 51. | 07057 | 19.7% | 10.3%(+9.33)#51 | 11.1%(+8.61)#10,850 |
| 52. | 07444 | 19.4% | 10.3%(+9.11)#52 | 11.1%(+8.39)#11,053 |
| 53. | 08078 | 19.4% | 10.3%(+9.09)#53 | 11.1%(+8.36)#11,066 |
| 54. | 08232 | 19.4% | 10.3%(+9.03)#54 | 11.1%(+8.30)#11,119 |
| 55. | 08027 | 19.4% | 10.3%(+9.03)#55 | 11.1%(+8.30)#11,120 |
| 56. | 08742 | 19.3% | 10.3%(+9.02)#56 | 11.1%(+8.29)#11,132 |
| 57. | 07503 | 19.0% | 10.3%(+8.66)#57 | 11.1%(+7.93)#11,413 |
| 58. | 08753 | 18.9% | 10.3%(+8.59)#58 | 11.1%(+7.87)#11,462 |
| 59. | 08210 | 18.9% | 10.3%(+8.56)#59 | 11.1%(+7.84)#11,492 |
| 60. | 08215 | 18.8% | 10.3%(+8.49)#60 | 11.1%(+7.76)#11,561 |
| 61. | 07757 | 18.7% | 10.3%(+8.41)#61 | 11.1%(+7.68)#11,662 |
| 62. | 08243 | 18.7% | 10.3%(+8.32)#62 | 11.1%(+7.59)#11,738 |
| 63. | 07432 | 18.5% | 10.3%(+8.19)#63 | 11.1%(+7.47)#11,847 |
| 64. | 08752 | 18.4% | 10.3%(+8.10)#64 | 11.1%(+7.38)#11,948 |
| 65. | 08104 | 18.4% | 10.3%(+8.10)#65 | 11.1%(+7.37)#11,952 |
| 66. | 08008 | 18.4% | 10.3%(+8.08)#66 | 11.1%(+7.35)#11,977 |
| 67. | 08887 | 18.4% | 10.3%(+8.04)#67 | 11.1%(+7.31)#12,014 |
| 68. | 07035 | 18.4% | 10.3%(+8.03)#68 | 11.1%(+7.30)#12,021 |
| 69. | 07461 | 18.1% | 10.3%(+7.81)#69 | 11.1%(+7.08)#12,242 |
| 70. | 08629 | 18.1% | 10.3%(+7.74)#70 | 11.1%(+7.01)#12,315 |
| 71. | 08005 | 18.1% | 10.3%(+7.72)#71 | 11.1%(+6.99)#12,335 |
| 72. | 08056 | 17.9% | 10.3%(+7.55)#72 | 11.1%(+6.83)#12,484 |
| 73. | 08067 | 17.8% | 10.3%(+7.48)#73 | 11.1%(+6.75)#12,561 |
| 74. | 08755 | 17.6% | 10.3%(+7.27)#74 | 11.1%(+6.54)#12,753 |
| 75. | 08087 | 17.5% | 10.3%(+7.18)#75 | 11.1%(+6.46)#12,829 |
| 76. | 08731 | 17.5% | 10.3%(+7.18)#76 | 11.1%(+6.45)#12,835 |
| 77. | 08226 | 17.5% | 10.3%(+7.18)#77 | 11.1%(+6.45)#12,838 |
| 78. | 07827 | 17.4% | 10.3%(+7.03)#78 | 11.1%(+6.30)#13,013 |
| 79. | 08201 | 17.3% | 10.3%(+7.02)#79 | 11.1%(+6.29)#13,022 |
| 80. | 08323 | 17.3% | 10.3%(+7.01)#80 | 11.1%(+6.29)#13,026 |
| 81. | 08751 | 17.3% | 10.3%(+6.92)#81 | 11.1%(+6.19)#13,118 |
| 82. | 08722 | 17.1% | 10.3%(+6.80)#82 | 11.1%(+6.07)#13,265 |
| 83. | 07755 | 17.0% | 10.3%(+6.70)#83 | 11.1%(+5.97)#13,389 |
| 84. | 08758 | 17.0% | 10.3%(+6.66)#84 | 11.1%(+5.93)#13,446 |
| 85. | 07480 | 16.9% | 10.3%(+6.59)#85 | 11.1%(+5.87)#13,503 |
| 86. | 08093 | 16.9% | 10.3%(+6.58)#86 | 11.1%(+5.85)#13,517 |
| 87. | 07066 | 16.8% | 10.3%(+6.49)#87 | 11.1%(+5.76)#13,618 |
| 88. | 08738 | 16.8% | 10.3%(+6.47)#88 | 11.1%(+5.74)#13,640 |
| 89. | 07801 | 16.8% | 10.3%(+6.46)#89 | 11.1%(+5.74)#13,644 |
| 90. | 08270 | 16.8% | 10.3%(+6.46)#90 | 11.1%(+5.73)#13,655 |
| 91. | 07976 | 16.8% | 10.3%(+6.43)#91 | 11.1%(+5.70)#13,681 |
| 92. | 08340 | 16.7% | 10.3%(+6.41)#92 | 11.1%(+5.68)#13,697 |
| 93. | 08089 | 16.6% | 10.3%(+6.31)#93 | 11.1%(+5.58)#13,852 |
| 94. | 08406 | 16.6% | 10.3%(+6.29)#94 | 11.1%(+5.57)#13,872 |
| 95. | 08086 | 16.6% | 10.3%(+6.29)#95 | 11.1%(+5.56)#13,877 |
| 96. | 08734 | 16.6% | 10.3%(+6.26)#96 | 11.1%(+5.53)#13,909 |
| 97. | 07465 | 16.6% | 10.3%(+6.22)#97 | 11.1%(+5.50)#13,943 |
| 98. | 07720 | 16.6% | 10.3%(+6.22)#98 | 11.1%(+5.49)#13,948 |
| 99. | 08079 | 16.5% | 10.3%(+6.13)#99 | 11.1%(+5.41)#14,042 |
| 100. | 08701 | 16.5% | 10.3%(+6.13)#100 | 11.1%(+5.40)#14,051 |
Common Questions
What are the Top 10 Zip Codes with the Highest Percentage of Population with a Degree in Education in New Jersey?
Top 10 Zip Codes with the Highest Percentage of Population with a Degree in Education in New Jersey are:
What zip code has the Highest Percentage of Population with a Degree in Education in New Jersey?
07846 has the Highest Percentage of Population with a Degree in Education in New Jersey with 100.0%.
What is the Percentage of Population with a Degree in Education in the State of New Jersey?
Percentage of Population with a Degree in Education in New Jersey is 10.3%.
What is the Percentage of Population with a Degree in Education in the United States?
Percentage of Population with a Degree in Education in the United States is 11.1%.