Cities with the Highest Unemployment Rate Amomg Seniors Over the Age of 65 in Oklahoma
RELATED REPORTS & OPTIONS
Highest Unemployment | Senior > 65
Oklahoma
Compare Cities
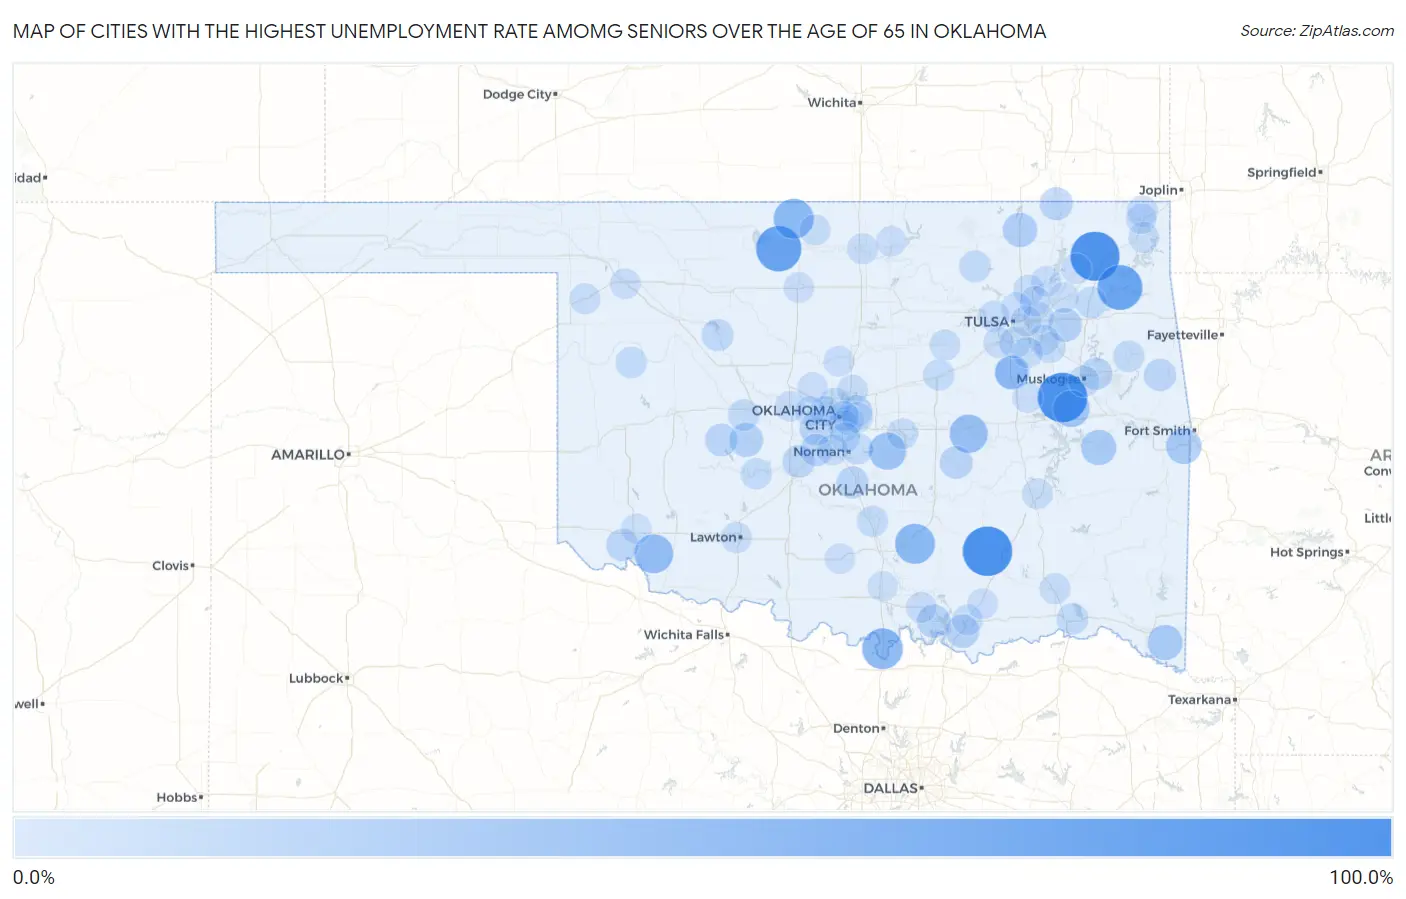
Map of Cities with the Highest Unemployment Rate Amomg Seniors Over the Age of 65 in Oklahoma
0.0%
100.0%
Cities with the Highest Unemployment Rate Amomg Seniors Over the Age of 65 in Oklahoma
| City | Senior Unemployment | vs State | vs National | |
| 1. | Phillips | 100.0% | 2.1%(+97.9)#1 | 3.9%(+96.1)#63 |
| 2. | Wainwright | 99.9% | 2.1%(+97.8)#2 | 3.9%(+96.0)#97 |
| 3. | White Oak | 97.8% | 2.1%(+95.7)#3 | 3.9%(+93.9)#121 |
| 4. | Nash | 77.7% | 2.1%(+75.6)#4 | 3.9%(+73.8)#150 |
| 5. | Spavinaw | 75.4% | 2.1%(+73.3)#5 | 3.9%(+71.5)#156 |
| 6. | Thackerville | 53.6% | 2.1%(+51.5)#6 | 3.9%(+49.7)#254 |
| 7. | Wakita | 50.0% | 2.1%(+47.9)#7 | 3.9%(+46.1)#274 |
| 8. | Hickory | 50.0% | 2.1%(+47.9)#8 | 3.9%(+46.1)#281 |
| 9. | Tipton | 44.1% | 2.1%(+42.0)#9 | 3.9%(+40.2)#355 |
| 10. | Bearden | 39.9% | 2.1%(+37.8)#10 | 3.9%(+36.0)#432 |
| 11. | Pink | 34.7% | 2.1%(+32.6)#11 | 3.9%(+30.8)#518 |
| 12. | Rentiesville | 33.3% | 2.1%(+31.2)#12 | 3.9%(+29.4)#585 |
| 13. | Whippoorwill | 33.3% | 2.1%(+31.2)#13 | 3.9%(+29.4)#588 |
| 14. | Pocola | 26.5% | 2.1%(+24.4)#14 | 3.9%(+22.6)#809 |
| 15. | Whitefield | 25.0% | 2.1%(+22.9)#15 | 3.9%(+21.1)#872 |
| 16. | Haworth | 24.9% | 2.1%(+22.8)#16 | 3.9%(+21.0)#895 |
| 17. | Dewey | 21.0% | 2.1%(+18.9)#17 | 3.9%(+17.1)#1,091 |
| 18. | Winchester | 19.9% | 2.1%(+17.8)#18 | 3.9%(+16.0)#1,179 |
| 19. | Binger | 18.1% | 2.1%(+16.0)#19 | 3.9%(+14.2)#1,324 |
| 20. | Inola | 17.5% | 2.1%(+15.4)#20 | 3.9%(+13.6)#1,387 |
| 21. | Kingston | 16.2% | 2.1%(+14.1)#21 | 3.9%(+12.3)#1,546 |
| 22. | Calera | 16.1% | 2.1%(+14.0)#22 | 3.9%(+12.2)#1,557 |
| 23. | Beggs | 15.6% | 2.1%(+13.5)#23 | 3.9%(+11.7)#1,615 |
| 24. | Mustang | 14.3% | 2.1%(+12.2)#24 | 3.9%(+10.4)#1,734 |
| 25. | South Coffeyville | 14.2% | 2.1%(+12.1)#25 | 3.9%(+10.3)#1,772 |
| 26. | Wewoka | 13.4% | 2.1%(+11.3)#26 | 3.9%(+9.50)#1,883 |
| 27. | Eakly | 12.5% | 2.1%(+10.4)#27 | 3.9%(+8.60)#2,018 |
| 28. | Olustee | 11.1% | 2.1%(+9.00)#28 | 3.9%(+7.20)#2,288 |
| 29. | Amber | 11.1% | 2.1%(+9.00)#29 | 3.9%(+7.20)#2,295 |
| 30. | Lyons Switch | 11.0% | 2.1%(+8.90)#30 | 3.9%(+7.10)#2,329 |
| 31. | Fort Gibson | 10.5% | 2.1%(+8.40)#31 | 3.9%(+6.60)#2,417 |
| 32. | Purcell | 10.3% | 2.1%(+8.20)#32 | 3.9%(+6.40)#2,461 |
| 33. | Bridge Creek | 10.0% | 2.1%(+7.90)#33 | 3.9%(+6.10)#2,559 |
| 34. | Canton | 9.0% | 2.1%(+6.90)#34 | 3.9%(+5.10)#2,873 |
| 35. | Spencer | 8.8% | 2.1%(+6.70)#35 | 3.9%(+4.90)#2,925 |
| 36. | The Village | 7.9% | 2.1%(+5.80)#36 | 3.9%(+4.00)#3,221 |
| 37. | Wynona | 7.6% | 2.1%(+5.50)#37 | 3.9%(+3.70)#3,363 |
| 38. | Hinton | 7.4% | 2.1%(+5.30)#38 | 3.9%(+3.50)#3,423 |
| 39. | Pryor Creek | 6.8% | 2.1%(+4.70)#39 | 3.9%(+2.90)#3,662 |
| 40. | Hugo | 6.8% | 2.1%(+4.70)#40 | 3.9%(+2.90)#3,670 |
| 41. | Tahlequah | 6.5% | 2.1%(+4.40)#41 | 3.9%(+2.60)#3,810 |
| 42. | Jenks | 5.9% | 2.1%(+3.80)#42 | 3.9%(+2.00)#4,129 |
| 43. | Leedey | 5.8% | 2.1%(+3.70)#43 | 3.9%(+1.90)#4,206 |
| 44. | Stroud | 5.6% | 2.1%(+3.50)#44 | 3.9%(+1.70)#4,303 |
| 45. | Muskogee | 5.5% | 2.1%(+3.40)#45 | 3.9%(+1.60)#4,326 |
| 46. | Valley Brook | 5.5% | 2.1%(+3.40)#46 | 3.9%(+1.60)#4,361 |
| 47. | Pauls Valley | 5.2% | 2.1%(+3.10)#47 | 3.9%(+1.30)#4,527 |
| 48. | Norman | 5.0% | 2.1%(+2.90)#48 | 3.9%(+1.10)#4,629 |
| 49. | Anadarko | 4.9% | 2.1%(+2.80)#49 | 3.9%(+1.00)#4,728 |
| 50. | Lawton | 4.5% | 2.1%(+2.40)#50 | 3.9%(+0.600)#4,961 |
| 51. | Antlers | 4.5% | 2.1%(+2.40)#51 | 3.9%(+0.600)#5,028 |
| 52. | Tonkawa | 4.4% | 2.1%(+2.30)#52 | 3.9%(+0.500)#5,097 |
| 53. | Shawnee | 4.3% | 2.1%(+2.20)#53 | 3.9%(+0.400)#5,127 |
| 54. | Coweta | 4.3% | 2.1%(+2.20)#54 | 3.9%(+0.400)#5,151 |
| 55. | Commerce | 4.2% | 2.1%(+2.10)#55 | 3.9%(+0.300)#5,238 |
| 56. | Medford | 4.1% | 2.1%(+2.00)#56 | 3.9%(+0.200)#5,322 |
| 57. | Sand Springs | 4.0% | 2.1%(+1.90)#57 | 3.9%(+0.100)#5,362 |
| 58. | Newcastle | 3.8% | 2.1%(+1.70)#58 | 3.9%(-0.100)#5,545 |
| 59. | Durant | 3.7% | 2.1%(+1.60)#59 | 3.9%(-0.200)#5,605 |
| 60. | Sapulpa | 3.5% | 2.1%(+1.40)#60 | 3.9%(-0.400)#5,749 |
| 61. | Drumright | 3.5% | 2.1%(+1.40)#61 | 3.9%(-0.400)#5,779 |
| 62. | Catoosa | 3.4% | 2.1%(+1.30)#62 | 3.9%(-0.500)#5,836 |
| 63. | Gage | 3.4% | 2.1%(+1.30)#63 | 3.9%(-0.500)#5,861 |
| 64. | Broken Arrow | 3.3% | 2.1%(+1.20)#64 | 3.9%(-0.600)#5,868 |
| 65. | Edmond | 3.3% | 2.1%(+1.20)#65 | 3.9%(-0.600)#5,870 |
| 66. | Bixby | 3.3% | 2.1%(+1.20)#66 | 3.9%(-0.600)#5,886 |
| 67. | Oakland | 3.2% | 2.1%(+1.10)#67 | 3.9%(-0.700)#6,021 |
| 68. | Midwest City | 3.1% | 2.1%(+1.000)#68 | 3.9%(-0.800)#6,044 |
| 69. | Mcalester | 3.1% | 2.1%(+1.000)#69 | 3.9%(-0.800)#6,068 |
| 70. | Collinsville | 3.1% | 2.1%(+1.000)#70 | 3.9%(-0.800)#6,088 |
| 71. | Fairland | 3.1% | 2.1%(+1.000)#71 | 3.9%(-0.800)#6,110 |
| 72. | Ponca City | 3.0% | 2.1%(+0.900)#72 | 3.9%(-0.900)#6,143 |
| 73. | Tulsa | 2.9% | 2.1%(+0.800)#73 | 3.9%(-1.00)#6,195 |
| 74. | Miami | 2.9% | 2.1%(+0.800)#74 | 3.9%(-1.00)#6,237 |
| 75. | Cedar Valley | 2.9% | 2.1%(+0.800)#75 | 3.9%(-1.00)#6,273 |
| 76. | Turley | 2.6% | 2.1%(+0.500)#76 | 3.9%(-1.30)#6,483 |
| 77. | El Reno | 2.5% | 2.1%(+0.400)#77 | 3.9%(-1.40)#6,529 |
| 78. | Caddo | 2.5% | 2.1%(+0.400)#78 | 3.9%(-1.40)#6,564 |
| 79. | Chelsea | 2.2% | 2.1%(+0.100)#79 | 3.9%(-1.70)#6,782 |
| 80. | Oologah | 2.2% | 2.1%(+0.100)#80 | 3.9%(-1.70)#6,783 |
| 81. | Piedmont | 2.0% | 2.1%(-0.100)#81 | 3.9%(-1.90)#6,907 |
| 82. | Morris | 2.0% | 2.1%(-0.100)#82 | 3.9%(-1.90)#6,916 |
| 83. | Enid | 1.9% | 2.1%(-0.200)#83 | 3.9%(-2.00)#6,924 |
| 84. | Owasso | 1.8% | 2.1%(-0.300)#84 | 3.9%(-2.10)#6,991 |
| 85. | Claremore | 1.8% | 2.1%(-0.300)#85 | 3.9%(-2.10)#7,006 |
| 86. | Woodward | 1.7% | 2.1%(-0.400)#86 | 3.9%(-2.20)#7,076 |
| 87. | Bethany | 1.6% | 2.1%(-0.500)#87 | 3.9%(-2.30)#7,127 |
| 88. | Ratliff City | 1.6% | 2.1%(-0.500)#88 | 3.9%(-2.30)#7,161 |
| 89. | Altus | 1.4% | 2.1%(-0.700)#89 | 3.9%(-2.50)#7,230 |
| 90. | Ardmore | 1.1% | 2.1%(-1.000)#90 | 3.9%(-2.80)#7,384 |
| 91. | Del City | 1.1% | 2.1%(-1.000)#91 | 3.9%(-2.80)#7,387 |
| 92. | Oklahoma City | 1.0% | 2.1%(-1.10)#92 | 3.9%(-2.90)#7,409 |
| 93. | Moore | 0.90% | 2.1%(-1.20)#93 | 3.9%(-3.00)#7,458 |
| 94. | Yukon | 0.60% | 2.1%(-1.50)#94 | 3.9%(-3.30)#7,561 |
Common Questions
What are the Top 10 Cities with the Highest Unemployment Rate Amomg Seniors Over the Age of 65 in Oklahoma?
Top 10 Cities with the Highest Unemployment Rate Amomg Seniors Over the Age of 65 in Oklahoma are:
#1
100.0%
#2
99.9%
#3
97.8%
#4
77.7%
#5
75.4%
#6
53.6%
#7
50.0%
#8
50.0%
#9
44.1%
#10
39.9%
What city has the Highest Unemployment Rate Amomg Seniors Over the Age of 65 in Oklahoma?
Phillips has the Highest Unemployment Rate Amomg Seniors Over the Age of 65 in Oklahoma with 100.0%.
What is the Unemployment Rate Amomg Seniors Over the Age of 65 in the State of Oklahoma?
Unemployment Rate Amomg Seniors Over the Age of 65 in Oklahoma is 2.1%.
What is the Unemployment Rate Amomg Seniors Over the Age of 65 in the United States?
Unemployment Rate Amomg Seniors Over the Age of 65 in the United States is 3.9%.