Cities with the Highest Unemployment Rate Amomg Seniors Over the Age of 65 in Nebraska

RELATED REPORTS & OPTIONS

Highest Unemployment | Senior > 65
Population
Families and Households
Female Fertility
Female Fertility (Unmarried)
Race (Community Size)
Race (Percentage)
Ancestry (Community Size)
AfghanAfricanAlaska NativeAlaskan AthabascanAlbanianAleutAlsatianAmericanApacheArabArapahoArgentineanArmenianAssyrian / Chaldean / SyriacAustralianAustrianBahamianBangladeshiBarbadianBasqueBelgianBelizeanBermudanBhutaneseBlackfeetBolivianBrazilianBritishBritish West IndianBulgarianBurmeseCajunCambodianCanadianCape VerdeanCarpatho RusynCelticCentral AmericanCentral American IndianCherokeeCheyenneChickasawChileanChineseChippewaChoctawColombianColvilleComancheCosta RicanCreeCreekCroatianCrowCubanCypriotCzechCzechoslovakianDanishDelawareDominicanDutchDutch West IndianEastern EuropeanEcuadorianEgyptianEnglishEstonianEthiopianEuropeanFijianFilipinoFinnishFrenchFrench American IndianFrench CanadianGermanGerman RussianGhanaianGreekGuamanian / ChamorroGuatemalanGuyaneseHaitianHmongHonduranHopiHoumaHungarianIcelanderIndian (Asian)IndonesianInupiatIranianIraqiIrishIroquoisIsraeliItalianJamaicanJapaneseJordanianKenyanKiowaKoreanLaotianLatvianLebaneseLiberianLithuanianLumbeeLuxembourgerMacedonianMalaysianMalteseMarshalleseMenomineeMexicanMexican American IndianMongolianMoroccanNative HawaiianNavajoNepaleseNew ZealanderNicaraguanNigerianNorthern EuropeanNorwegianOkinawanOsageOttawaPaiutePakistaniPalestinianPanamanianParaguayanPennsylvania GermanPeruvianPimaPolishPortuguesePotawatomiPuebloPuerto RicanPuget Sound SalishRomanianRussianSalvadoranSamoanScandinavianScotch-IrishScottishSeminoleSenegaleseSerbianShoshoneSierra LeoneanSiouxSlavicSlovakSloveneSomaliSouth AfricanSouth AmericanSouth American IndianSoviet UnionSpaniardSpanishSpanish AmericanSpanish American IndianSri LankanSubsaharan AfricanSudaneseSwedishSwissSyrianTaiwaneseThaiTlingit-HaidaTohono O'OdhamTonganTrinidadian and TobagonianTsimshianTurkishU.S. Virgin IslanderUgandanUkrainianUruguayanUteVenezuelanVietnameseWelshWest IndianYakamaYaquiYugoslavianYumanYup'ikZimbabwean
Ancestry (Percentage)
AfghanAfricanAlaska NativeAlaskan AthabascanAlbanianAleutAlsatianAmericanApacheArabArapahoArgentineanArmenianAssyrian / Chaldean / SyriacAustralianAustrianBahamianBangladeshiBarbadianBasqueBelgianBelizeanBermudanBhutaneseBlackfeetBolivianBrazilianBritishBritish West IndianBulgarianBurmeseCajunCambodianCanadianCape VerdeanCarpatho RusynCelticCentral AmericanCentral American IndianCherokeeCheyenneChickasawChileanChineseChippewaChoctawColombianColvilleComancheCosta RicanCreeCreekCroatianCrowCubanCypriotCzechCzechoslovakianDanishDelawareDominicanDutchDutch West IndianEastern EuropeanEcuadorianEgyptianEnglishEstonianEthiopianEuropeanFijianFilipinoFinnishFrenchFrench American IndianFrench CanadianGermanGerman RussianGhanaianGreekGuamanian / ChamorroGuatemalanGuyaneseHaitianHmongHonduranHopiHoumaHungarianIcelanderIndian (Asian)IndonesianInupiatIranianIraqiIrishIroquoisIsraeliItalianJamaicanJapaneseJordanianKenyanKiowaKoreanLaotianLatvianLebaneseLiberianLithuanianLumbeeLuxembourgerMacedonianMalaysianMalteseMarshalleseMenomineeMexicanMexican American IndianMongolianMoroccanNative HawaiianNavajoNepaleseNew ZealanderNicaraguanNigerianNorthern EuropeanNorwegianOkinawanOsageOttawaPaiutePakistaniPalestinianPanamanianParaguayanPennsylvania GermanPeruvianPimaPolishPortuguesePotawatomiPuebloPuerto RicanPuget Sound SalishRomanianRussianSalvadoranSamoanScandinavianScotch-IrishScottishSeminoleSenegaleseSerbianShoshoneSierra LeoneanSiouxSlavicSlovakSloveneSomaliSouth AfricanSouth AmericanSouth American IndianSoviet UnionSpaniardSpanishSpanish AmericanSpanish American IndianSri LankanSubsaharan AfricanSudaneseSwedishSwissSyrianTaiwaneseThaiTlingit-HaidaTohono O'OdhamTonganTrinidadian and TobagonianTsimshianTurkishU.S. Virgin IslanderUgandanUkrainianUruguayanUteVenezuelanVietnameseWelshWest IndianYakamaYaquiYugoslavianYumanYup'ikZimbabwean
Immigrant Origin (Total)
AfghanistanAfricaAlbaniaArgentinaArmeniaAsiaAustraliaAustriaAzoresBahamasBangladeshBarbadosBelarusBelgiumBelizeBoliviaBosnia and HerzegovinaBrazilBulgariaBurma / MyanmarCabo VerdeCambodiaCameroonCanadaCaribbeanCentral AmericaChileChinaColombiaCongoCosta RicaCroatiaCubaCzechoslovakiaDenmarkDominicaDominican RepublicEastern AfricaEastern AsiaEastern EuropeEcuadorEgyptEl SalvadorEnglandEritreaEthiopiaEuropeFijiFranceGermanyGhanaGreeceGrenadaGuatemalaGuyanaHaitiHondurasHong KongHungaryIndiaIndonesiaIranIraqIrelandIsraelItalyJamaicaJapanJordanKazakhstanKenyaKoreaKuwaitLaosLatin AmericaLatviaLebanonLiberiaLithuaniaMalaysiaMexicoMicronesiaMiddle AfricaMoldovaMoroccoNepalNetherlandsNicaraguaNigeriaNorth MacedoniaNorthern AfricaNorthern EuropeNorwayOceaniaPakistanPanamaPeruPhilippinesPolandPortugalRomaniaRussiaSaudi ArabiaScotlandSenegalSerbiaSierra LeoneSingaporeSomaliaSouth AfricaSouth AmericaSouth Central AsiaSouth Eastern AsiaSouthern EuropeSpainSri LankaSt. Vincent and the GrenadinesSudanSwedenSwitzerlandSyriaTaiwanThailandTrinidad and TobagoTurkeyUgandaUkraineUruguayUzbekistanVenezuelaVietnamWest IndiesWestern AfricaWestern AsiaWestern EuropeYemenZaireZimbabwe
Immigrant Origin (Percentage)
AfghanistanAfricaAlbaniaArgentinaArmeniaAsiaAustraliaAustriaAzoresBahamasBangladeshBarbadosBelarusBelgiumBelizeBoliviaBosnia and HerzegovinaBrazilBulgariaBurma / MyanmarCabo VerdeCambodiaCameroonCanadaCaribbeanCentral AmericaChileChinaColombiaCongoCosta RicaCroatiaCubaCzechoslovakiaDenmarkDominicaDominican RepublicEastern AfricaEastern AsiaEastern EuropeEcuadorEgyptEl SalvadorEnglandEritreaEthiopiaEuropeFijiFranceGermanyGhanaGreeceGrenadaGuatemalaGuyanaHaitiHondurasHong KongHungaryIndiaIndonesiaIranIraqIrelandIsraelItalyJamaicaJapanJordanKazakhstanKenyaKoreaKuwaitLaosLatin AmericaLatviaLebanonLiberiaLithuaniaMalaysiaMexicoMicronesiaMiddle AfricaMoldovaMoroccoNepalNetherlandsNicaraguaNigeriaNorth MacedoniaNorthern AfricaNorthern EuropeNorwayOceaniaPakistanPanamaPeruPhilippinesPolandPortugalRomaniaRussiaSaudi ArabiaScotlandSenegalSerbiaSierra LeoneSingaporeSomaliaSouth AfricaSouth AmericaSouth Central AsiaSouth Eastern AsiaSouthern EuropeSpainSri LankaSt. Vincent and the GrenadinesSudanSwedenSwitzerlandSyriaTaiwanThailandTrinidad and TobagoTurkeyUgandaUkraineUruguayUzbekistanVenezuelaVietnamWest IndiesWestern AfricaWestern AsiaWestern EuropeYemenZaireZimbabwe
Income
Income (Families)
Income (Households)
Poverty
Poverty (Families)
Unemployment
Employment Occupations
Employment Industries
Employer Class
Commute Time
Commute Means
School Enrollment
Education by Degree Field
Occupancy
Finances
Physical Characteristics
Nebraska
Compare Cities
Comparison Subject

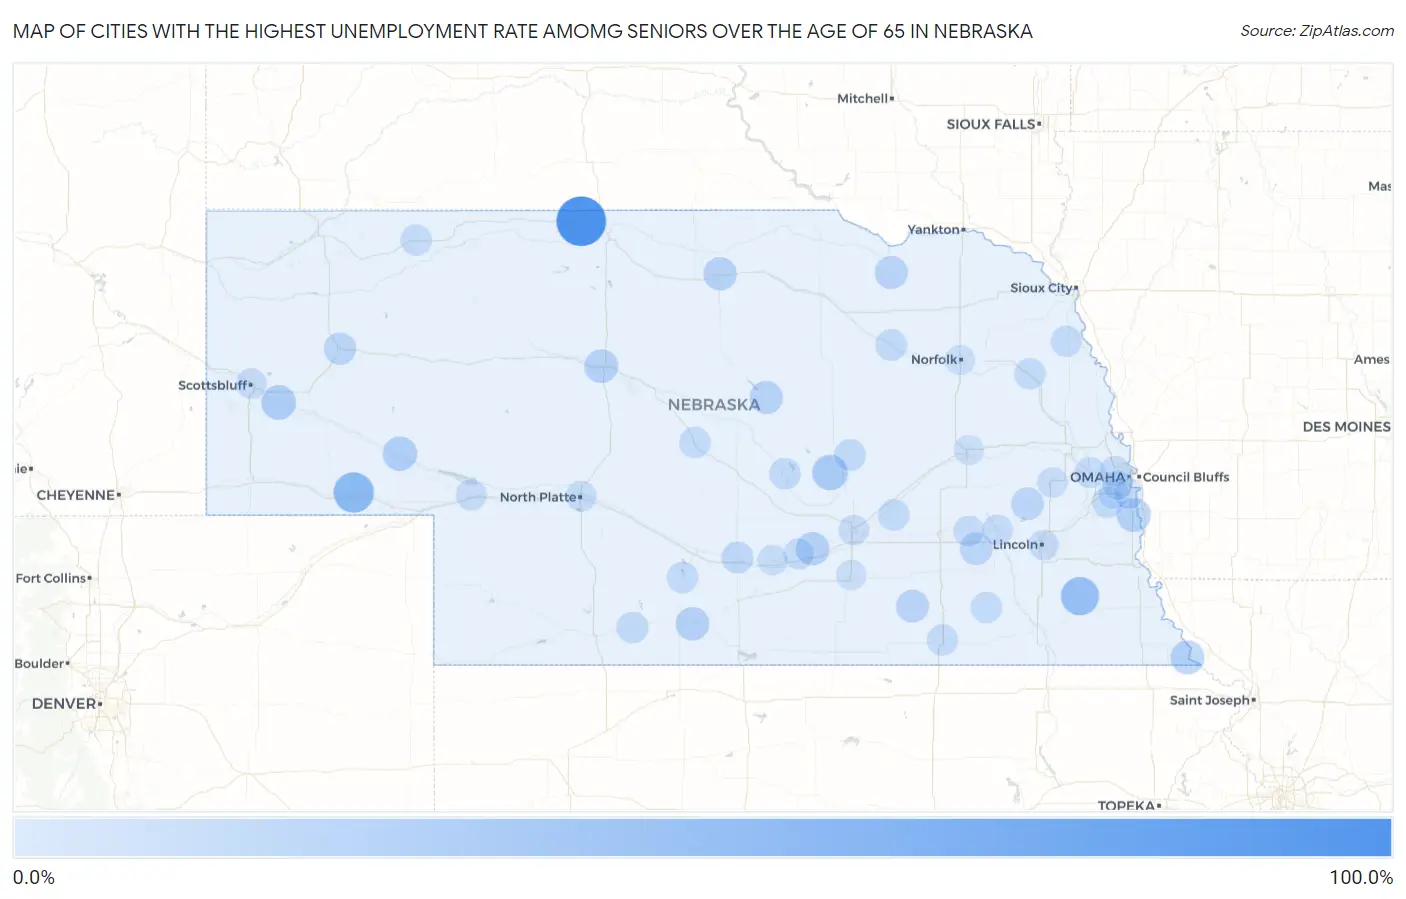
Map of Cities with the Highest Unemployment Rate Amomg Seniors Over the Age of 65 in Nebraska

0.0%
100.0%
Cities with the Highest Unemployment Rate Amomg Seniors Over the Age of 65 in Nebraska Map

Cities with the Highest Unemployment Rate Amomg Seniors Over the Age of 65 in Nebraska

City Senior Unemployment vs State vs National
1.Crookston100.0%1.7%(+98.3)#13.9%(+96.1)#77
2.Sunol50.9%1.7%(+49.2)#23.9%(+47.0)#262
3.Sterling40.0%1.7%(+38.3)#33.9%(+36.1)#409
4.Elba26.0%1.7%(+24.3)#43.9%(+22.1)#826
5.Mcgrew22.2%1.7%(+20.5)#53.9%(+18.3)#1,026
6.Oshkosh20.6%1.7%(+18.9)#63.9%(+16.7)#1,114
7.Plattsmouth18.8%1.7%(+17.1)#73.9%(+14.9)#1,248
8.Rulo18.1%1.7%(+16.4)#83.9%(+14.2)#1,335
9.Thedford17.6%1.7%(+15.9)#93.9%(+13.7)#1,382
10.Edison16.6%1.7%(+14.9)#103.9%(+12.7)#1,509
11.Shelton16.2%1.7%(+14.5)#113.9%(+12.3)#1,548
12.Bassett15.8%1.7%(+14.1)#123.9%(+11.9)#1,592
13.Burwell14.6%1.7%(+12.9)#133.9%(+10.7)#1,719
14.Verdigre13.6%1.7%(+11.9)#143.9%(+9.70)#1,860
15.Ong13.3%1.7%(+11.6)#153.9%(+9.40)#1,908
16.Valparaiso12.4%1.7%(+10.7)#163.9%(+8.50)#2,064
17.Beaver Crossing12.4%1.7%(+10.7)#173.9%(+8.50)#2,067
18.Alliance10.8%1.7%(+9.10)#183.9%(+6.90)#2,350
19.Elm Creek9.0%1.7%(+7.30)#193.9%(+5.10)#2,864
20.Bartley7.6%1.7%(+5.90)#203.9%(+3.70)#3,361
21.Neligh7.2%1.7%(+5.50)#213.9%(+3.30)#3,509
22.Wolbach7.1%1.7%(+5.40)#223.9%(+3.20)#3,560
23.Loup City6.6%1.7%(+4.90)#233.9%(+2.70)#3,772
24.Marquette6.2%1.7%(+4.50)#243.9%(+2.30)#4,009
25.Elwood6.0%1.7%(+4.30)#253.9%(+2.10)#4,108
26.Beemer5.8%1.7%(+4.10)#263.9%(+1.90)#4,205
27.Western5.8%1.7%(+4.10)#273.9%(+1.90)#4,210
28.Gordon5.7%1.7%(+4.00)#283.9%(+1.80)#4,259
29.Merna5.5%1.7%(+3.80)#293.9%(+1.60)#4,367
30.Hebron5.4%1.7%(+3.70)#303.9%(+1.50)#4,414
31.Walthill5.0%1.7%(+3.30)#313.9%(+1.10)#4,684
32.Springfield4.7%1.7%(+3.00)#323.9%(+0.800)#4,862
33.Waterloo4.3%1.7%(+2.60)#333.9%(+0.400)#5,177
34.Utica4.2%1.7%(+2.50)#343.9%(+0.300)#5,245
35.Ogallala3.9%1.7%(+2.20)#353.9%(=0.000)#5,478
36.Gibbon3.7%1.7%(+2.00)#363.9%(-0.200)#5,638
37.Scottsbluff3.4%1.7%(+1.70)#373.9%(-0.500)#5,822
38.North Platte3.2%1.7%(+1.50)#383.9%(-0.700)#5,977
39.Omaha3.1%1.7%(+1.40)#393.9%(-0.800)#6,031
40.Seward3.0%1.7%(+1.30)#403.9%(-0.900)#6,172
41.Lincoln1.9%1.7%(+0.200)#413.9%(-2.00)#6,918
42.Papillion1.9%1.7%(+0.200)#423.9%(-2.00)#6,940
43.Kearney1.8%1.7%(+0.100)#433.9%(-2.10)#6,993
44.Wahoo1.7%1.7%(=0.000)#443.9%(-2.20)#7,088
45.Grand Island1.5%1.7%(-0.200)#453.9%(-2.40)#7,170
46.Bellevue1.2%1.7%(-0.500)#463.9%(-2.70)#7,317
47.Hastings1.1%1.7%(-0.600)#473.9%(-2.80)#7,383
48.Columbus0.80%1.7%(-0.900)#483.9%(-3.10)#7,505
49.Norfolk0.70%1.7%(-1.00)#493.9%(-3.20)#7,535
50.Ralston0.40%1.7%(-1.30)#503.9%(-3.50)#7,620

Common Questions

What are the Top 10 Cities with the Highest Unemployment Rate Amomg Seniors Over the Age of 65 in Nebraska?
Top 10 Cities with the Highest Unemployment Rate Amomg Seniors Over the Age of 65 in Nebraska are:
#1
100.0%
#2
50.9%
#3
40.0%
#4
26.0%
#5
22.2%
#6
20.6%
#7
18.8%
#8
18.1%
#9
17.6%
#10
16.6%
What city has the Highest Unemployment Rate Amomg Seniors Over the Age of 65 in Nebraska?
Crookston has the Highest Unemployment Rate Amomg Seniors Over the Age of 65 in Nebraska with 100.0%.
What is the Unemployment Rate Amomg Seniors Over the Age of 65 in the State of Nebraska?
Unemployment Rate Amomg Seniors Over the Age of 65 in Nebraska is 1.7%.
What is the Unemployment Rate Amomg Seniors Over the Age of 65 in the United States?
Unemployment Rate Amomg Seniors Over the Age of 65 in the United States is 3.9%.