Cities with the Highest Unemployment Rate Amomg Seniors Over the Age of 65 in Idaho
RELATED REPORTS & OPTIONS
Highest Unemployment | Senior > 65
Idaho
Compare Cities
Map of Cities with the Highest Unemployment Rate Amomg Seniors Over the Age of 65 in Idaho
0.0%
100.0%
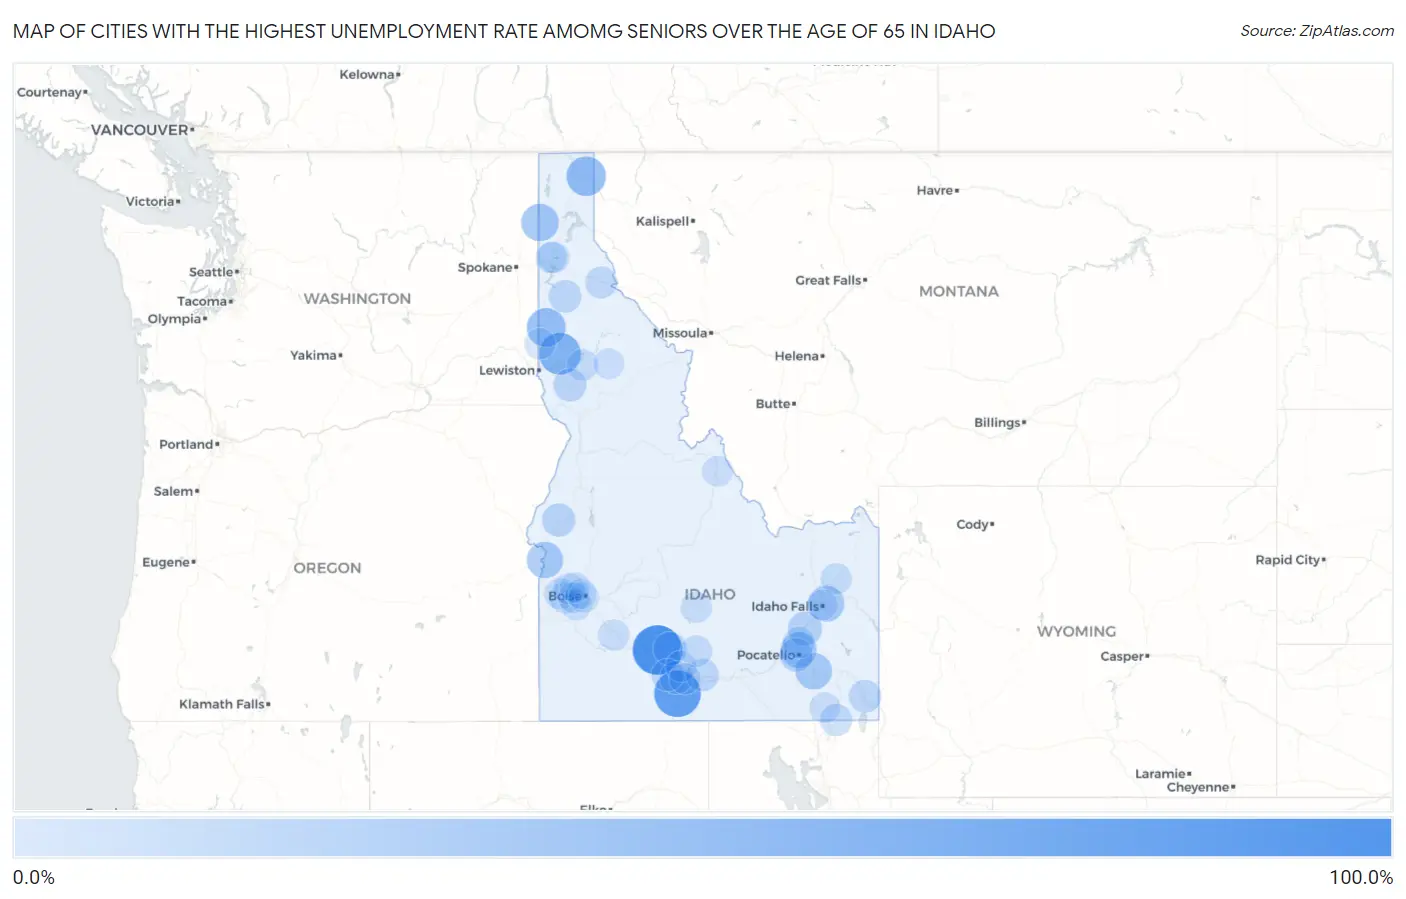
Cities with the Highest Unemployment Rate Amomg Seniors Over the Age of 65 in Idaho
| City | Senior Unemployment | vs State | vs National | |
| 1. | Bliss | 91.9% | 3.2%(+88.7)#1 | 3.9%(+88.0)#125 |
| 2. | Hollister | 77.5% | 3.2%(+74.3)#2 | 3.9%(+73.6)#151 |
| 3. | Kendrick | 53.8% | 3.2%(+50.6)#3 | 3.9%(+49.9)#253 |
| 4. | Moyie Springs | 43.2% | 3.2%(+40.0)#4 | 3.9%(+39.3)#366 |
| 5. | Onaway | 40.0% | 3.2%(+36.8)#5 | 3.9%(+36.1)#415 |
| 6. | Oldtown | 33.1% | 3.2%(+29.9)#6 | 3.9%(+29.2)#600 |
| 7. | Mccammon | 29.0% | 3.2%(+25.8)#7 | 3.9%(+25.1)#710 |
| 8. | Payette | 28.2% | 3.2%(+25.0)#8 | 3.9%(+24.3)#752 |
| 9. | Lincoln | 27.1% | 3.2%(+23.9)#9 | 3.9%(+23.2)#792 |
| 10. | Chubbuck | 26.6% | 3.2%(+23.4)#10 | 3.9%(+22.7)#803 |
| 11. | Blackfoot | 18.4% | 3.2%(+15.2)#11 | 3.9%(+14.5)#1,288 |
| 12. | Gooding | 15.1% | 3.2%(+11.9)#12 | 3.9%(+11.2)#1,668 |
| 13. | Cambridge | 14.6% | 3.2%(+11.4)#13 | 3.9%(+10.7)#1,720 |
| 14. | Pocatello | 14.4% | 3.2%(+11.2)#14 | 3.9%(+10.5)#1,730 |
| 15. | Craigmont | 12.8% | 3.2%(+9.60)#15 | 3.9%(+8.90)#1,976 |
| 16. | Filer | 12.4% | 3.2%(+9.20)#16 | 3.9%(+8.50)#2,047 |
| 17. | St Maries | 12.1% | 3.2%(+8.90)#17 | 3.9%(+8.20)#2,102 |
| 18. | Hazelton | 11.8% | 3.2%(+8.60)#18 | 3.9%(+7.90)#2,150 |
| 19. | Montpelier | 11.3% | 3.2%(+8.10)#19 | 3.9%(+7.40)#2,240 |
| 20. | Buhl | 10.2% | 3.2%(+7.00)#20 | 3.9%(+6.30)#2,492 |
| 21. | Wallace | 9.0% | 3.2%(+5.80)#21 | 3.9%(+5.10)#2,866 |
| 22. | Franklin | 9.0% | 3.2%(+5.80)#22 | 3.9%(+5.10)#2,870 |
| 23. | Fort Hall | 7.6% | 3.2%(+4.40)#23 | 3.9%(+3.70)#3,350 |
| 24. | Dietrich | 7.1% | 3.2%(+3.90)#24 | 3.9%(+3.20)#3,559 |
| 25. | Nampa | 6.5% | 3.2%(+3.30)#25 | 3.9%(+2.60)#3,791 |
| 26. | Orofino | 6.1% | 3.2%(+2.90)#26 | 3.9%(+2.20)#4,045 |
| 27. | Hayden Lake | 5.8% | 3.2%(+2.60)#27 | 3.9%(+1.90)#4,204 |
| 28. | Rexburg | 5.4% | 3.2%(+2.20)#28 | 3.9%(+1.50)#4,383 |
| 29. | Hayden | 5.3% | 3.2%(+2.10)#29 | 3.9%(+1.40)#4,459 |
| 30. | Moscow | 5.2% | 3.2%(+2.00)#30 | 3.9%(+1.30)#4,502 |
| 31. | Mountain Home | 5.0% | 3.2%(+1.80)#31 | 3.9%(+1.10)#4,654 |
| 32. | Bellevue | 5.0% | 3.2%(+1.80)#32 | 3.9%(+1.10)#4,673 |
| 33. | Jerome | 4.9% | 3.2%(+1.70)#33 | 3.9%(+1.00)#4,721 |
| 34. | Twin Falls | 4.7% | 3.2%(+1.50)#34 | 3.9%(+0.800)#4,815 |
| 35. | Caldwell | 4.0% | 3.2%(+0.800)#35 | 3.9%(+0.100)#5,341 |
| 36. | Kuna | 4.0% | 3.2%(+0.800)#36 | 3.9%(+0.100)#5,357 |
| 37. | Star | 4.0% | 3.2%(+0.800)#37 | 3.9%(+0.100)#5,379 |
| 38. | Meridian | 3.9% | 3.2%(+0.700)#38 | 3.9%(=0.000)#5,419 |
| 39. | Salmon | 3.4% | 3.2%(+0.200)#39 | 3.9%(-0.500)#5,851 |
| 40. | Pierce | 3.4% | 3.2%(+0.200)#40 | 3.9%(-0.500)#5,862 |
| 41. | Clifton | 2.8% | 3.2%(-0.400)#41 | 3.9%(-1.10)#6,352 |
| 42. | Idaho Falls | 2.3% | 3.2%(-0.900)#42 | 3.9%(-1.60)#6,661 |
| 43. | Boise City | 1.8% | 3.2%(-1.40)#43 | 3.9%(-2.10)#6,976 |
| 44. | Garden City | 1.7% | 3.2%(-1.50)#44 | 3.9%(-2.20)#7,074 |
| 45. | Eagle | 1.5% | 3.2%(-1.70)#45 | 3.9%(-2.40)#7,184 |
1
2Common Questions
What are the Top 10 Cities with the Highest Unemployment Rate Amomg Seniors Over the Age of 65 in Idaho?
Top 10 Cities with the Highest Unemployment Rate Amomg Seniors Over the Age of 65 in Idaho are:
What city has the Highest Unemployment Rate Amomg Seniors Over the Age of 65 in Idaho?
Bliss has the Highest Unemployment Rate Amomg Seniors Over the Age of 65 in Idaho with 91.9%.
What is the Unemployment Rate Amomg Seniors Over the Age of 65 in the State of Idaho?
Unemployment Rate Amomg Seniors Over the Age of 65 in Idaho is 3.2%.
What is the Unemployment Rate Amomg Seniors Over the Age of 65 in the United States?
Unemployment Rate Amomg Seniors Over the Age of 65 in the United States is 3.9%.