Cities with the Highest Unemployment Rate Amomg Seniors Over the Age of 65 in the United States
RELATED REPORTS & OPTIONS
Highest Unemployment | Senior > 65
United States
Compare Cities
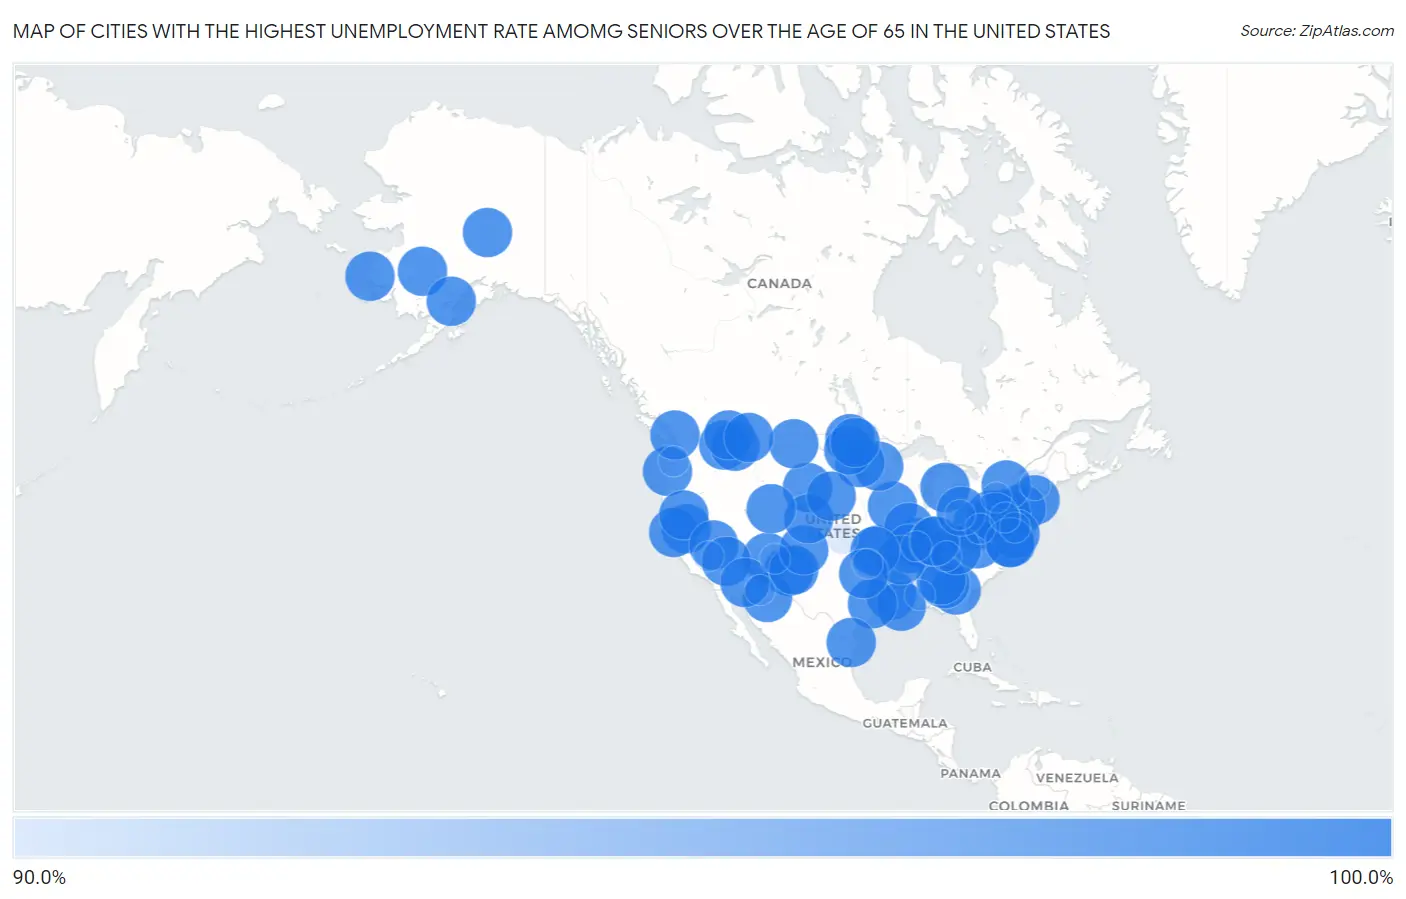
Map of Cities with the Highest Unemployment Rate Amomg Seniors Over the Age of 65 in the United States
0.0%
100.0%
Cities with the Highest Unemployment Rate Amomg Seniors Over the Age of 65 in the United States
| City | Senior Unemployment | vs State | vs National | |
| 1. | Montrose | 100.0% | 3.6%(+96.4)#1 | 3.9%(+96.1)#1 |
| 2. | Sleepy Hollow Lake | 100.0% | 4.6%(+95.4)#1 | 3.9%(+96.1)#2 |
| 3. | Olla | 100.0% | 3.8%(+96.2)#1 | 3.9%(+96.1)#3 |
| 4. | Watson | 100.0% | 3.8%(+96.2)#2 | 3.9%(+96.1)#4 |
| 5. | East Newnan | 100.0% | 3.6%(+96.4)#2 | 3.9%(+96.1)#5 |
| 6. | Baldwinville | 100.0% | 4.6%(+95.4)#1 | 3.9%(+96.1)#6 |
| 7. | Mather | 100.0% | 4.2%(+95.8)#1 | 3.9%(+96.1)#7 |
| 8. | Townshend | 100.0% | 3.1%(+96.9)#1 | 3.9%(+96.1)#8 |
| 9. | Broughton | 100.0% | 4.1%(+95.9)#1 | 3.9%(+96.1)#9 |
| 10. | Valencia | 100.0% | 4.2%(+95.8)#1 | 3.9%(+96.1)#10 |
| 11. | Many Farms | 100.0% | 4.4%(+95.6)#1 | 3.9%(+96.1)#11 |
| 12. | Atlantic Mine | 100.0% | 4.3%(+95.7)#1 | 3.9%(+96.1)#12 |
| 13. | Lloydsville | 100.0% | 3.3%(+96.7)#1 | 3.9%(+96.1)#13 |
| 14. | Shakertowne | 100.0% | 3.0%(+97.0)#1 | 3.9%(+96.1)#14 |
| 15. | Chevak | 100.0% | 4.4%(+95.6)#1 | 3.9%(+96.1)#15 |
| 16. | Hickory Hills | 100.0% | 4.2%(+95.8)#2 | 3.9%(+96.1)#16 |
| 17. | Camptonville | 100.0% | 5.3%(+94.7)#1 | 3.9%(+96.1)#17 |
| 18. | Hill View Heights | 100.0% | 2.4%(+97.6)#1 | 3.9%(+96.1)#18 |
| 19. | Mcneal | 100.0% | 4.4%(+95.6)#2 | 3.9%(+96.1)#19 |
| 20. | Anderson | 100.0% | 4.4%(+95.6)#2 | 3.9%(+96.1)#20 |
| 21. | La Russell | 100.0% | 3.0%(+97.0)#2 | 3.9%(+96.1)#21 |
| 22. | Seven Oaks | 100.0% | 3.9%(+96.1)#1 | 3.9%(+96.1)#22 |
| 23. | Luzerne | 100.0% | 2.6%(+97.4)#1 | 3.9%(+96.1)#23 |
| 24. | Crooked Creek | 100.0% | 4.4%(+95.6)#3 | 3.9%(+96.1)#24 |
| 25. | California Polytechnic State University | 100.0% | 5.3%(+94.7)#2 | 3.9%(+96.1)#25 |
| 26. | Auburn | 100.0% | 4.1%(+95.9)#2 | 3.9%(+96.1)#26 |
| 27. | Clintondale | 100.0% | 4.6%(+95.4)#2 | 3.9%(+96.1)#27 |
| 28. | Wattsville | 100.0% | 3.1%(+96.9)#1 | 3.9%(+96.1)#28 |
| 29. | Upper Lake | 100.0% | 5.3%(+94.7)#3 | 3.9%(+96.1)#29 |
| 30. | Carlls Corner | 100.0% | 6.0%(+94.0)#1 | 3.9%(+96.1)#30 |
| 31. | Waco | 100.0% | 3.6%(+96.4)#3 | 3.9%(+96.1)#31 |
| 32. | Wanamie | 100.0% | 4.2%(+95.8)#3 | 3.9%(+96.1)#32 |
| 33. | Hawk Run | 100.0% | 4.2%(+95.8)#4 | 3.9%(+96.1)#33 |
| 34. | Richland | 100.0% | 6.0%(+94.0)#2 | 3.9%(+96.1)#34 |
| 35. | Mcintosh | 100.0% | 4.2%(+95.8)#2 | 3.9%(+96.1)#35 |
| 36. | Fairview | 100.0% | 4.7%(+95.3)#1 | 3.9%(+96.1)#36 |
| 37. | Mcarthur | 100.0% | 5.3%(+94.7)#4 | 3.9%(+96.1)#37 |
| 38. | Grover | 100.0% | 3.3%(+96.7)#1 | 3.9%(+96.1)#38 |
| 39. | Solon Mills | 100.0% | 4.1%(+95.9)#3 | 3.9%(+96.1)#39 |
| 40. | Depauville | 100.0% | 4.6%(+95.4)#3 | 3.9%(+96.1)#40 |
| 41. | Frazer | 100.0% | 2.8%(+97.2)#1 | 3.9%(+96.1)#41 |
| 42. | Homer C Jones | 100.0% | 4.2%(+95.8)#3 | 3.9%(+96.1)#42 |
| 43. | Callaghan | 100.0% | 3.1%(+96.9)#2 | 3.9%(+96.1)#43 |
| 44. | Vicco | 100.0% | 3.2%(+96.8)#1 | 3.9%(+96.1)#44 |
| 45. | Custer | 100.0% | 3.4%(+96.6)#1 | 3.9%(+96.1)#45 |
| 46. | Huckabay | 100.0% | 3.9%(+96.1)#2 | 3.9%(+96.1)#46 |
| 47. | Jansen | 100.0% | 3.4%(+96.6)#1 | 3.9%(+96.1)#47 |
| 48. | Diamond Beach | 100.0% | 6.0%(+94.0)#3 | 3.9%(+96.1)#48 |
| 49. | Loomis | 100.0% | 4.3%(+95.7)#2 | 3.9%(+96.1)#49 |
| 50. | Goldfield | 100.0% | 7.6%(+92.4)#1 | 3.9%(+96.1)#50 |
| 51. | Dutchtown | 100.0% | 3.0%(+97.0)#3 | 3.9%(+96.1)#51 |
| 52. | Noxon | 100.0% | 2.8%(+97.2)#2 | 3.9%(+96.1)#52 |
| 53. | Cementon | 100.0% | 4.6%(+95.4)#4 | 3.9%(+96.1)#53 |
| 54. | Elmo | 100.0% | 2.8%(+97.2)#3 | 3.9%(+96.1)#54 |
| 55. | Villa Verde | 100.0% | 3.9%(+96.1)#3 | 3.9%(+96.1)#55 |
| 56. | Rexford | 100.0% | 2.8%(+97.2)#4 | 3.9%(+96.1)#56 |
| 57. | Sedgwick | 100.0% | 2.7%(+97.3)#1 | 3.9%(+96.1)#58 |
| 58. | Potlicker Flats | 100.0% | 4.2%(+95.8)#5 | 3.9%(+96.1)#59 |
| 59. | Goodsprings | 100.0% | 7.6%(+92.4)#2 | 3.9%(+96.1)#60 |
| 60. | Jolmaville | 100.0% | 2.1%(+97.9)#1 | 3.9%(+96.1)#61 |
| 61. | New Amsterdam | 100.0% | 2.9%(+97.1)#1 | 3.9%(+96.1)#62 |
| 62. | Redings Mill | 100.0% | 3.0%(+97.0)#4 | 3.9%(+96.1)#63 |
| 63. | Phillips | 100.0% | 2.1%(+97.9)#1 | 3.9%(+96.1)#64 |
| 64. | Raymer New Raymer | 100.0% | 3.4%(+96.6)#2 | 3.9%(+96.1)#65 |
| 65. | Reliance | 100.0% | 2.4%(+97.6)#2 | 3.9%(+96.1)#66 |
| 66. | New Middletown | 100.0% | 2.9%(+97.1)#2 | 3.9%(+96.1)#67 |
| 67. | Genola | 100.0% | 3.2%(+96.8)#1 | 3.9%(+96.1)#68 |
| 68. | Beulah Beach | 100.0% | 3.3%(+96.7)#2 | 3.9%(+96.1)#69 |
| 69. | Milton | 100.0% | 1.9%(+98.1)#1 | 3.9%(+96.1)#70 |
| 70. | Kalapana | 100.0% | 3.7%(+96.3)#1 | 3.9%(+96.1)#71 |
| 71. | Dwight | 100.0% | 1.9%(+98.1)#2 | 3.9%(+96.1)#72 |
| 72. | Santa Rita | 100.0% | 2.8%(+97.2)#5 | 3.9%(+96.1)#73 |
| 73. | Jessie | 100.0% | 1.9%(+98.1)#3 | 3.9%(+96.1)#74 |
| 74. | Oak Hall | 100.0% | 3.1%(+96.9)#3 | 3.9%(+96.1)#75 |
| 75. | Beaumont | 100.0% | 1.9%(+98.1)#1 | 3.9%(+96.1)#76 |
| 76. | Matheson | 100.0% | 3.4%(+96.6)#3 | 3.9%(+96.1)#77 |
| 77. | Crookston | 100.0% | 1.7%(+98.3)#1 | 3.9%(+96.1)#78 |
| 78. | Ardoch | 100.0% | 1.9%(+98.1)#4 | 3.9%(+96.1)#79 |
| 79. | Pedro Bay | 100.0% | 4.4%(+95.6)#4 | 3.9%(+96.1)#80 |
| 80. | Tonopah | 100.0% | 4.4%(+95.6)#3 | 3.9%(+96.1)#81 |
| 81. | Collings Lakes | 99.9% | 6.0%(+93.9)#4 | 3.9%(+96.0)#82 |
| 82. | Woodsville | 99.9% | 3.1%(+96.8)#1 | 3.9%(+96.0)#83 |
| 83. | Hemlock | 99.9% | 4.6%(+95.3)#5 | 3.9%(+96.0)#84 |
| 84. | Reedsville | 99.9% | 2.6%(+97.3)#1 | 3.9%(+96.0)#85 |
| 85. | Shiloh | 99.9% | 3.3%(+96.6)#3 | 3.9%(+96.0)#86 |
| 86. | Toledo | 99.9% | 3.4%(+96.5)#2 | 3.9%(+96.0)#87 |
| 87. | Creal Springs | 99.9% | 4.1%(+95.8)#4 | 3.9%(+96.0)#88 |
| 88. | Chula Vista Cdp Zavala County | 99.9% | 3.9%(+96.0)#4 | 3.9%(+96.0)#89 |
| 89. | Sheep Springs | 99.9% | 4.2%(+95.7)#4 | 3.9%(+96.0)#90 |
| 90. | Gilchrist | 99.9% | 4.7%(+95.2)#2 | 3.9%(+96.0)#91 |
| 91. | Lake Huntington | 99.9% | 4.6%(+95.3)#6 | 3.9%(+96.0)#92 |
| 92. | Heckscherville | 99.9% | 4.2%(+95.7)#6 | 3.9%(+96.0)#93 |
| 93. | Cloverland | 99.9% | 2.9%(+97.0)#3 | 3.9%(+96.0)#94 |
| 94. | Nada | 99.9% | 3.9%(+96.0)#5 | 3.9%(+96.0)#95 |
| 95. | Toxey | 99.9% | 2.5%(+97.4)#1 | 3.9%(+96.0)#96 |
| 96. | Helenwood | 99.9% | 3.1%(+96.8)#1 | 3.9%(+96.0)#97 |
| 97. | Wainwright | 99.9% | 2.1%(+97.8)#2 | 3.9%(+96.0)#98 |
| 98. | Campo Bonito | 99.9% | 4.4%(+95.5)#4 | 3.9%(+96.0)#99 |
| 99. | Timken | 99.9% | 1.9%(+98.0)#2 | 3.9%(+96.0)#100 |
| 100. | Keeler | 99.9% | 5.3%(+94.6)#5 | 3.9%(+96.0)#101 |
Common Questions
What are the Top 10 Cities with the Highest Unemployment Rate Amomg Seniors Over the Age of 65 in the United States?
Top 10 Cities with the Highest Unemployment Rate Amomg Seniors Over the Age of 65 in the United States are:
What city has the Highest Unemployment Rate Amomg Seniors Over the Age of 65 in the United States?
Montrose has the Highest Unemployment Rate Amomg Seniors Over the Age of 65 in the United States with 100.0%.
What is the Unemployment Rate Amomg Seniors Over the Age of 65 in the United States?
Unemployment Rate Amomg Seniors Over the Age of 65 in the United States is 3.9%.