Cities with the Highest Unemployment Rate Amomg Seniors Over the Age of 65 in Arizona
RELATED REPORTS & OPTIONS
Highest Unemployment | Senior > 65
Arizona
Compare Cities
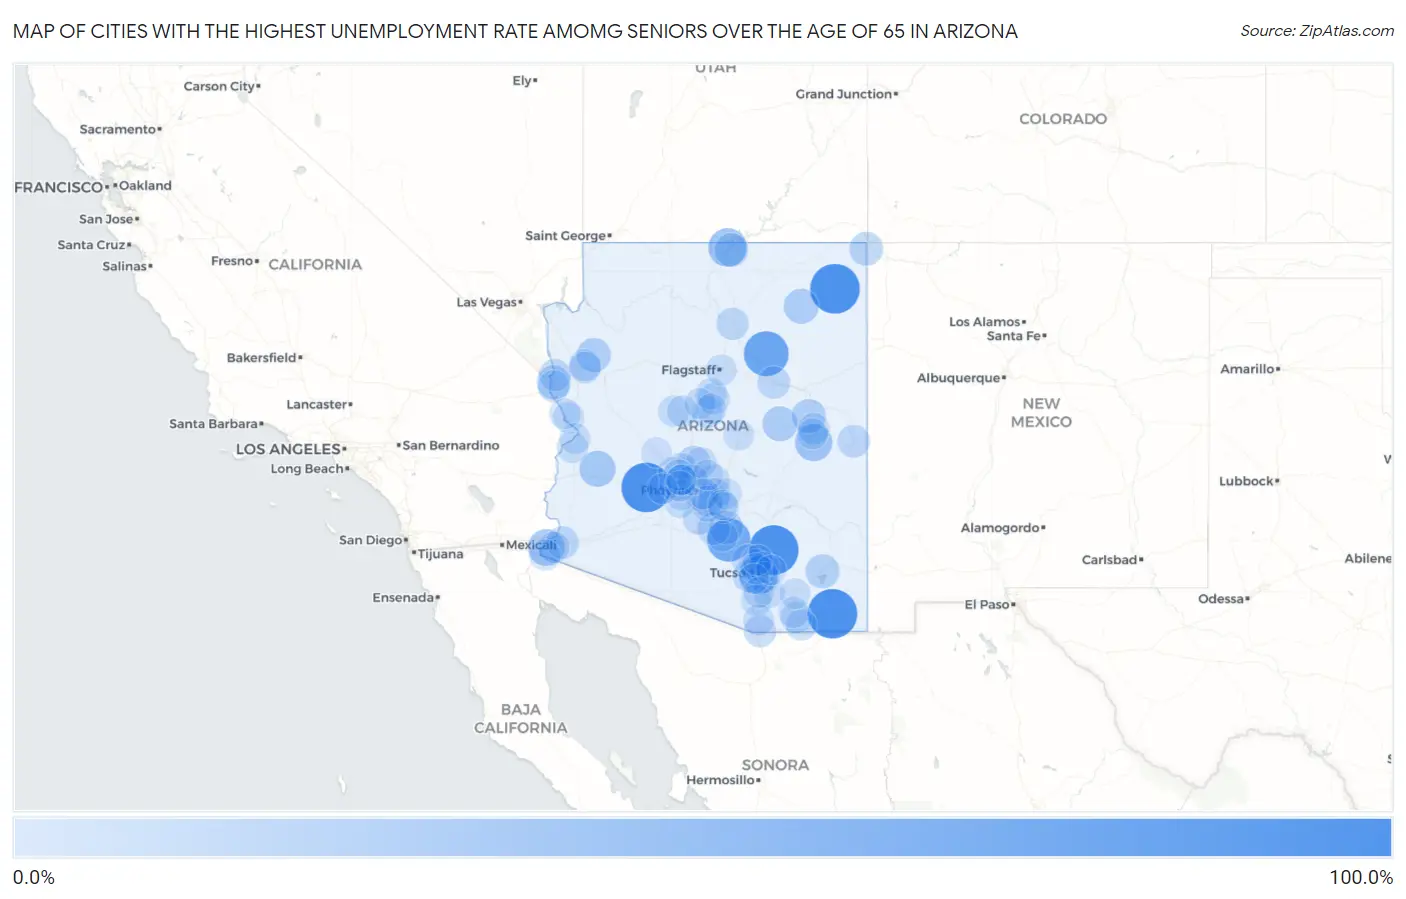
Map of Cities with the Highest Unemployment Rate Amomg Seniors Over the Age of 65 in Arizona
0.0%
100.0%
Cities with the Highest Unemployment Rate Amomg Seniors Over the Age of 65 in Arizona
| City | Senior Unemployment | vs State | vs National | |
| 1. | Many Farms | 100.0% | 4.4%(+95.6)#1 | 3.9%(+96.1)#11 |
| 2. | Mcneal | 100.0% | 4.4%(+95.6)#2 | 3.9%(+96.1)#19 |
| 3. | Tonopah | 100.0% | 4.4%(+95.6)#3 | 3.9%(+96.1)#80 |
| 4. | Campo Bonito | 99.9% | 4.4%(+95.5)#4 | 3.9%(+96.0)#98 |
| 5. | Tolani Lake | 74.8% | 4.4%(+70.4)#5 | 3.9%(+70.9)#162 |
| 6. | Picacho | 67.8% | 4.4%(+63.4)#6 | 3.9%(+63.9)#180 |
| 7. | South Tucson | 41.9% | 4.4%(+37.5)#7 | 3.9%(+38.0)#385 |
| 8. | Page | 41.3% | 4.4%(+36.9)#8 | 3.9%(+37.4)#392 |
| 9. | Lake Of The Woods | 35.7% | 4.4%(+31.3)#9 | 3.9%(+31.8)#497 |
| 10. | Somerton | 31.8% | 4.4%(+27.4)#10 | 3.9%(+27.9)#618 |
| 11. | Vicksburg | 29.6% | 4.4%(+25.2)#11 | 3.9%(+25.7)#682 |
| 12. | Pinon | 23.8% | 4.4%(+19.4)#12 | 3.9%(+19.9)#941 |
| 13. | Heber Overgaard | 23.5% | 4.4%(+19.1)#13 | 3.9%(+19.6)#950 |
| 14. | Snowflake | 19.9% | 4.4%(+15.5)#14 | 3.9%(+16.0)#1,163 |
| 15. | Valle Vista | 19.9% | 4.4%(+15.5)#15 | 3.9%(+16.0)#1,167 |
| 16. | Willcox | 18.7% | 4.4%(+14.3)#16 | 3.9%(+14.8)#1,259 |
| 17. | Fort Mohave | 17.7% | 4.4%(+13.3)#17 | 3.9%(+13.8)#1,362 |
| 18. | Coolidge | 17.7% | 4.4%(+13.3)#18 | 3.9%(+13.8)#1,363 |
| 19. | Teec Nos Pos | 17.6% | 4.4%(+13.2)#19 | 3.9%(+13.7)#1,377 |
| 20. | Lechee | 17.3% | 4.4%(+12.9)#20 | 3.9%(+13.4)#1,403 |
| 21. | Anthem | 15.7% | 4.4%(+11.3)#21 | 3.9%(+11.8)#1,594 |
| 22. | Casa Grande | 12.5% | 4.4%(+8.10)#22 | 3.9%(+8.60)#1,997 |
| 23. | Springerville | 12.1% | 4.4%(+7.70)#23 | 3.9%(+8.20)#2,104 |
| 24. | Fortuna Foothills | 12.0% | 4.4%(+7.60)#24 | 3.9%(+8.10)#2,109 |
| 25. | Winslow | 11.3% | 4.4%(+6.90)#25 | 3.9%(+7.40)#2,234 |
| 26. | Red Lake | 11.0% | 4.4%(+6.60)#26 | 3.9%(+7.10)#2,323 |
| 27. | Cameron | 10.5% | 4.4%(+6.10)#27 | 3.9%(+6.60)#2,424 |
| 28. | Bullhead City | 10.3% | 4.4%(+5.90)#28 | 3.9%(+6.40)#2,446 |
| 29. | Nogales | 10.1% | 4.4%(+5.70)#29 | 3.9%(+6.20)#2,514 |
| 30. | New Kingman Butler | 9.2% | 4.4%(+4.80)#30 | 3.9%(+5.30)#2,779 |
| 31. | Tucson Estates | 9.2% | 4.4%(+4.80)#31 | 3.9%(+5.30)#2,781 |
| 32. | Maricopa | 8.6% | 4.4%(+4.20)#32 | 3.9%(+4.70)#2,966 |
| 33. | Mesquite Creek | 8.3% | 4.4%(+3.90)#33 | 3.9%(+4.40)#3,102 |
| 34. | Kingman | 8.2% | 4.4%(+3.80)#34 | 3.9%(+4.30)#3,122 |
| 35. | Citrus Park | 8.0% | 4.4%(+3.60)#35 | 3.9%(+4.10)#3,196 |
| 36. | Peoria | 7.9% | 4.4%(+3.50)#36 | 3.9%(+4.00)#3,210 |
| 37. | Casas Adobes | 7.7% | 4.4%(+3.30)#37 | 3.9%(+3.80)#3,297 |
| 38. | Corona De Tucson | 7.4% | 4.4%(+3.00)#38 | 3.9%(+3.50)#3,417 |
| 39. | Camp Verde | 7.2% | 4.4%(+2.80)#39 | 3.9%(+3.30)#3,488 |
| 40. | Village Of Oak Creek Big Park | 7.0% | 4.4%(+2.60)#40 | 3.9%(+3.10)#3,582 |
| 41. | White Mountain Lake | 6.9% | 4.4%(+2.50)#41 | 3.9%(+3.00)#3,624 |
| 42. | Marana | 6.7% | 4.4%(+2.30)#42 | 3.9%(+2.80)#3,692 |
| 43. | Yuma | 6.4% | 4.4%(+2.00)#43 | 3.9%(+2.50)#3,841 |
| 44. | Prescott | 6.3% | 4.4%(+1.90)#44 | 3.9%(+2.40)#3,912 |
| 45. | Gilbert | 6.2% | 4.4%(+1.80)#45 | 3.9%(+2.30)#3,943 |
| 46. | Sun City | 6.2% | 4.4%(+1.80)#46 | 3.9%(+2.30)#3,950 |
| 47. | Sedona | 6.2% | 4.4%(+1.80)#47 | 3.9%(+2.30)#3,969 |
| 48. | Guadalupe | 6.1% | 4.4%(+1.70)#48 | 3.9%(+2.20)#4,041 |
| 49. | Sierra Vista | 5.8% | 4.4%(+1.40)#49 | 3.9%(+1.90)#4,173 |
| 50. | Fountain Hills | 5.5% | 4.4%(+1.10)#50 | 3.9%(+1.60)#4,328 |
| 51. | Prescott Valley | 5.4% | 4.4%(+1.00)#51 | 3.9%(+1.50)#4,378 |
| 52. | Tucson | 5.3% | 4.4%(+0.900)#52 | 3.9%(+1.40)#4,421 |
| 53. | Lake Havasu City | 5.3% | 4.4%(+0.900)#53 | 3.9%(+1.40)#4,437 |
| 54. | Surprise | 5.1% | 4.4%(+0.700)#54 | 3.9%(+1.20)#4,559 |
| 55. | Parker | 5.1% | 4.4%(+0.700)#55 | 3.9%(+1.20)#4,601 |
| 56. | Glendale | 5.0% | 4.4%(+0.600)#56 | 3.9%(+1.10)#4,626 |
| 57. | Goodyear | 5.0% | 4.4%(+0.600)#57 | 3.9%(+1.10)#4,634 |
| 58. | Mesa | 4.9% | 4.4%(+0.500)#58 | 3.9%(+1.00)#4,691 |
| 59. | Sierra Vista Southeast | 4.9% | 4.4%(+0.500)#59 | 3.9%(+1.00)#4,717 |
| 60. | Flagstaff | 4.7% | 4.4%(+0.300)#60 | 3.9%(+0.800)#4,808 |
| 61. | Catalina Foothills | 4.7% | 4.4%(+0.300)#61 | 3.9%(+0.800)#4,816 |
| 62. | San Luis | 4.7% | 4.4%(+0.300)#62 | 3.9%(+0.800)#4,822 |
| 63. | Green Valley | 4.7% | 4.4%(+0.300)#63 | 3.9%(+0.800)#4,828 |
| 64. | Cienega Springs | 4.7% | 4.4%(+0.300)#64 | 3.9%(+0.800)#4,864 |
| 65. | Flowing Wells | 4.5% | 4.4%(+0.100)#65 | 3.9%(+0.600)#4,993 |
| 66. | Cottonwood | 4.5% | 4.4%(+0.100)#66 | 3.9%(+0.600)#5,001 |
| 67. | Sun Lakes | 4.2% | 4.4%(-0.200)#67 | 3.9%(+0.300)#5,206 |
| 68. | Chandler | 4.1% | 4.4%(-0.300)#68 | 3.9%(+0.200)#5,251 |
| 69. | Payson | 4.0% | 4.4%(-0.400)#69 | 3.9%(+0.100)#5,368 |
| 70. | Tucson Mountains | 3.9% | 4.4%(-0.500)#70 | 3.9%(=0.000)#5,466 |
| 71. | Apache Junction | 3.8% | 4.4%(-0.600)#71 | 3.9%(-0.100)#5,518 |
| 72. | Huachuca City | 3.8% | 4.4%(-0.600)#72 | 3.9%(-0.100)#5,569 |
| 73. | Benson | 3.7% | 4.4%(-0.700)#73 | 3.9%(-0.200)#5,630 |
| 74. | Avondale | 3.6% | 4.4%(-0.800)#74 | 3.9%(-0.300)#5,653 |
| 75. | Rio Rico | 3.6% | 4.4%(-0.800)#75 | 3.9%(-0.300)#5,672 |
| 76. | Tempe | 3.5% | 4.4%(-0.900)#76 | 3.9%(-0.400)#5,722 |
| 77. | San Tan Valley | 3.5% | 4.4%(-0.900)#77 | 3.9%(-0.400)#5,726 |
| 78. | Desert Hills | 3.5% | 4.4%(-0.900)#78 | 3.9%(-0.400)#5,777 |
| 79. | Cave Creek | 3.4% | 4.4%(-1.00)#79 | 3.9%(-0.500)#5,848 |
| 80. | Phoenix | 3.3% | 4.4%(-1.10)#80 | 3.9%(-0.600)#5,863 |
| 81. | Show Low | 3.3% | 4.4%(-1.10)#81 | 3.9%(-0.600)#5,908 |
| 82. | Sun City West | 3.2% | 4.4%(-1.20)#82 | 3.9%(-0.700)#5,975 |
| 83. | Sahuarita | 3.1% | 4.4%(-1.30)#83 | 3.9%(-0.800)#6,052 |
| 84. | Scottsdale | 2.9% | 4.4%(-1.50)#84 | 3.9%(-1.00)#6,196 |
| 85. | Buckeye | 2.8% | 4.4%(-1.60)#85 | 3.9%(-1.10)#6,284 |
| 86. | Oro Valley | 2.4% | 4.4%(-2.00)#86 | 3.9%(-1.50)#6,591 |
| 87. | Eloy | 2.4% | 4.4%(-2.00)#87 | 3.9%(-1.50)#6,616 |
| 88. | Sunsites | 2.4% | 4.4%(-2.00)#88 | 3.9%(-1.50)#6,648 |
| 89. | Wickenburg | 2.2% | 4.4%(-2.20)#89 | 3.9%(-1.70)#6,773 |
| 90. | Drexel Heights | 2.0% | 4.4%(-2.40)#90 | 3.9%(-1.90)#6,871 |
| 91. | Lake Montezuma | 2.0% | 4.4%(-2.40)#91 | 3.9%(-1.90)#6,911 |
| 92. | Litchfield Park | 1.8% | 4.4%(-2.60)#92 | 3.9%(-2.10)#7,031 |
| 93. | El Mirage | 1.5% | 4.4%(-2.90)#93 | 3.9%(-2.40)#7,174 |
| 94. | Tanque Verde | 0.80% | 4.4%(-3.60)#94 | 3.9%(-3.10)#7,510 |
| 95. | Queen Creek | 0.70% | 4.4%(-3.70)#95 | 3.9%(-3.20)#7,520 |
1
2Common Questions
What are the Top 10 Cities with the Highest Unemployment Rate Amomg Seniors Over the Age of 65 in Arizona?
Top 10 Cities with the Highest Unemployment Rate Amomg Seniors Over the Age of 65 in Arizona are:
#1
100.0%
#2
100.0%
#3
100.0%
#4
99.9%
#5
74.8%
#6
67.8%
#7
41.9%
#8
41.3%
#9
35.7%
#10
31.8%
What city has the Highest Unemployment Rate Amomg Seniors Over the Age of 65 in Arizona?
Many Farms has the Highest Unemployment Rate Amomg Seniors Over the Age of 65 in Arizona with 100.0%.
What is the Unemployment Rate Amomg Seniors Over the Age of 65 in the State of Arizona?
Unemployment Rate Amomg Seniors Over the Age of 65 in Arizona is 4.4%.
What is the Unemployment Rate Amomg Seniors Over the Age of 65 in the United States?
Unemployment Rate Amomg Seniors Over the Age of 65 in the United States is 3.9%.