Cities with the Highest Unemployment Rate Amomg Seniors Over the Age of 65 in Missouri
RELATED REPORTS & OPTIONS
Highest Unemployment | Senior > 65
Missouri
Compare Cities
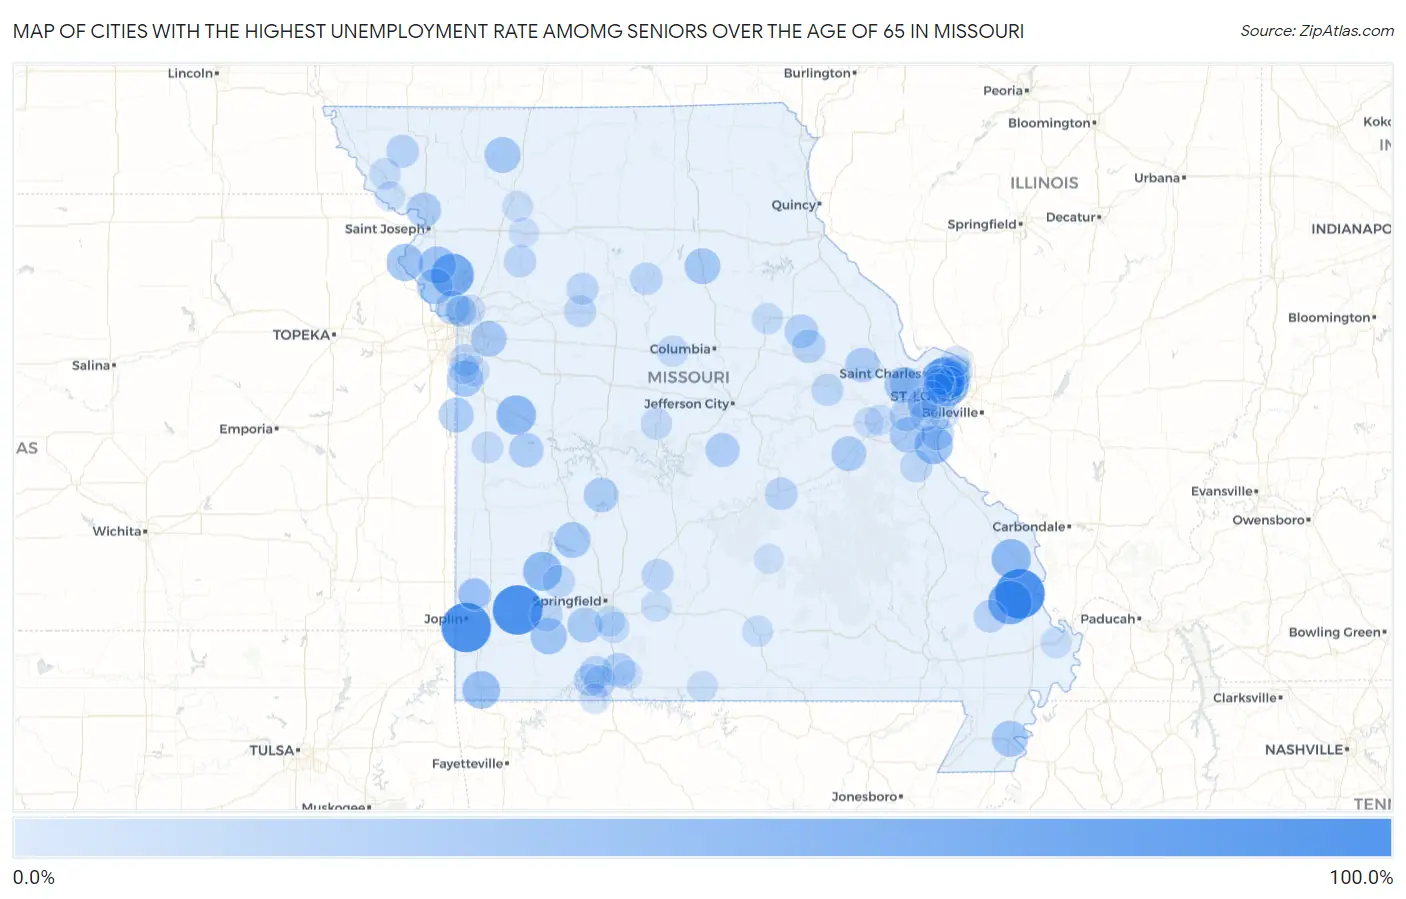
Map of Cities with the Highest Unemployment Rate Amomg Seniors Over the Age of 65 in Missouri
0.0%
100.0%
Cities with the Highest Unemployment Rate Amomg Seniors Over the Age of 65 in Missouri
| City | Senior Unemployment | vs State | vs National | |
| 1. | Shakertowne | 100.0% | 3.0%(+97.0)#1 | 3.9%(+96.1)#14 |
| 2. | La Russell | 100.0% | 3.0%(+97.0)#2 | 3.9%(+96.1)#21 |
| 3. | Dutchtown | 100.0% | 3.0%(+97.0)#3 | 3.9%(+96.1)#51 |
| 4. | Redings Mill | 100.0% | 3.0%(+97.0)#4 | 3.9%(+96.1)#62 |
| 5. | Delta | 71.3% | 3.0%(+68.3)#5 | 3.9%(+67.4)#168 |
| 6. | Kinloch | 66.9% | 3.0%(+63.9)#6 | 3.9%(+63.0)#182 |
| 7. | Ridgely | 66.6% | 3.0%(+63.6)#7 | 3.9%(+62.7)#193 |
| 8. | Northwoods | 63.2% | 3.0%(+60.2)#8 | 3.9%(+59.3)#207 |
| 9. | Creighton | 50.0% | 3.0%(+47.0)#9 | 3.9%(+46.1)#275 |
| 10. | Oak Ridge | 50.0% | 3.0%(+47.0)#10 | 3.9%(+46.1)#276 |
| 11. | Greenfield | 48.3% | 3.0%(+45.3)#11 | 3.9%(+44.4)#310 |
| 12. | Calverton Park | 46.6% | 3.0%(+43.6)#12 | 3.9%(+42.7)#329 |
| 13. | Pevely | 45.0% | 3.0%(+42.0)#13 | 3.9%(+41.1)#346 |
| 14. | Pineville | 42.1% | 3.0%(+39.1)#14 | 3.9%(+38.2)#383 |
| 15. | Dearborn | 40.0% | 3.0%(+37.0)#15 | 3.9%(+36.1)#411 |
| 16. | Lewis And Clark Village | 39.9% | 3.0%(+36.9)#16 | 3.9%(+36.0)#433 |
| 17. | Verona | 35.4% | 3.0%(+32.4)#17 | 3.9%(+31.5)#508 |
| 18. | Hayti | 34.5% | 3.0%(+31.5)#18 | 3.9%(+30.6)#523 |
| 19. | Cairo | 33.4% | 3.0%(+30.4)#19 | 3.9%(+29.5)#548 |
| 20. | Fair Play | 33.3% | 3.0%(+30.3)#20 | 3.9%(+29.4)#562 |
| 21. | New Hampton | 33.3% | 3.0%(+30.3)#21 | 3.9%(+29.4)#567 |
| 22. | Tracy | 33.3% | 3.0%(+30.3)#22 | 3.9%(+29.4)#574 |
| 23. | Riverview Estates | 33.3% | 3.0%(+30.3)#23 | 3.9%(+29.4)#587 |
| 24. | Weldon Spring Heights | 33.2% | 3.0%(+30.2)#24 | 3.9%(+29.3)#599 |
| 25. | Moline Acres | 32.0% | 3.0%(+29.0)#25 | 3.9%(+28.1)#613 |
| 26. | Lake Tapawingo | 31.9% | 3.0%(+28.9)#26 | 3.9%(+28.0)#617 |
| 27. | Cedar Hill | 31.0% | 3.0%(+28.0)#27 | 3.9%(+27.1)#649 |
| 28. | Norwood Court | 29.4% | 3.0%(+26.4)#28 | 3.9%(+25.5)#693 |
| 29. | Clever | 29.2% | 3.0%(+26.2)#29 | 3.9%(+25.3)#702 |
| 30. | Drexel | 28.5% | 3.0%(+25.5)#30 | 3.9%(+24.6)#728 |
| 31. | Oak Grove Village | 28.5% | 3.0%(+25.5)#31 | 3.9%(+24.6)#733 |
| 32. | Amazonia | 28.5% | 3.0%(+25.5)#32 | 3.9%(+24.6)#737 |
| 33. | Wright City | 28.1% | 3.0%(+25.1)#33 | 3.9%(+24.2)#754 |
| 34. | Hermitage | 28.0% | 3.0%(+25.0)#34 | 3.9%(+24.1)#758 |
| 35. | Montrose | 27.2% | 3.0%(+24.2)#35 | 3.9%(+23.3)#788 |
| 36. | Merriam Woods | 25.0% | 3.0%(+22.0)#36 | 3.9%(+21.1)#858 |
| 37. | St Elizabeth | 24.9% | 3.0%(+21.9)#37 | 3.9%(+21.0)#890 |
| 38. | Lake Waukomis | 24.0% | 3.0%(+21.0)#38 | 3.9%(+20.1)#930 |
| 39. | Wellsville | 23.0% | 3.0%(+20.0)#39 | 3.9%(+19.1)#978 |
| 40. | Montgomery City | 22.6% | 3.0%(+19.6)#40 | 3.9%(+18.7)#994 |
| 41. | Weldon Spring | 21.2% | 3.0%(+18.2)#41 | 3.9%(+17.3)#1,077 |
| 42. | Imperial | 20.3% | 3.0%(+17.3)#42 | 3.9%(+16.4)#1,128 |
| 43. | Skidmore | 20.0% | 3.0%(+17.0)#43 | 3.9%(+16.1)#1,159 |
| 44. | Mount Vernon | 19.7% | 3.0%(+16.7)#44 | 3.9%(+15.8)#1,196 |
| 45. | Advance | 19.3% | 3.0%(+16.3)#45 | 3.9%(+15.4)#1,215 |
| 46. | Branson West | 19.1% | 3.0%(+16.1)#46 | 3.9%(+15.2)#1,228 |
| 47. | Eureka | 19.0% | 3.0%(+16.0)#47 | 3.9%(+15.1)#1,230 |
| 48. | Rolla | 18.8% | 3.0%(+15.8)#48 | 3.9%(+14.9)#1,246 |
| 49. | Polo | 18.1% | 3.0%(+15.1)#49 | 3.9%(+14.2)#1,325 |
| 50. | Keytesville | 18.1% | 3.0%(+15.1)#50 | 3.9%(+14.2)#1,328 |
| 51. | Everton | 18.1% | 3.0%(+15.1)#51 | 3.9%(+14.2)#1,331 |
| 52. | Purcell | 17.6% | 3.0%(+14.6)#52 | 3.9%(+13.7)#1,381 |
| 53. | De Soto | 17.4% | 3.0%(+14.4)#53 | 3.9%(+13.5)#1,389 |
| 54. | Spanish Lake | 16.9% | 3.0%(+13.9)#54 | 3.9%(+13.0)#1,436 |
| 55. | Kimberling City | 16.6% | 3.0%(+13.6)#55 | 3.9%(+12.7)#1,465 |
| 56. | Niangua | 16.6% | 3.0%(+13.6)#56 | 3.9%(+12.7)#1,487 |
| 57. | Berger | 16.6% | 3.0%(+13.6)#57 | 3.9%(+12.7)#1,504 |
| 58. | Waverly | 16.1% | 3.0%(+13.1)#58 | 3.9%(+12.2)#1,560 |
| 59. | Carrollton | 15.9% | 3.0%(+12.9)#59 | 3.9%(+12.0)#1,578 |
| 60. | Uplands Park | 15.4% | 3.0%(+12.4)#60 | 3.9%(+11.5)#1,632 |
| 61. | Indian Point | 15.3% | 3.0%(+12.3)#61 | 3.9%(+11.4)#1,648 |
| 62. | Grandview | 14.7% | 3.0%(+11.7)#62 | 3.9%(+10.8)#1,706 |
| 63. | Butler | 14.3% | 3.0%(+11.3)#63 | 3.9%(+10.4)#1,738 |
| 64. | Neck City | 14.2% | 3.0%(+11.2)#64 | 3.9%(+10.3)#1,789 |
| 65. | Versailles | 13.9% | 3.0%(+10.9)#65 | 3.9%(+10.00)#1,816 |
| 66. | Mound City | 13.4% | 3.0%(+10.4)#66 | 3.9%(+9.50)#1,885 |
| 67. | Mexico | 13.1% | 3.0%(+10.1)#67 | 3.9%(+9.20)#1,924 |
| 68. | Windsor Place | 12.5% | 3.0%(+9.50)#68 | 3.9%(+8.60)#2,019 |
| 69. | Ozark | 12.3% | 3.0%(+9.30)#69 | 3.9%(+8.40)#2,072 |
| 70. | Woodson Terrace | 12.1% | 3.0%(+9.10)#70 | 3.9%(+8.20)#2,099 |
| 71. | Willow Springs | 11.6% | 3.0%(+8.60)#71 | 3.9%(+7.70)#2,184 |
| 72. | Charleston | 11.5% | 3.0%(+8.50)#72 | 3.9%(+7.60)#2,193 |
| 73. | Jennings | 11.3% | 3.0%(+8.30)#73 | 3.9%(+7.40)#2,231 |
| 74. | St John | 11.1% | 3.0%(+8.10)#74 | 3.9%(+7.20)#2,269 |
| 75. | Diggins | 11.1% | 3.0%(+8.10)#75 | 3.9%(+7.20)#2,300 |
| 76. | Oakview | 11.0% | 3.0%(+8.00)#76 | 3.9%(+7.10)#2,331 |
| 77. | Fremont Hills | 10.8% | 3.0%(+7.80)#77 | 3.9%(+6.90)#2,357 |
| 78. | Valley Park | 10.5% | 3.0%(+7.50)#78 | 3.9%(+6.60)#2,409 |
| 79. | Raymore | 10.4% | 3.0%(+7.40)#79 | 3.9%(+6.50)#2,431 |
| 80. | Edmundson | 10.0% | 3.0%(+7.00)#80 | 3.9%(+6.10)#2,550 |
| 81. | Villa Ridge | 9.7% | 3.0%(+6.70)#81 | 3.9%(+5.80)#2,635 |
| 82. | Mehlville | 9.6% | 3.0%(+6.60)#82 | 3.9%(+5.70)#2,644 |
| 83. | Lake Viking | 9.6% | 3.0%(+6.60)#83 | 3.9%(+5.70)#2,671 |
| 84. | Gainesville | 9.5% | 3.0%(+6.50)#84 | 3.9%(+5.60)#2,702 |
| 85. | Belton | 9.4% | 3.0%(+6.40)#85 | 3.9%(+5.50)#2,713 |
| 86. | Gladstone | 9.3% | 3.0%(+6.30)#86 | 3.9%(+5.40)#2,741 |
| 87. | Pleasant Valley | 9.2% | 3.0%(+6.20)#87 | 3.9%(+5.30)#2,795 |
| 88. | West Alton | 9.0% | 3.0%(+6.00)#88 | 3.9%(+5.10)#2,874 |
| 89. | Blue Eye | 8.9% | 3.0%(+5.90)#89 | 3.9%(+5.00)#2,911 |
| 90. | Twin Oaks | 8.5% | 3.0%(+5.50)#90 | 3.9%(+4.60)#3,032 |
| 91. | Crystal Lake Park | 8.5% | 3.0%(+5.50)#91 | 3.9%(+4.60)#3,033 |
| 92. | Forest City | 8.3% | 3.0%(+5.30)#92 | 3.9%(+4.40)#3,111 |
| 93. | Union | 7.8% | 3.0%(+4.80)#93 | 3.9%(+3.90)#3,267 |
| 94. | Manchester | 7.6% | 3.0%(+4.60)#94 | 3.9%(+3.70)#3,332 |
| 95. | Hamilton | 7.6% | 3.0%(+4.60)#95 | 3.9%(+3.70)#3,352 |
| 96. | Murphy | 7.5% | 3.0%(+4.50)#96 | 3.9%(+3.60)#3,383 |
| 97. | Oakland | 7.3% | 3.0%(+4.30)#97 | 3.9%(+3.40)#3,470 |
| 98. | Licking | 7.2% | 3.0%(+4.20)#98 | 3.9%(+3.30)#3,502 |
| 99. | Olivette | 6.9% | 3.0%(+3.90)#99 | 3.9%(+3.00)#3,611 |
| 100. | Forsyth | 6.6% | 3.0%(+3.60)#100 | 3.9%(+2.70)#3,761 |
Common Questions
What are the Top 10 Cities with the Highest Unemployment Rate Amomg Seniors Over the Age of 65 in Missouri?
Top 10 Cities with the Highest Unemployment Rate Amomg Seniors Over the Age of 65 in Missouri are:
#1
100.0%
#2
100.0%
#3
100.0%
#4
71.3%
#5
66.9%
#6
66.6%
#7
63.2%
#8
50.0%
#9
50.0%
#10
48.3%
What city has the Highest Unemployment Rate Amomg Seniors Over the Age of 65 in Missouri?
La Russell has the Highest Unemployment Rate Amomg Seniors Over the Age of 65 in Missouri with 100.0%.
What is the Unemployment Rate Amomg Seniors Over the Age of 65 in the State of Missouri?
Unemployment Rate Amomg Seniors Over the Age of 65 in Missouri is 3.0%.
What is the Unemployment Rate Amomg Seniors Over the Age of 65 in the United States?
Unemployment Rate Amomg Seniors Over the Age of 65 in the United States is 3.9%.