Cities with the Highest Unemployment Rate Amomg Seniors Over the Age of 65 in Pennsylvania
RELATED REPORTS & OPTIONS
Highest Unemployment | Senior > 65
Pennsylvania
Compare Cities
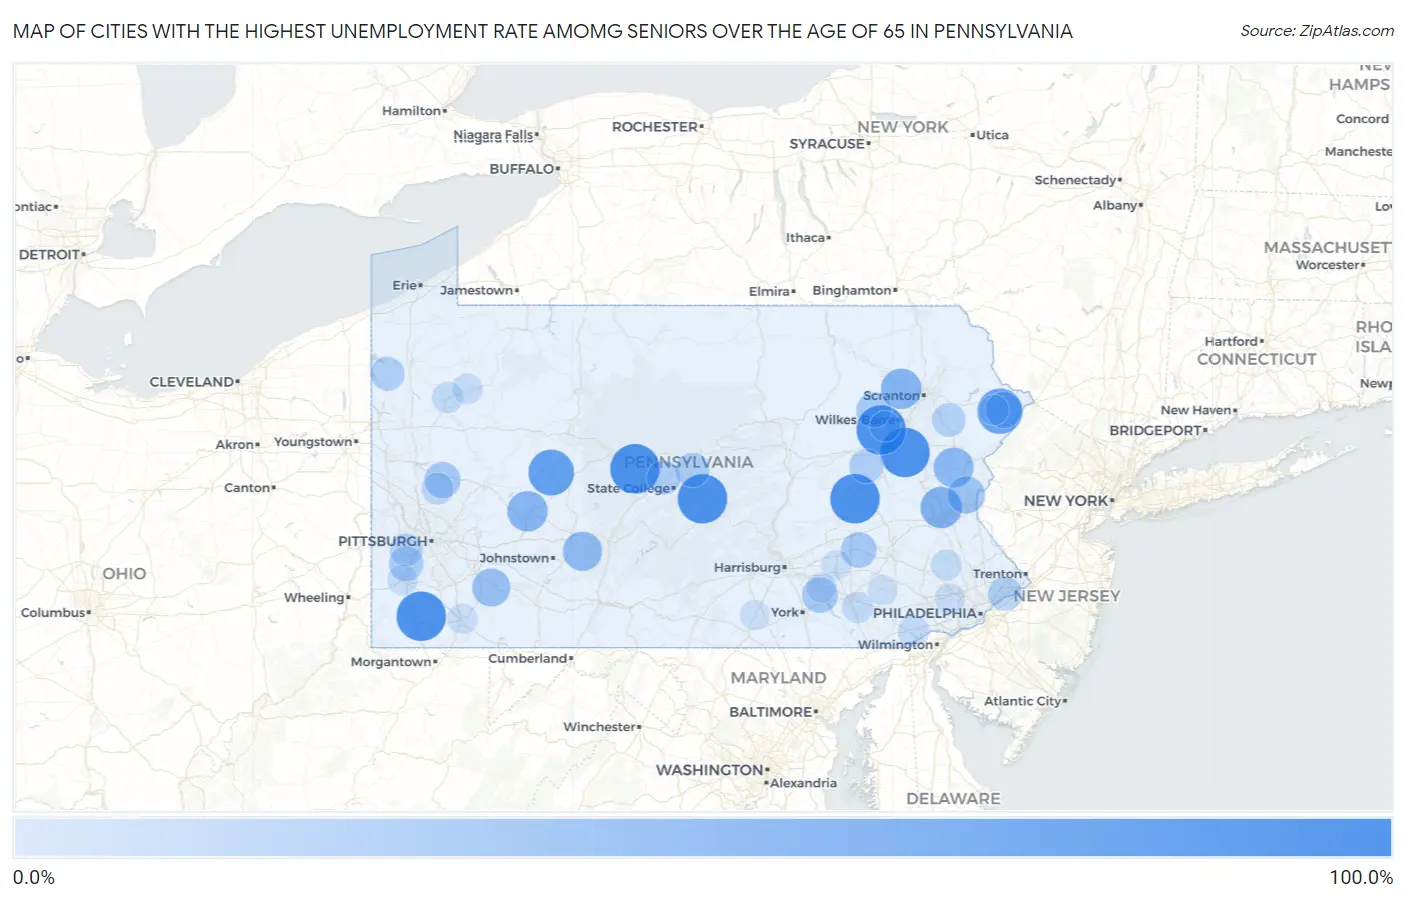
Map of Cities with the Highest Unemployment Rate Amomg Seniors Over the Age of 65 in Pennsylvania
0.0%
100.0%
Cities with the Highest Unemployment Rate Amomg Seniors Over the Age of 65 in Pennsylvania
| City | Senior Unemployment | vs State | vs National | |
| 1. | Mather | 100.0% | 4.2%(+95.8)#1 | 3.9%(+96.1)#7 |
| 2. | Hickory Hills | 100.0% | 4.2%(+95.8)#2 | 3.9%(+96.1)#16 |
| 3. | Wanamie | 100.0% | 4.2%(+95.8)#3 | 3.9%(+96.1)#32 |
| 4. | Hawk Run | 100.0% | 4.2%(+95.8)#4 | 3.9%(+96.1)#33 |
| 5. | Potlicker Flats | 100.0% | 4.2%(+95.8)#5 | 3.9%(+96.1)#57 |
| 6. | Heckscherville | 99.9% | 4.2%(+95.7)#6 | 3.9%(+96.0)#92 |
| 7. | Twilight Borough | 99.3% | 4.2%(+95.1)#7 | 3.9%(+95.4)#116 |
| 8. | Homewood Borough | 99.3% | 4.2%(+95.1)#8 | 3.9%(+95.4)#117 |
| 9. | Rossiter | 83.4% | 4.2%(+79.2)#9 | 3.9%(+79.5)#135 |
| 10. | Conashaugh Lakes | 82.0% | 4.2%(+77.8)#10 | 3.9%(+78.1)#138 |
| 11. | Sadsburyville | 75.7% | 4.2%(+71.5)#11 | 3.9%(+71.8)#155 |
| 12. | Clintonville Borough | 71.3% | 4.2%(+67.1)#12 | 3.9%(+67.4)#169 |
| 13. | Grampian Borough | 70.9% | 4.2%(+66.7)#13 | 3.9%(+67.0)#171 |
| 14. | Stiles | 64.8% | 4.2%(+60.6)#14 | 3.9%(+60.9)#200 |
| 15. | West Falls | 61.0% | 4.2%(+56.8)#15 | 3.9%(+57.1)#220 |
| 16. | Chevy Chase Heights | 60.7% | 4.2%(+56.5)#16 | 3.9%(+56.8)#222 |
| 17. | York Haven Borough | 60.6% | 4.2%(+56.4)#17 | 3.9%(+56.7)#223 |
| 18. | Rices Landing Borough | 59.8% | 4.2%(+55.6)#18 | 3.9%(+55.9)#227 |
| 19. | Brodheadsville | 58.7% | 4.2%(+54.5)#19 | 3.9%(+54.8)#231 |
| 20. | Shade Gap Borough | 55.5% | 4.2%(+51.3)#20 | 3.9%(+51.6)#247 |
| 21. | Spring Hill | 55.3% | 4.2%(+51.1)#21 | 3.9%(+51.4)#249 |
| 22. | Bear Rocks | 50.0% | 4.2%(+45.8)#22 | 3.9%(+46.1)#270 |
| 23. | Koppel Borough | 49.9% | 4.2%(+45.7)#23 | 3.9%(+46.0)#286 |
| 24. | Venango Borough | 49.9% | 4.2%(+45.7)#24 | 3.9%(+46.0)#294 |
| 25. | Biglerville Borough | 48.7% | 4.2%(+44.5)#25 | 3.9%(+44.8)#306 |
| 26. | Bendersville Borough | 48.4% | 4.2%(+44.2)#26 | 3.9%(+44.5)#309 |
| 27. | Eastlawn Gardens | 47.4% | 4.2%(+43.2)#27 | 3.9%(+43.5)#319 |
| 28. | Renovo Borough | 47.1% | 4.2%(+42.9)#28 | 3.9%(+43.2)#322 |
| 29. | Girard Borough | 46.7% | 4.2%(+42.5)#29 | 3.9%(+42.8)#327 |
| 30. | Mount Oliver Borough | 45.2% | 4.2%(+41.0)#30 | 3.9%(+41.3)#345 |
| 31. | Richlandtown Borough | 43.4% | 4.2%(+39.2)#31 | 3.9%(+39.5)#362 |
| 32. | Sunrise Lake | 43.2% | 4.2%(+39.0)#32 | 3.9%(+39.3)#367 |
| 33. | Meadowood | 42.2% | 4.2%(+38.0)#33 | 3.9%(+38.3)#380 |
| 34. | Jefferson Borough Greene County | 41.6% | 4.2%(+37.4)#34 | 3.9%(+37.7)#389 |
| 35. | Maytown | 41.1% | 4.2%(+36.9)#35 | 3.9%(+37.2)#397 |
| 36. | Stouchsburg | 39.9% | 4.2%(+35.7)#36 | 3.9%(+36.0)#427 |
| 37. | Pikes Creek | 38.4% | 4.2%(+34.2)#37 | 3.9%(+34.5)#453 |
| 38. | Hallam Borough | 37.7% | 4.2%(+33.5)#38 | 3.9%(+33.8)#462 |
| 39. | Muse | 35.9% | 4.2%(+31.7)#39 | 3.9%(+32.0)#493 |
| 40. | Bernville Borough | 35.9% | 4.2%(+31.7)#40 | 3.9%(+32.0)#494 |
| 41. | Hallstead Borough | 35.5% | 4.2%(+31.3)#41 | 3.9%(+31.6)#505 |
| 42. | Zion | 34.9% | 4.2%(+30.7)#42 | 3.9%(+31.0)#512 |
| 43. | Flemington Borough | 34.0% | 4.2%(+29.8)#43 | 3.9%(+30.1)#530 |
| 44. | Eddington | 33.3% | 4.2%(+29.1)#44 | 3.9%(+29.4)#551 |
| 45. | Homer City Borough | 33.3% | 4.2%(+29.1)#45 | 3.9%(+29.4)#552 |
| 46. | Loretto Borough | 33.3% | 4.2%(+29.1)#46 | 3.9%(+29.4)#553 |
| 47. | Meshoppen Borough | 33.3% | 4.2%(+29.1)#47 | 3.9%(+29.4)#566 |
| 48. | Nuremberg | 33.3% | 4.2%(+29.1)#48 | 3.9%(+29.4)#570 |
| 49. | Julian | 33.3% | 4.2%(+29.1)#49 | 3.9%(+29.4)#572 |
| 50. | Hartstown | 33.3% | 4.2%(+29.1)#50 | 3.9%(+29.4)#578 |
| 51. | Gouldsboro | 32.4% | 4.2%(+28.2)#51 | 3.9%(+28.5)#606 |
| 52. | West Liberty Borough | 31.5% | 4.2%(+27.3)#52 | 3.9%(+27.6)#633 |
| 53. | Frisco | 31.2% | 4.2%(+27.0)#53 | 3.9%(+27.3)#642 |
| 54. | Freeport Borough | 30.7% | 4.2%(+26.5)#54 | 3.9%(+26.8)#653 |
| 55. | Dunlevy Borough | 30.7% | 4.2%(+26.5)#55 | 3.9%(+26.8)#656 |
| 56. | Grove City Borough | 30.0% | 4.2%(+25.8)#56 | 3.9%(+26.1)#671 |
| 57. | Ford City Borough | 29.5% | 4.2%(+25.3)#57 | 3.9%(+25.6)#686 |
| 58. | Sturgeon | 29.2% | 4.2%(+25.0)#58 | 3.9%(+25.3)#703 |
| 59. | Georgetown Cdp Lancaster County | 28.9% | 4.2%(+24.7)#59 | 3.9%(+25.0)#712 |
| 60. | Port Clinton Borough | 28.5% | 4.2%(+24.3)#60 | 3.9%(+24.6)#734 |
| 61. | Valley View Cdp York County | 27.8% | 4.2%(+23.6)#61 | 3.9%(+23.9)#766 |
| 62. | Dickson City Borough | 27.5% | 4.2%(+23.3)#62 | 3.9%(+23.6)#778 |
| 63. | West Brownsville Borough | 27.4% | 4.2%(+23.2)#63 | 3.9%(+23.5)#782 |
| 64. | Middletown Borough | 26.6% | 4.2%(+22.4)#64 | 3.9%(+22.7)#804 |
| 65. | Fawn Grove Borough | 26.5% | 4.2%(+22.3)#65 | 3.9%(+22.6)#811 |
| 66. | Mcconnellsburg Borough | 25.2% | 4.2%(+21.0)#66 | 3.9%(+21.3)#851 |
| 67. | Yorkana Borough | 25.0% | 4.2%(+20.8)#67 | 3.9%(+21.1)#877 |
| 68. | Carrolltown Borough | 24.9% | 4.2%(+20.7)#68 | 3.9%(+21.0)#885 |
| 69. | Nixon | 24.7% | 4.2%(+20.5)#69 | 3.9%(+20.8)#906 |
| 70. | Penbrook Borough | 23.1% | 4.2%(+18.9)#70 | 3.9%(+19.2)#965 |
| 71. | Tunkhannock Borough | 23.1% | 4.2%(+18.9)#71 | 3.9%(+19.2)#966 |
| 72. | Toughkenamon | 22.7% | 4.2%(+18.5)#72 | 3.9%(+18.8)#993 |
| 73. | Franklin | 22.2% | 4.2%(+18.0)#73 | 3.9%(+18.3)#1,007 |
| 74. | Lampeter | 22.2% | 4.2%(+18.0)#74 | 3.9%(+18.3)#1,009 |
| 75. | Mont Alto Borough | 21.9% | 4.2%(+17.7)#75 | 3.9%(+18.0)#1,040 |
| 76. | Manor Borough | 21.7% | 4.2%(+17.5)#76 | 3.9%(+17.8)#1,055 |
| 77. | Emlenton Borough | 21.2% | 4.2%(+17.0)#77 | 3.9%(+17.3)#1,083 |
| 78. | Spring Mount | 20.8% | 4.2%(+16.6)#78 | 3.9%(+16.9)#1,108 |
| 79. | Saxton Borough | 20.0% | 4.2%(+15.8)#79 | 3.9%(+16.1)#1,148 |
| 80. | Summerville Borough | 19.9% | 4.2%(+15.7)#80 | 3.9%(+16.0)#1,180 |
| 81. | Braddock Hills Borough | 19.6% | 4.2%(+15.4)#81 | 3.9%(+15.7)#1,201 |
| 82. | Hasson Heights | 19.6% | 4.2%(+15.4)#82 | 3.9%(+15.7)#1,202 |
| 83. | Washington | 19.2% | 4.2%(+15.0)#83 | 3.9%(+15.3)#1,218 |
| 84. | Beallsville Borough | 19.2% | 4.2%(+15.0)#84 | 3.9%(+15.3)#1,225 |
| 85. | Milford Borough | 18.7% | 4.2%(+14.5)#85 | 3.9%(+14.8)#1,260 |
| 86. | Nanticoke | 18.6% | 4.2%(+14.4)#86 | 3.9%(+14.7)#1,270 |
| 87. | Oliver | 18.6% | 4.2%(+14.4)#87 | 3.9%(+14.7)#1,275 |
| 88. | Verona Borough | 18.4% | 4.2%(+14.2)#88 | 3.9%(+14.5)#1,294 |
| 89. | Mckees Rocks Borough | 18.3% | 4.2%(+14.1)#89 | 3.9%(+14.4)#1,301 |
| 90. | Devon | 18.3% | 4.2%(+14.1)#90 | 3.9%(+14.4)#1,303 |
| 91. | West Mayfield Borough | 18.1% | 4.2%(+13.9)#91 | 3.9%(+14.2)#1,320 |
| 92. | Glen Osborne Borough | 18.1% | 4.2%(+13.9)#92 | 3.9%(+14.2)#1,327 |
| 93. | Ursina Borough | 18.1% | 4.2%(+13.9)#93 | 3.9%(+14.2)#1,333 |
| 94. | East Earl | 17.9% | 4.2%(+13.7)#94 | 3.9%(+14.0)#1,347 |
| 95. | Blairsville Borough | 17.6% | 4.2%(+13.4)#95 | 3.9%(+13.7)#1,371 |
| 96. | Quentin | 17.6% | 4.2%(+13.4)#96 | 3.9%(+13.7)#1,380 |
| 97. | Heidlersburg | 17.4% | 4.2%(+13.2)#97 | 3.9%(+13.5)#1,395 |
| 98. | Hemlock Farms | 17.3% | 4.2%(+13.1)#98 | 3.9%(+13.4)#1,401 |
| 99. | Rheems | 17.3% | 4.2%(+13.1)#99 | 3.9%(+13.4)#1,402 |
| 100. | Parkesburg Borough | 17.0% | 4.2%(+12.8)#100 | 3.9%(+13.1)#1,428 |
Common Questions
What are the Top 10 Cities with the Highest Unemployment Rate Amomg Seniors Over the Age of 65 in Pennsylvania?
Top 10 Cities with the Highest Unemployment Rate Amomg Seniors Over the Age of 65 in Pennsylvania are:
#1
100.0%
#2
100.0%
#3
100.0%
#4
100.0%
#5
100.0%
#6
99.9%
#7
83.4%
#8
82.0%
#9
64.8%
#10
61.0%
What city has the Highest Unemployment Rate Amomg Seniors Over the Age of 65 in Pennsylvania?
Mather has the Highest Unemployment Rate Amomg Seniors Over the Age of 65 in Pennsylvania with 100.0%.
What is the Unemployment Rate Amomg Seniors Over the Age of 65 in the State of Pennsylvania?
Unemployment Rate Amomg Seniors Over the Age of 65 in Pennsylvania is 4.2%.
What is the Unemployment Rate Amomg Seniors Over the Age of 65 in the United States?
Unemployment Rate Amomg Seniors Over the Age of 65 in the United States is 3.9%.