Cities with the Highest Unemployment Rate Amomg Seniors Over the Age of 65 in Massachusetts
RELATED REPORTS & OPTIONS
Highest Unemployment | Senior > 65
Massachusetts
Compare Cities
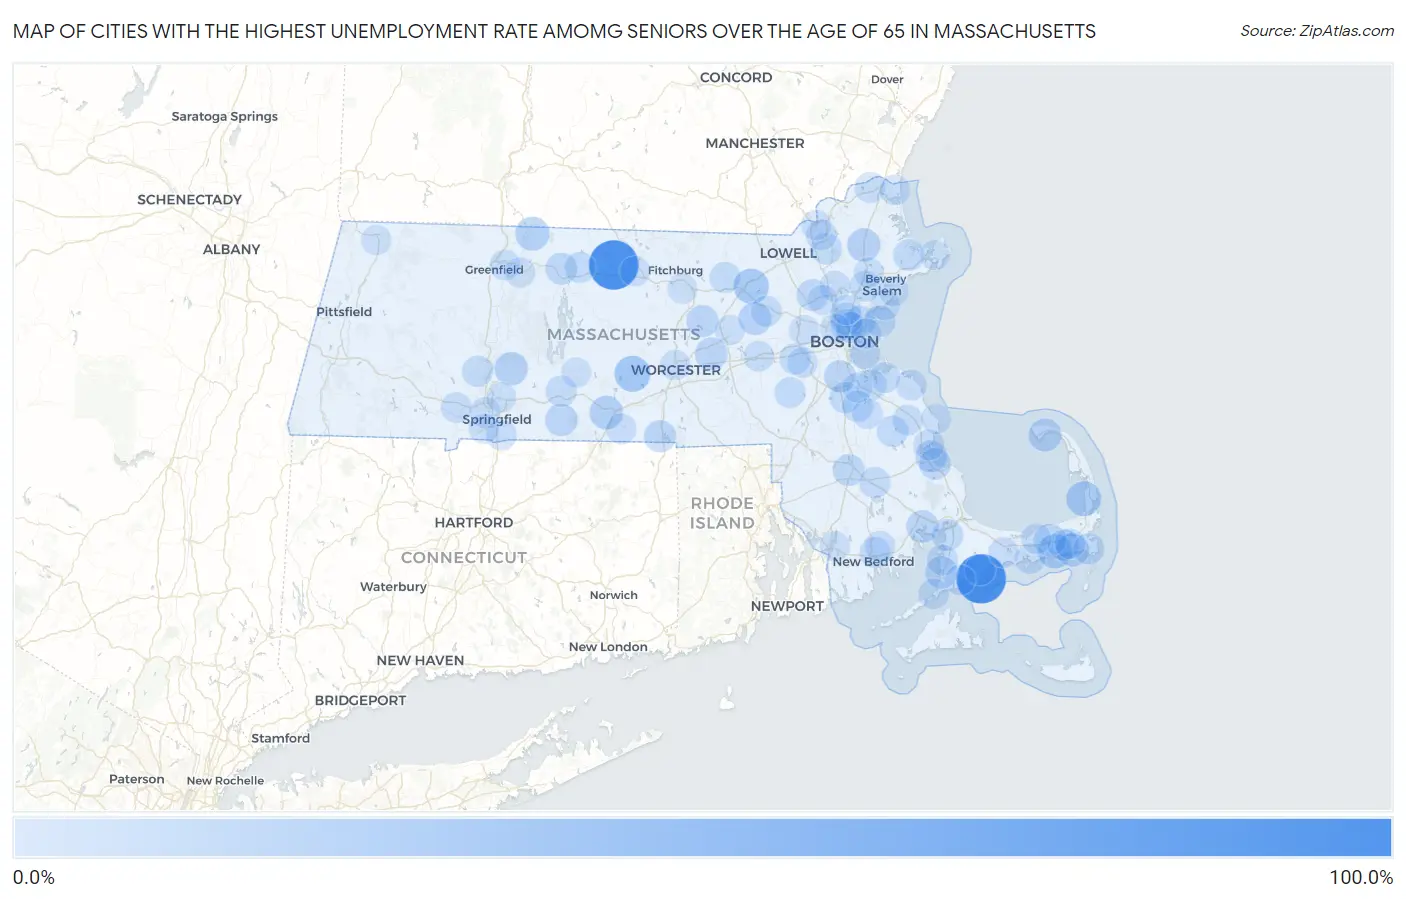
Map of Cities with the Highest Unemployment Rate Amomg Seniors Over the Age of 65 in Massachusetts
0.0%
100.0%
Cities with the Highest Unemployment Rate Amomg Seniors Over the Age of 65 in Massachusetts
| City | Senior Unemployment | vs State | vs National | |
| 1. | Baldwinville | 100.0% | 4.6%(+95.4)#1 | 3.9%(+96.1)#6 |
| 2. | Popponesset | 99.8% | 4.6%(+95.2)#2 | 3.9%(+95.9)#106 |
| 3. | Spencer | 31.9% | 4.6%(+27.3)#3 | 3.9%(+28.0)#615 |
| 4. | Littleton Common | 28.4% | 4.6%(+23.8)#4 | 3.9%(+24.5)#745 |
| 5. | North Eastham | 26.2% | 4.6%(+21.6)#5 | 3.9%(+22.3)#816 |
| 6. | Dennis Port | 24.0% | 4.6%(+19.4)#6 | 3.9%(+20.1)#928 |
| 7. | Northfield | 21.8% | 4.6%(+17.2)#7 | 3.9%(+17.9)#1,050 |
| 8. | Fiskdale | 20.7% | 4.6%(+16.1)#8 | 3.9%(+16.8)#1,112 |
| 9. | Boxford | 19.0% | 4.6%(+14.4)#9 | 3.9%(+15.1)#1,233 |
| 10. | Granby | 18.9% | 4.6%(+14.3)#10 | 3.9%(+15.0)#1,245 |
| 11. | Harwich Port | 18.5% | 4.6%(+13.9)#11 | 3.9%(+14.6)#1,283 |
| 12. | Provincetown | 17.7% | 4.6%(+13.1)#12 | 3.9%(+13.8)#1,364 |
| 13. | Maynard | 17.0% | 4.6%(+12.4)#13 | 3.9%(+13.1)#1,425 |
| 14. | Northborough | 15.8% | 4.6%(+11.2)#14 | 3.9%(+11.9)#1,587 |
| 15. | Greenfield | 15.0% | 4.6%(+10.4)#15 | 3.9%(+11.1)#1,672 |
| 16. | South Dennis | 15.0% | 4.6%(+10.4)#16 | 3.9%(+11.1)#1,677 |
| 17. | Monson Center | 14.4% | 4.6%(+9.80)#17 | 3.9%(+10.5)#1,732 |
| 18. | Wareham Center | 14.3% | 4.6%(+9.70)#18 | 3.9%(+10.4)#1,741 |
| 19. | Clinton | 14.0% | 4.6%(+9.40)#19 | 3.9%(+10.1)#1,804 |
| 20. | West Falmouth | 13.7% | 4.6%(+9.10)#20 | 3.9%(+9.80)#1,839 |
| 21. | North Plymouth | 13.4% | 4.6%(+8.80)#21 | 3.9%(+9.50)#1,881 |
| 22. | Webster | 13.1% | 4.6%(+8.50)#22 | 3.9%(+9.20)#1,923 |
| 23. | Milton | 13.0% | 4.6%(+8.40)#23 | 3.9%(+9.10)#1,936 |
| 24. | Malden | 12.7% | 4.6%(+8.10)#24 | 3.9%(+8.80)#1,977 |
| 25. | Raynham Center | 12.5% | 4.6%(+7.90)#25 | 3.9%(+8.60)#2,003 |
| 26. | Burlington | 12.4% | 4.6%(+7.80)#26 | 3.9%(+8.50)#2,032 |
| 27. | Orange | 12.1% | 4.6%(+7.50)#27 | 3.9%(+8.20)#2,100 |
| 28. | Everett | 11.9% | 4.6%(+7.30)#28 | 3.9%(+8.00)#2,125 |
| 29. | Plymouth | 11.8% | 4.6%(+7.20)#29 | 3.9%(+7.90)#2,142 |
| 30. | Essex | 11.2% | 4.6%(+6.60)#30 | 3.9%(+7.30)#2,258 |
| 31. | Monument Beach | 11.0% | 4.6%(+6.40)#31 | 3.9%(+7.10)#2,320 |
| 32. | Andover | 10.5% | 4.6%(+5.90)#32 | 3.9%(+6.60)#2,408 |
| 33. | Northwest Harwich | 10.3% | 4.6%(+5.70)#33 | 3.9%(+6.40)#2,466 |
| 34. | Revere | 9.7% | 4.6%(+5.10)#34 | 3.9%(+5.80)#2,625 |
| 35. | Hanson | 9.7% | 4.6%(+5.10)#35 | 3.9%(+5.80)#2,638 |
| 36. | West Chatham | 9.7% | 4.6%(+5.10)#36 | 3.9%(+5.80)#2,641 |
| 37. | Palmer Town | 9.5% | 4.6%(+4.90)#37 | 3.9%(+5.60)#2,678 |
| 38. | Randolph Town | 9.4% | 4.6%(+4.80)#38 | 3.9%(+5.50)#2,712 |
| 39. | Wellesley | 9.3% | 4.6%(+4.70)#39 | 3.9%(+5.40)#2,740 |
| 40. | Chelsea | 9.2% | 4.6%(+4.60)#40 | 3.9%(+5.30)#2,774 |
| 41. | Easthampton Town | 9.2% | 4.6%(+4.60)#41 | 3.9%(+5.30)#2,778 |
| 42. | Ayer | 9.2% | 4.6%(+4.60)#42 | 3.9%(+5.30)#2,794 |
| 43. | Athol | 9.1% | 4.6%(+4.50)#43 | 3.9%(+5.20)#2,813 |
| 44. | Middleborough Center | 9.0% | 4.6%(+4.40)#44 | 3.9%(+5.10)#2,846 |
| 45. | Nahant | 9.0% | 4.6%(+4.40)#45 | 3.9%(+5.10)#2,852 |
| 46. | Peabody | 8.9% | 4.6%(+4.30)#46 | 3.9%(+5.00)#2,886 |
| 47. | Weymouth Town | 8.8% | 4.6%(+4.20)#47 | 3.9%(+4.90)#2,915 |
| 48. | West Concord | 8.6% | 4.6%(+4.00)#48 | 3.9%(+4.70)#2,977 |
| 49. | North Falmouth | 8.5% | 4.6%(+3.90)#49 | 3.9%(+4.60)#3,025 |
| 50. | Holbrook | 8.4% | 4.6%(+3.80)#50 | 3.9%(+4.50)#3,042 |
| 51. | Medfield | 8.1% | 4.6%(+3.50)#51 | 3.9%(+4.20)#3,160 |
| 52. | West Springfield Town | 7.8% | 4.6%(+3.20)#52 | 3.9%(+3.90)#3,258 |
| 53. | North Scituate | 7.7% | 4.6%(+3.10)#53 | 3.9%(+3.80)#3,316 |
| 54. | Reading | 7.6% | 4.6%(+3.00)#54 | 3.9%(+3.70)#3,327 |
| 55. | Amesbury Town | 7.5% | 4.6%(+2.90)#55 | 3.9%(+3.60)#3,377 |
| 56. | New Bedford | 7.4% | 4.6%(+2.80)#56 | 3.9%(+3.50)#3,401 |
| 57. | Boston | 7.2% | 4.6%(+2.60)#57 | 3.9%(+3.30)#3,476 |
| 58. | Westfield | 7.1% | 4.6%(+2.50)#58 | 3.9%(+3.20)#3,514 |
| 59. | Longmeadow | 7.1% | 4.6%(+2.50)#59 | 3.9%(+3.20)#3,526 |
| 60. | Hingham | 7.0% | 4.6%(+2.40)#60 | 3.9%(+3.10)#3,584 |
| 61. | North Pembroke | 7.0% | 4.6%(+2.40)#61 | 3.9%(+3.10)#3,586 |
| 62. | Mashpee Neck | 7.0% | 4.6%(+2.40)#62 | 3.9%(+3.10)#3,596 |
| 63. | South Duxbury | 6.8% | 4.6%(+2.20)#63 | 3.9%(+2.90)#3,671 |
| 64. | Acushnet Center | 6.8% | 4.6%(+2.20)#64 | 3.9%(+2.90)#3,673 |
| 65. | Woods Hole | 6.8% | 4.6%(+2.20)#65 | 3.9%(+2.90)#3,682 |
| 66. | Framingham | 6.7% | 4.6%(+2.10)#66 | 3.9%(+2.80)#3,689 |
| 67. | East Falmouth | 6.7% | 4.6%(+2.10)#67 | 3.9%(+2.80)#3,707 |
| 68. | Turners Falls | 6.7% | 4.6%(+2.10)#68 | 3.9%(+2.80)#3,712 |
| 69. | Lawrence | 6.6% | 4.6%(+2.00)#69 | 3.9%(+2.70)#3,721 |
| 70. | West Yarmouth | 6.6% | 4.6%(+2.00)#70 | 3.9%(+2.70)#3,752 |
| 71. | Needham | 6.1% | 4.6%(+1.50)#71 | 3.9%(+2.20)#4,022 |
| 72. | Harwich Center | 6.0% | 4.6%(+1.40)#72 | 3.9%(+2.10)#4,101 |
| 73. | Somerville | 5.9% | 4.6%(+1.30)#73 | 3.9%(+2.00)#4,124 |
| 74. | Southbridge Town | 5.9% | 4.6%(+1.30)#74 | 3.9%(+2.00)#4,133 |
| 75. | Salisbury | 5.7% | 4.6%(+1.10)#75 | 3.9%(+1.80)#4,249 |
| 76. | Barnstable Town | 5.5% | 4.6%(+0.900)#76 | 3.9%(+1.60)#4,323 |
| 77. | Worcester | 5.3% | 4.6%(+0.700)#77 | 3.9%(+1.40)#4,423 |
| 78. | Abington | 5.3% | 4.6%(+0.700)#78 | 3.9%(+1.40)#4,457 |
| 79. | Yarmouth Port | 5.3% | 4.6%(+0.700)#79 | 3.9%(+1.40)#4,474 |
| 80. | Methuen Town | 5.2% | 4.6%(+0.600)#80 | 3.9%(+1.30)#4,495 |
| 81. | Winthrop Town | 5.2% | 4.6%(+0.600)#81 | 3.9%(+1.30)#4,509 |
| 82. | Gardner | 5.0% | 4.6%(+0.400)#82 | 3.9%(+1.10)#4,647 |
| 83. | Amherst | 4.9% | 4.6%(+0.300)#83 | 3.9%(+1.00)#4,706 |
| 84. | Gloucester | 4.9% | 4.6%(+0.300)#84 | 3.9%(+1.00)#4,707 |
| 85. | Ocean Bluff Brant Rock | 4.8% | 4.6%(+0.200)#85 | 3.9%(+0.900)#4,779 |
| 86. | Swampscott | 4.7% | 4.6%(+0.100)#86 | 3.9%(+0.800)#4,834 |
| 87. | Fall River | 4.5% | 4.6%(-0.100)#87 | 3.9%(+0.600)#4,960 |
| 88. | Waltham | 4.5% | 4.6%(-0.100)#88 | 3.9%(+0.600)#4,966 |
| 89. | Leominster | 4.5% | 4.6%(-0.100)#89 | 3.9%(+0.600)#4,973 |
| 90. | Woburn | 4.5% | 4.6%(-0.100)#90 | 3.9%(+0.600)#4,975 |
| 91. | Melrose | 4.5% | 4.6%(-0.100)#91 | 3.9%(+0.600)#4,982 |
| 92. | North Adams | 4.5% | 4.6%(-0.100)#92 | 3.9%(+0.600)#5,000 |
| 93. | Millers Falls | 4.5% | 4.6%(-0.100)#93 | 3.9%(+0.600)#5,036 |
| 94. | Agawam Town | 4.4% | 4.6%(-0.200)#94 | 3.9%(+0.500)#5,056 |
| 95. | Ware | 4.4% | 4.6%(-0.200)#95 | 3.9%(+0.500)#5,088 |
| 96. | Salem | 4.3% | 4.6%(-0.300)#96 | 3.9%(+0.400)#5,121 |
| 97. | Braintree Town | 4.3% | 4.6%(-0.300)#97 | 3.9%(+0.400)#5,123 |
| 98. | Hudson | 4.2% | 4.6%(-0.400)#98 | 3.9%(+0.300)#5,202 |
| 99. | Chicopee | 4.1% | 4.6%(-0.500)#99 | 3.9%(+0.200)#5,271 |
| 100. | Danvers | 4.1% | 4.6%(-0.500)#100 | 3.9%(+0.200)#5,277 |
1
2Common Questions
What are the Top 10 Cities with the Highest Unemployment Rate Amomg Seniors Over the Age of 65 in Massachusetts?
Top 10 Cities with the Highest Unemployment Rate Amomg Seniors Over the Age of 65 in Massachusetts are:
#1
100.0%
#2
99.8%
#3
31.9%
#4
28.4%
#5
26.2%
#6
24.0%
#7
21.8%
#8
20.7%
#9
19.0%
#10
18.9%
What city has the Highest Unemployment Rate Amomg Seniors Over the Age of 65 in Massachusetts?
Baldwinville has the Highest Unemployment Rate Amomg Seniors Over the Age of 65 in Massachusetts with 100.0%.
What is the Unemployment Rate Amomg Seniors Over the Age of 65 in the State of Massachusetts?
Unemployment Rate Amomg Seniors Over the Age of 65 in Massachusetts is 4.6%.
What is the Unemployment Rate Amomg Seniors Over the Age of 65 in the United States?
Unemployment Rate Amomg Seniors Over the Age of 65 in the United States is 3.9%.