Cities with the Highest Unemployment Rate Amomg Seniors Over the Age of 65 in North Carolina
RELATED REPORTS & OPTIONS
Highest Unemployment | Senior > 65
North Carolina
Compare Cities
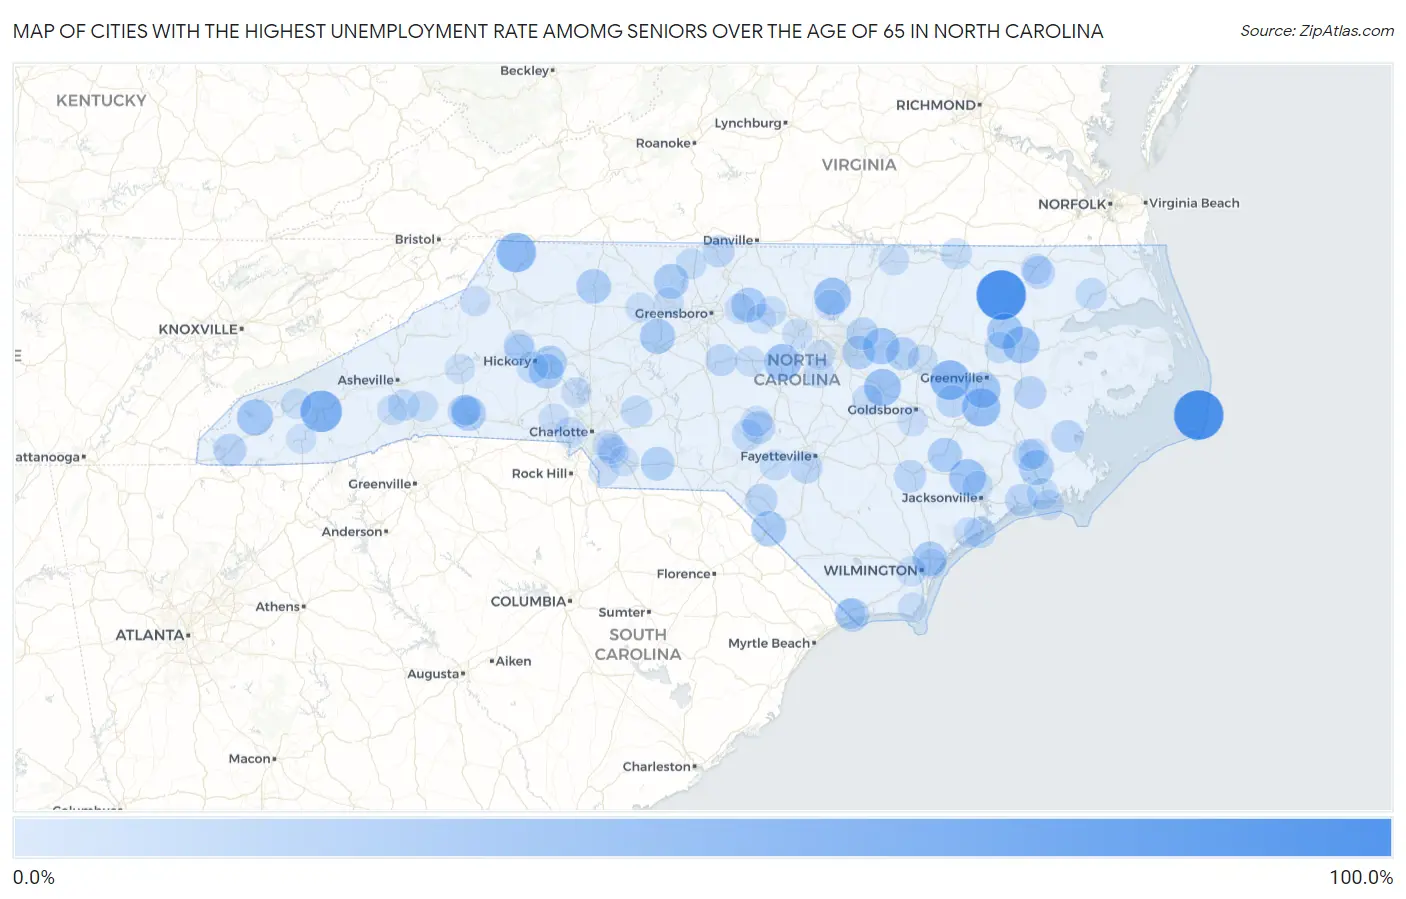
Map of Cities with the Highest Unemployment Rate Amomg Seniors Over the Age of 65 in North Carolina
0.0%
100.0%
Cities with the Highest Unemployment Rate Amomg Seniors Over the Age of 65 in North Carolina
| City | Senior Unemployment | vs State | vs National | |
| 1. | Roxobel | 99.8% | 3.1%(+96.7)#1 | 3.9%(+95.9)#105 |
| 2. | Avon | 99.7% | 3.1%(+96.6)#2 | 3.9%(+95.8)#110 |
| 3. | Sylva | 59.8% | 3.1%(+56.7)#3 | 3.9%(+55.9)#226 |
| 4. | Walstonburg | 50.0% | 3.1%(+46.9)#4 | 3.9%(+46.1)#278 |
| 5. | Lansing | 49.9% | 3.1%(+46.8)#5 | 3.9%(+46.0)#293 |
| 6. | Grifton | 42.8% | 3.1%(+39.7)#6 | 3.9%(+38.9)#371 |
| 7. | Stem | 38.0% | 3.1%(+34.9)#7 | 3.9%(+34.1)#458 |
| 8. | Selma | 37.7% | 3.1%(+34.6)#8 | 3.9%(+33.8)#461 |
| 9. | Pittsboro | 37.1% | 3.1%(+34.0)#9 | 3.9%(+33.2)#476 |
| 10. | Richlands | 36.4% | 3.1%(+33.3)#10 | 3.9%(+32.5)#486 |
| 11. | Williamston | 35.5% | 3.1%(+32.4)#11 | 3.9%(+31.6)#503 |
| 12. | Zebulon | 34.0% | 3.1%(+30.9)#12 | 3.9%(+30.1)#529 |
| 13. | Winterville | 33.5% | 3.1%(+30.4)#13 | 3.9%(+29.6)#542 |
| 14. | Robbinsville | 33.2% | 3.1%(+30.1)#14 | 3.9%(+29.3)#592 |
| 15. | Hamilton | 31.5% | 3.1%(+28.4)#15 | 3.9%(+27.6)#634 |
| 16. | Welcome | 29.2% | 3.1%(+26.1)#16 | 3.9%(+25.3)#701 |
| 17. | Rowland | 28.4% | 3.1%(+25.3)#17 | 3.9%(+24.5)#748 |
| 18. | Walnut Cove | 26.8% | 3.1%(+23.7)#18 | 3.9%(+22.9)#797 |
| 19. | Glen Raven | 26.6% | 3.1%(+23.5)#19 | 3.9%(+22.7)#806 |
| 20. | Neuse Forest | 26.6% | 3.1%(+23.5)#20 | 3.9%(+22.7)#807 |
| 21. | Newton | 26.5% | 3.1%(+23.4)#21 | 3.9%(+22.6)#808 |
| 22. | Elkin | 26.2% | 3.1%(+23.1)#22 | 3.9%(+22.3)#814 |
| 23. | Northchase | 25.8% | 3.1%(+22.7)#23 | 3.9%(+21.9)#830 |
| 24. | Spindale | 25.5% | 3.1%(+22.4)#24 | 3.9%(+21.6)#841 |
| 25. | Pink Hill | 24.9% | 3.1%(+21.8)#25 | 3.9%(+21.0)#889 |
| 26. | Conover | 22.3% | 3.1%(+19.2)#26 | 3.9%(+18.4)#1,001 |
| 27. | Peachland | 22.2% | 3.1%(+19.1)#27 | 3.9%(+18.3)#1,019 |
| 28. | Calabash | 21.4% | 3.1%(+18.3)#28 | 3.9%(+17.5)#1,065 |
| 29. | Knightdale | 20.6% | 3.1%(+17.5)#29 | 3.9%(+16.7)#1,113 |
| 30. | Bailey | 20.0% | 3.1%(+16.9)#30 | 3.9%(+16.1)#1,153 |
| 31. | Whispering Pines | 17.6% | 3.1%(+14.5)#31 | 3.9%(+13.7)#1,368 |
| 32. | Briar Chapel | 17.3% | 3.1%(+14.2)#32 | 3.9%(+13.4)#1,399 |
| 33. | Murphy | 17.0% | 3.1%(+13.9)#33 | 3.9%(+13.1)#1,432 |
| 34. | River Road | 16.9% | 3.1%(+13.8)#34 | 3.9%(+13.0)#1,443 |
| 35. | Maxton | 16.6% | 3.1%(+13.5)#35 | 3.9%(+12.7)#1,467 |
| 36. | Magnolia | 16.6% | 3.1%(+13.5)#36 | 3.9%(+12.7)#1,476 |
| 37. | Cofield | 16.6% | 3.1%(+13.5)#37 | 3.9%(+12.7)#1,494 |
| 38. | Vandemere | 16.6% | 3.1%(+13.5)#38 | 3.9%(+12.7)#1,502 |
| 39. | Rolesville | 16.4% | 3.1%(+13.3)#39 | 3.9%(+12.5)#1,520 |
| 40. | Snow Hill | 16.4% | 3.1%(+13.3)#40 | 3.9%(+12.5)#1,528 |
| 41. | Peletier | 16.2% | 3.1%(+13.1)#41 | 3.9%(+12.3)#1,549 |
| 42. | Rutherfordton | 15.3% | 3.1%(+12.2)#42 | 3.9%(+11.4)#1,637 |
| 43. | Hope Mills | 14.9% | 3.1%(+11.8)#43 | 3.9%(+11.0)#1,685 |
| 44. | Eden | 13.9% | 3.1%(+10.8)#44 | 3.9%(+10.00)#1,812 |
| 45. | Franklinville | 13.6% | 3.1%(+10.5)#45 | 3.9%(+9.70)#1,856 |
| 46. | James City | 13.5% | 3.1%(+10.4)#46 | 3.9%(+9.60)#1,867 |
| 47. | Mountain View | 12.0% | 3.1%(+8.90)#47 | 3.9%(+8.10)#2,113 |
| 48. | Mount Pleasant | 12.0% | 3.1%(+8.90)#48 | 3.9%(+8.10)#2,118 |
| 49. | Winfall | 11.9% | 3.1%(+8.80)#49 | 3.9%(+8.00)#2,137 |
| 50. | Pinehurst | 11.8% | 3.1%(+8.70)#50 | 3.9%(+7.90)#2,141 |
| 51. | Fletcher | 11.4% | 3.1%(+8.30)#51 | 3.9%(+7.50)#2,211 |
| 52. | Robersonville | 10.9% | 3.1%(+7.80)#52 | 3.9%(+7.00)#2,340 |
| 53. | North Topsail Beach | 10.9% | 3.1%(+7.80)#53 | 3.9%(+7.00)#2,342 |
| 54. | Newport | 10.7% | 3.1%(+7.60)#54 | 3.9%(+6.80)#2,369 |
| 55. | Sawmills | 10.2% | 3.1%(+7.10)#55 | 3.9%(+6.30)#2,489 |
| 56. | Governors Club | 9.5% | 3.1%(+6.40)#56 | 3.9%(+5.60)#2,688 |
| 57. | Gaston | 9.4% | 3.1%(+6.30)#57 | 3.9%(+5.50)#2,734 |
| 58. | Raeford | 9.2% | 3.1%(+6.10)#58 | 3.9%(+5.30)#2,785 |
| 59. | Mayodan | 9.1% | 3.1%(+6.00)#59 | 3.9%(+5.20)#2,825 |
| 60. | Gibsonville | 8.7% | 3.1%(+5.60)#60 | 3.9%(+4.80)#2,951 |
| 61. | Ruth | 8.5% | 3.1%(+5.40)#61 | 3.9%(+4.60)#3,031 |
| 62. | Holly Springs | 8.3% | 3.1%(+5.20)#62 | 3.9%(+4.40)#3,065 |
| 63. | Belmont | 8.3% | 3.1%(+5.20)#63 | 3.9%(+4.40)#3,075 |
| 64. | Carolina Shores | 7.9% | 3.1%(+4.80)#64 | 3.9%(+4.00)#3,232 |
| 65. | Four Oaks | 7.9% | 3.1%(+4.80)#65 | 3.9%(+4.00)#3,239 |
| 66. | Half Moon | 7.7% | 3.1%(+4.60)#66 | 3.9%(+3.80)#3,311 |
| 67. | Mills River | 7.7% | 3.1%(+4.60)#67 | 3.9%(+3.80)#3,314 |
| 68. | Edneyville | 7.7% | 3.1%(+4.60)#68 | 3.9%(+3.80)#3,319 |
| 69. | Siler City | 7.5% | 3.1%(+4.40)#69 | 3.9%(+3.60)#3,384 |
| 70. | Carthage | 7.5% | 3.1%(+4.40)#70 | 3.9%(+3.60)#3,393 |
| 71. | Anderson Creek | 7.4% | 3.1%(+4.30)#71 | 3.9%(+3.50)#3,413 |
| 72. | Fairfield Harbour | 7.4% | 3.1%(+4.30)#72 | 3.9%(+3.50)#3,427 |
| 73. | Norlina | 7.4% | 3.1%(+4.30)#73 | 3.9%(+3.50)#3,432 |
| 74. | Winton | 7.4% | 3.1%(+4.30)#74 | 3.9%(+3.50)#3,438 |
| 75. | Westport | 7.2% | 3.1%(+4.10)#75 | 3.9%(+3.30)#3,498 |
| 76. | Pine Knoll Shores | 7.2% | 3.1%(+4.10)#76 | 3.9%(+3.30)#3,511 |
| 77. | Indian Trail | 7.1% | 3.1%(+4.00)#77 | 3.9%(+3.20)#3,515 |
| 78. | Matthews | 6.8% | 3.1%(+3.70)#78 | 3.9%(+2.90)#3,652 |
| 79. | Dallas | 6.8% | 3.1%(+3.70)#79 | 3.9%(+2.90)#3,668 |
| 80. | Brogden | 6.8% | 3.1%(+3.70)#80 | 3.9%(+2.90)#3,675 |
| 81. | Wilson | 6.6% | 3.1%(+3.50)#81 | 3.9%(+2.70)#3,727 |
| 82. | Butner | 6.4% | 3.1%(+3.30)#82 | 3.9%(+2.50)#3,874 |
| 83. | Walkertown | 6.4% | 3.1%(+3.30)#83 | 3.9%(+2.50)#3,879 |
| 84. | Banner Elk | 6.4% | 3.1%(+3.30)#84 | 3.9%(+2.50)#3,895 |
| 85. | Waxhaw | 6.3% | 3.1%(+3.20)#85 | 3.9%(+2.40)#3,917 |
| 86. | Kings Grant | 6.3% | 3.1%(+3.20)#86 | 3.9%(+2.40)#3,926 |
| 87. | Holly Ridge | 6.2% | 3.1%(+3.10)#87 | 3.9%(+2.30)#3,980 |
| 88. | Chapel Hill | 6.1% | 3.1%(+3.00)#88 | 3.9%(+2.20)#4,015 |
| 89. | Leland | 6.1% | 3.1%(+3.00)#89 | 3.9%(+2.20)#4,025 |
| 90. | Bryson City | 6.1% | 3.1%(+3.00)#90 | 3.9%(+2.20)#4,052 |
| 91. | Mebane | 6.0% | 3.1%(+2.90)#91 | 3.9%(+2.10)#4,078 |
| 92. | Cary | 5.8% | 3.1%(+2.70)#92 | 3.9%(+1.90)#4,164 |
| 93. | Hudson | 5.8% | 3.1%(+2.70)#93 | 3.9%(+1.90)#4,189 |
| 94. | Swepsonville | 5.6% | 3.1%(+2.50)#94 | 3.9%(+1.70)#4,307 |
| 95. | Marion | 5.2% | 3.1%(+2.10)#95 | 3.9%(+1.30)#4,522 |
| 96. | Franklin | 5.2% | 3.1%(+2.10)#96 | 3.9%(+1.30)#4,532 |
| 97. | Monroe | 5.0% | 3.1%(+1.90)#97 | 3.9%(+1.10)#4,642 |
| 98. | Stallings | 5.0% | 3.1%(+1.90)#98 | 3.9%(+1.10)#4,653 |
| 99. | Lewisville | 5.0% | 3.1%(+1.90)#99 | 3.9%(+1.10)#4,656 |
| 100. | Southport | 4.9% | 3.1%(+1.80)#100 | 3.9%(+1.00)#4,732 |
Common Questions
What are the Top 10 Cities with the Highest Unemployment Rate Amomg Seniors Over the Age of 65 in North Carolina?
Top 10 Cities with the Highest Unemployment Rate Amomg Seniors Over the Age of 65 in North Carolina are:
What city has the Highest Unemployment Rate Amomg Seniors Over the Age of 65 in North Carolina?
Roxobel has the Highest Unemployment Rate Amomg Seniors Over the Age of 65 in North Carolina with 99.8%.
What is the Unemployment Rate Amomg Seniors Over the Age of 65 in the State of North Carolina?
Unemployment Rate Amomg Seniors Over the Age of 65 in North Carolina is 3.1%.
What is the Unemployment Rate Amomg Seniors Over the Age of 65 in the United States?
Unemployment Rate Amomg Seniors Over the Age of 65 in the United States is 3.9%.