Cities with the Highest Unemployment Rate Amomg Seniors Over the Age of 65 in New York
RELATED REPORTS & OPTIONS
Highest Unemployment | Senior > 65
New York
Compare Cities
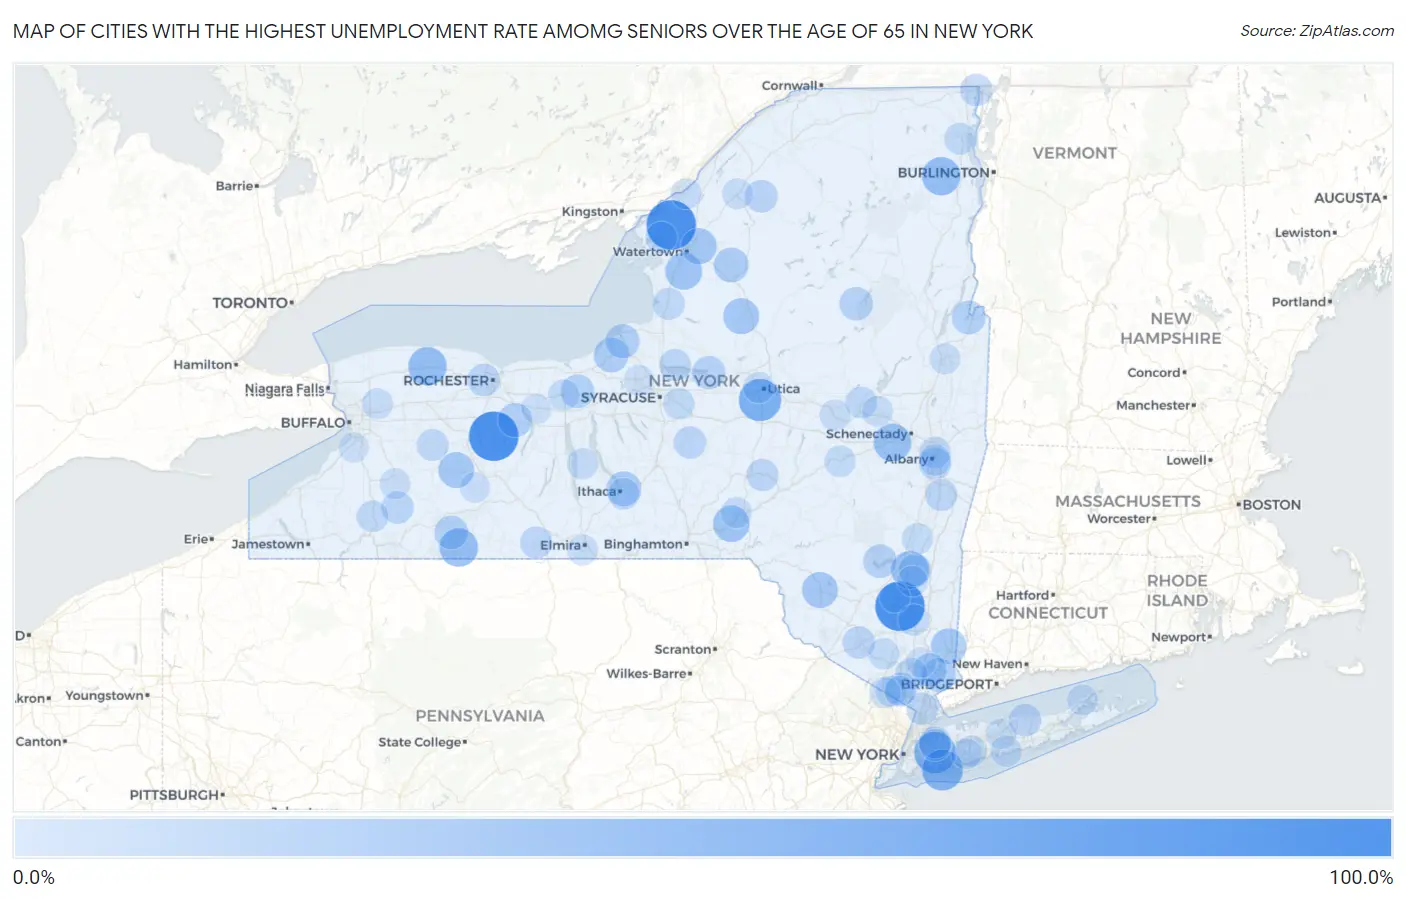
Map of Cities with the Highest Unemployment Rate Amomg Seniors Over the Age of 65 in New York
0.0%
100.0%
Cities with the Highest Unemployment Rate Amomg Seniors Over the Age of 65 in New York
| City | Senior Unemployment | vs State | vs National | |
| 1. | Sleepy Hollow Lake | 100.0% | 4.6%(+95.4)#1 | 3.9%(+96.1)#2 |
| 2. | Clintondale | 100.0% | 4.6%(+95.4)#2 | 3.9%(+96.1)#27 |
| 3. | Depauville | 100.0% | 4.6%(+95.4)#3 | 3.9%(+96.1)#40 |
| 4. | Cementon | 100.0% | 4.6%(+95.4)#4 | 3.9%(+96.1)#53 |
| 5. | Hemlock | 99.9% | 4.6%(+95.3)#5 | 3.9%(+96.0)#83 |
| 6. | Lake Huntington | 99.9% | 4.6%(+95.3)#6 | 3.9%(+96.0)#91 |
| 7. | Chadwicks | 66.6% | 4.6%(+62.0)#7 | 3.9%(+62.7)#187 |
| 8. | Bellerose Terrace | 64.0% | 4.6%(+59.4)#8 | 3.9%(+60.1)#202 |
| 9. | Harbor Isle | 61.0% | 4.6%(+56.4)#9 | 3.9%(+57.1)#219 |
| 10. | Au Sable Forks | 50.0% | 4.6%(+45.4)#10 | 3.9%(+46.1)#273 |
| 11. | Stannards | 49.9% | 4.6%(+45.3)#11 | 3.9%(+46.0)#287 |
| 12. | Albion | 49.6% | 4.6%(+45.0)#12 | 3.9%(+45.7)#301 |
| 13. | Rhinecliff | 47.1% | 4.6%(+42.5)#13 | 3.9%(+43.2)#323 |
| 14. | Duane Lake | 46.1% | 4.6%(+41.5)#14 | 3.9%(+42.2)#334 |
| 15. | Rodman | 42.8% | 4.6%(+38.2)#15 | 3.9%(+38.9)#374 |
| 16. | Afton | 41.0% | 4.6%(+36.4)#16 | 3.9%(+37.1)#398 |
| 17. | Wurtsboro Hills | 39.9% | 4.6%(+35.3)#17 | 3.9%(+36.0)#426 |
| 18. | Black River | 38.5% | 4.6%(+33.9)#18 | 3.9%(+34.6)#447 |
| 19. | Liberty | 38.4% | 4.6%(+33.8)#19 | 3.9%(+34.5)#450 |
| 20. | Constableville | 38.4% | 4.6%(+33.8)#20 | 3.9%(+34.5)#455 |
| 21. | Barrytown | 38.0% | 4.6%(+33.4)#21 | 3.9%(+34.1)#459 |
| 22. | Nunda | 37.5% | 4.6%(+32.9)#22 | 3.9%(+33.6)#465 |
| 23. | Brewster Hill | 37.2% | 4.6%(+32.6)#23 | 3.9%(+33.3)#473 |
| 24. | Forest Home | 33.3% | 4.6%(+28.7)#24 | 3.9%(+29.4)#555 |
| 25. | Hannibal | 33.3% | 4.6%(+28.7)#25 | 3.9%(+29.4)#557 |
| 26. | Castorland | 33.2% | 4.6%(+28.6)#26 | 3.9%(+29.3)#596 |
| 27. | Bloomfield | 31.0% | 4.6%(+26.4)#27 | 3.9%(+27.1)#650 |
| 28. | Minetto | 30.6% | 4.6%(+26.0)#28 | 3.9%(+26.7)#661 |
| 29. | Bedford Hills | 30.0% | 4.6%(+25.4)#29 | 3.9%(+26.1)#673 |
| 30. | Clyde | 28.6% | 4.6%(+24.0)#30 | 3.9%(+24.7)#723 |
| 31. | Whitehall | 28.5% | 4.6%(+23.9)#31 | 3.9%(+24.6)#726 |
| 32. | Scio | 28.5% | 4.6%(+23.9)#32 | 3.9%(+24.6)#730 |
| 33. | Speculator | 27.9% | 4.6%(+23.3)#33 | 3.9%(+24.0)#764 |
| 34. | Yorktown Heights | 27.6% | 4.6%(+23.0)#34 | 3.9%(+23.7)#773 |
| 35. | Shokan | 27.6% | 4.6%(+23.0)#35 | 3.9%(+23.7)#775 |
| 36. | Sylvan Beach | 26.7% | 4.6%(+22.1)#36 | 3.9%(+22.8)#802 |
| 37. | Eldred | 25.0% | 4.6%(+20.4)#37 | 3.9%(+21.1)#878 |
| 38. | Edwards | 24.9% | 4.6%(+20.3)#38 | 3.9%(+21.0)#888 |
| 39. | Gates | 24.0% | 4.6%(+19.4)#39 | 3.9%(+20.1)#927 |
| 40. | Rhinebeck | 24.0% | 4.6%(+19.4)#40 | 3.9%(+20.1)#929 |
| 41. | New Square | 23.9% | 4.6%(+19.3)#41 | 3.9%(+20.0)#932 |
| 42. | Deruyter | 23.5% | 4.6%(+18.9)#42 | 3.9%(+19.6)#953 |
| 43. | Mechanicstown | 23.2% | 4.6%(+18.6)#43 | 3.9%(+19.3)#960 |
| 44. | Rocky Point | 23.1% | 4.6%(+18.5)#44 | 3.9%(+19.2)#964 |
| 45. | Hampton Manor | 23.0% | 4.6%(+18.4)#45 | 3.9%(+19.1)#973 |
| 46. | Franklinville | 23.0% | 4.6%(+18.4)#46 | 3.9%(+19.1)#974 |
| 47. | Rouses Point | 22.8% | 4.6%(+18.2)#47 | 3.9%(+18.9)#989 |
| 48. | Ardsley | 22.4% | 4.6%(+17.8)#48 | 3.9%(+18.5)#999 |
| 49. | Rosendale | 22.2% | 4.6%(+17.6)#49 | 3.9%(+18.3)#1,013 |
| 50. | Morris | 22.2% | 4.6%(+17.6)#50 | 3.9%(+18.3)#1,018 |
| 51. | Valatie | 21.8% | 4.6%(+17.2)#51 | 3.9%(+17.9)#1,047 |
| 52. | Constantia | 21.8% | 4.6%(+17.2)#52 | 3.9%(+17.9)#1,048 |
| 53. | Great Neck Plaza | 21.3% | 4.6%(+16.7)#53 | 3.9%(+17.4)#1,073 |
| 54. | Addison | 21.3% | 4.6%(+16.7)#54 | 3.9%(+17.4)#1,076 |
| 55. | University Gardens | 21.0% | 4.6%(+16.4)#55 | 3.9%(+17.1)#1,090 |
| 56. | Lacona | 21.0% | 4.6%(+16.4)#56 | 3.9%(+17.1)#1,096 |
| 57. | Montrose | 20.9% | 4.6%(+16.3)#57 | 3.9%(+17.0)#1,100 |
| 58. | Plattsburgh West | 20.5% | 4.6%(+15.9)#58 | 3.9%(+16.6)#1,118 |
| 59. | Johnstown | 20.4% | 4.6%(+15.8)#59 | 3.9%(+16.5)#1,121 |
| 60. | Warsaw | 20.4% | 4.6%(+15.8)#60 | 3.9%(+16.5)#1,123 |
| 61. | Menands | 20.0% | 4.6%(+15.4)#61 | 3.9%(+16.1)#1,137 |
| 62. | East Ithaca | 20.0% | 4.6%(+15.4)#62 | 3.9%(+16.1)#1,140 |
| 63. | Ellicottville | 20.0% | 4.6%(+15.4)#63 | 3.9%(+16.1)#1,155 |
| 64. | Chaumont | 19.9% | 4.6%(+15.3)#64 | 3.9%(+16.0)#1,177 |
| 65. | Richmondville | 19.0% | 4.6%(+14.4)#65 | 3.9%(+15.1)#1,238 |
| 66. | Rensselaer | 18.9% | 4.6%(+14.3)#66 | 3.9%(+15.0)#1,242 |
| 67. | East Farmingdale | 18.7% | 4.6%(+14.1)#67 | 3.9%(+14.8)#1,254 |
| 68. | Wappingers Falls | 18.7% | 4.6%(+14.1)#68 | 3.9%(+14.8)#1,257 |
| 69. | Ruby | 18.5% | 4.6%(+13.9)#69 | 3.9%(+14.6)#1,284 |
| 70. | Manlius | 18.4% | 4.6%(+13.8)#70 | 3.9%(+14.5)#1,293 |
| 71. | Montebello | 18.1% | 4.6%(+13.5)#71 | 3.9%(+14.2)#1,315 |
| 72. | South Blooming Grove | 18.1% | 4.6%(+13.5)#72 | 3.9%(+14.2)#1,317 |
| 73. | Yorkville | 18.1% | 4.6%(+13.5)#73 | 3.9%(+14.2)#1,318 |
| 74. | Lodi | 18.1% | 4.6%(+13.5)#74 | 3.9%(+14.2)#1,330 |
| 75. | Hillburn | 17.9% | 4.6%(+13.3)#75 | 3.9%(+14.0)#1,348 |
| 76. | Lyons | 17.8% | 4.6%(+13.2)#76 | 3.9%(+13.9)#1,355 |
| 77. | Bainbridge | 17.4% | 4.6%(+12.8)#77 | 3.9%(+13.5)#1,394 |
| 78. | West Sayville | 17.2% | 4.6%(+12.6)#78 | 3.9%(+13.3)#1,411 |
| 79. | Germantown | 17.2% | 4.6%(+12.6)#79 | 3.9%(+13.3)#1,412 |
| 80. | Nelliston | 16.9% | 4.6%(+12.3)#80 | 3.9%(+13.0)#1,448 |
| 81. | Milton Cdp Saratoga County | 16.8% | 4.6%(+12.2)#81 | 3.9%(+12.9)#1,452 |
| 82. | South Glens Falls | 16.8% | 4.6%(+12.2)#82 | 3.9%(+12.9)#1,454 |
| 83. | Clarence Center | 16.8% | 4.6%(+12.2)#83 | 3.9%(+12.9)#1,455 |
| 84. | Alexandria Bay | 16.6% | 4.6%(+12.0)#84 | 3.9%(+12.7)#1,474 |
| 85. | Fort Johnson | 16.6% | 4.6%(+12.0)#85 | 3.9%(+12.7)#1,490 |
| 86. | Hillcrest | 16.4% | 4.6%(+11.8)#86 | 3.9%(+12.5)#1,522 |
| 87. | Southold | 16.4% | 4.6%(+11.8)#87 | 3.9%(+12.5)#1,523 |
| 88. | Southport | 16.3% | 4.6%(+11.7)#88 | 3.9%(+12.4)#1,534 |
| 89. | Staatsburg | 16.0% | 4.6%(+11.4)#89 | 3.9%(+12.1)#1,571 |
| 90. | Gouverneur | 15.9% | 4.6%(+11.3)#90 | 3.9%(+12.0)#1,577 |
| 91. | Delevan | 15.9% | 4.6%(+11.3)#91 | 3.9%(+12.0)#1,582 |
| 92. | South Farmingdale | 14.6% | 4.6%(+10.00)#92 | 3.9%(+10.7)#1,713 |
| 93. | Canaseraga | 14.3% | 4.6%(+9.70)#93 | 3.9%(+10.4)#1,746 |
| 94. | Nesconset | 14.1% | 4.6%(+9.50)#94 | 3.9%(+10.2)#1,795 |
| 95. | Baldwinsville | 13.8% | 4.6%(+9.20)#95 | 3.9%(+9.90)#1,824 |
| 96. | New Paltz | 13.8% | 4.6%(+9.20)#96 | 3.9%(+9.90)#1,825 |
| 97. | Lake Mohegan | 13.7% | 4.6%(+9.10)#97 | 3.9%(+9.80)#1,836 |
| 98. | Manchester | 13.7% | 4.6%(+9.10)#98 | 3.9%(+9.80)#1,841 |
| 99. | Hamburg | 13.5% | 4.6%(+8.90)#99 | 3.9%(+9.60)#1,865 |
| 100. | Springfield Center | 13.3% | 4.6%(+8.70)#100 | 3.9%(+9.40)#1,907 |
Common Questions
What are the Top 10 Cities with the Highest Unemployment Rate Amomg Seniors Over the Age of 65 in New York?
Top 10 Cities with the Highest Unemployment Rate Amomg Seniors Over the Age of 65 in New York are:
#1
100.0%
#2
100.0%
#3
99.9%
#4
66.6%
#5
64.0%
#6
61.0%
#7
50.0%
#8
49.9%
#9
49.6%
#10
47.1%
What city has the Highest Unemployment Rate Amomg Seniors Over the Age of 65 in New York?
Clintondale has the Highest Unemployment Rate Amomg Seniors Over the Age of 65 in New York with 100.0%.
What is the Unemployment Rate Amomg Seniors Over the Age of 65 in the State of New York?
Unemployment Rate Amomg Seniors Over the Age of 65 in New York is 4.6%.
What is the Unemployment Rate Amomg Seniors Over the Age of 65 in the United States?
Unemployment Rate Amomg Seniors Over the Age of 65 in the United States is 3.9%.