Cities with the Highest Unemployment Rate Amomg Seniors Over the Age of 65 in Minnesota
RELATED REPORTS & OPTIONS
Highest Unemployment | Senior > 65
Minnesota
Compare Cities
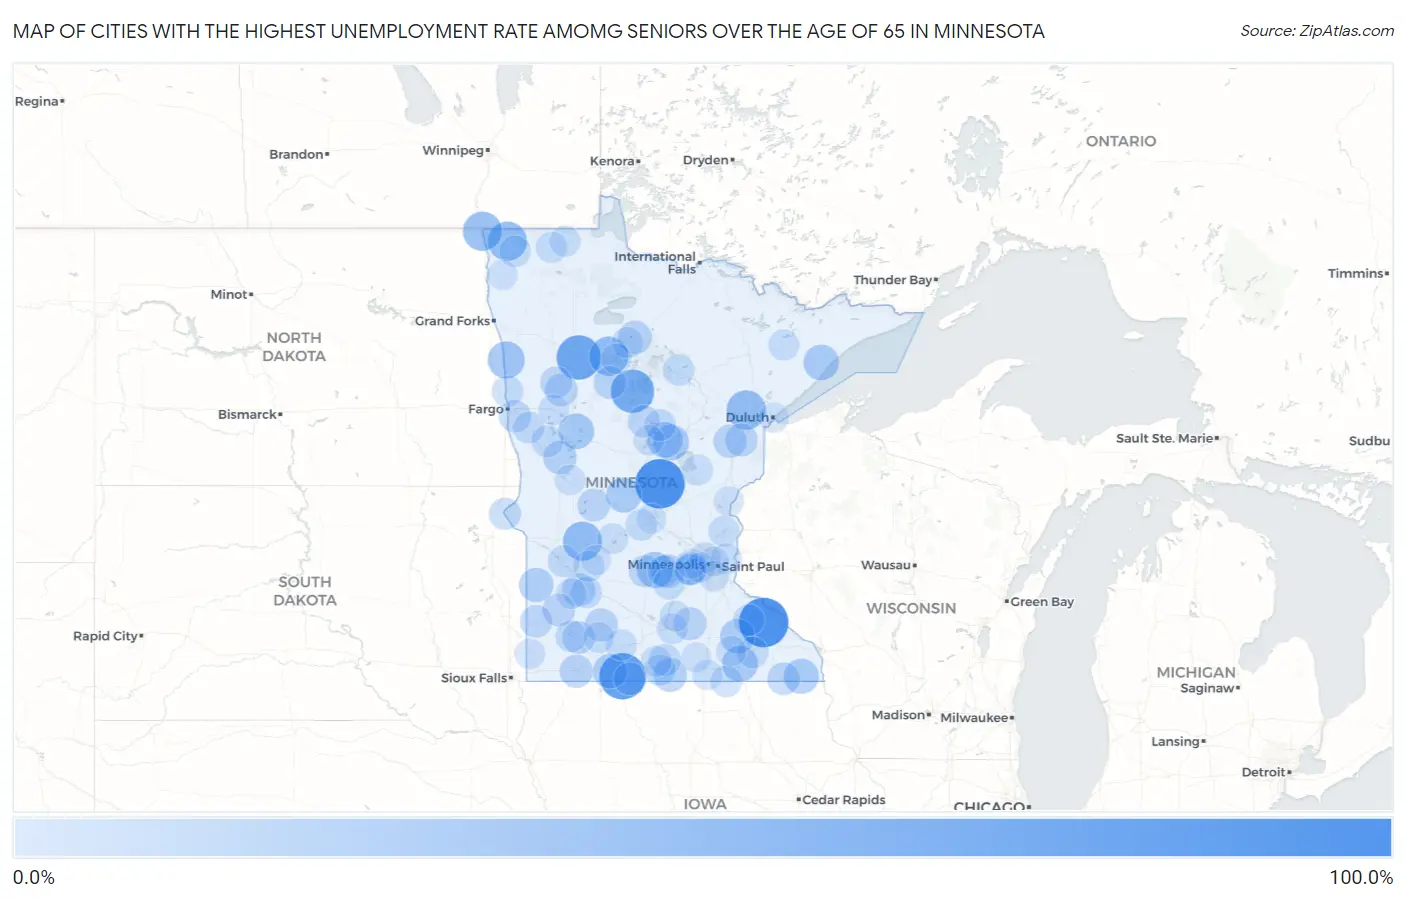
Map of Cities with the Highest Unemployment Rate Amomg Seniors Over the Age of 65 in Minnesota
0.0%
100.0%
Cities with the Highest Unemployment Rate Amomg Seniors Over the Age of 65 in Minnesota
| City | Senior Unemployment | vs State | vs National | |
| 1. | Genola | 100.0% | 3.2%(+96.8)#1 | 3.9%(+96.1)#67 |
| 2. | Millville | 99.7% | 3.2%(+96.5)#2 | 3.9%(+95.8)#111 |
| 3. | Dunnell | 84.4% | 3.2%(+81.2)#3 | 3.9%(+80.5)#134 |
| 4. | Ebro | 75.0% | 3.2%(+71.8)#4 | 3.9%(+71.1)#158 |
| 5. | Pickwick | 74.9% | 3.2%(+71.7)#5 | 3.9%(+71.0)#160 |
| 6. | Walker | 69.9% | 3.2%(+66.7)#6 | 3.9%(+66.0)#173 |
| 7. | Brookston | 50.3% | 3.2%(+47.1)#7 | 3.9%(+46.4)#265 |
| 8. | Wilton | 50.0% | 3.2%(+46.8)#8 | 3.9%(+46.1)#279 |
| 9. | De Graff | 50.0% | 3.2%(+46.8)#9 | 3.9%(+46.1)#283 |
| 10. | Lancaster | 49.9% | 3.2%(+46.7)#10 | 3.9%(+46.0)#291 |
| 11. | St Vincent | 49.9% | 3.2%(+46.7)#11 | 3.9%(+46.0)#298 |
| 12. | Shelly | 39.9% | 3.2%(+36.7)#12 | 3.9%(+36.0)#429 |
| 13. | Silver Lake | 35.5% | 3.2%(+32.3)#13 | 3.9%(+31.6)#506 |
| 14. | Perham | 33.7% | 3.2%(+30.5)#14 | 3.9%(+29.8)#538 |
| 15. | Dexter | 33.4% | 3.2%(+30.2)#15 | 3.9%(+29.5)#547 |
| 16. | Deerwood | 33.3% | 3.2%(+30.1)#16 | 3.9%(+29.4)#558 |
| 17. | Finland | 33.3% | 3.2%(+30.1)#17 | 3.9%(+29.4)#576 |
| 18. | Trommald | 33.3% | 3.2%(+30.1)#18 | 3.9%(+29.4)#586 |
| 19. | Grey Eagle | 31.2% | 3.2%(+28.0)#19 | 3.9%(+27.3)#643 |
| 20. | Spring Grove | 31.1% | 3.2%(+27.9)#20 | 3.9%(+27.2)#647 |
| 21. | Mantorville | 29.7% | 3.2%(+26.5)#21 | 3.9%(+25.8)#680 |
| 22. | Jackson | 28.8% | 3.2%(+25.6)#22 | 3.9%(+24.9)#714 |
| 23. | Canby | 27.6% | 3.2%(+24.4)#23 | 3.9%(+23.7)#774 |
| 24. | New Germany | 25.0% | 3.2%(+21.8)#24 | 3.9%(+21.1)#868 |
| 25. | Frost | 25.0% | 3.2%(+21.8)#25 | 3.9%(+21.1)#875 |
| 26. | Blackduck | 23.9% | 3.2%(+20.7)#26 | 3.9%(+20.0)#937 |
| 27. | Underwood | 23.0% | 3.2%(+19.8)#27 | 3.9%(+19.1)#983 |
| 28. | Wood Lake | 22.2% | 3.2%(+19.0)#28 | 3.9%(+18.3)#1,021 |
| 29. | Kettle River | 22.2% | 3.2%(+19.0)#29 | 3.9%(+18.3)#1,025 |
| 30. | Sanborn | 22.1% | 3.2%(+18.9)#30 | 3.9%(+18.2)#1,036 |
| 31. | Worthington | 21.6% | 3.2%(+18.4)#31 | 3.9%(+17.7)#1,058 |
| 32. | Dresbach | 21.4% | 3.2%(+18.2)#32 | 3.9%(+17.5)#1,072 |
| 33. | Waterville | 21.2% | 3.2%(+18.0)#33 | 3.9%(+17.3)#1,082 |
| 34. | Barnum | 21.0% | 3.2%(+17.8)#34 | 3.9%(+17.1)#1,098 |
| 35. | Tonka Bay | 20.1% | 3.2%(+16.9)#35 | 3.9%(+16.2)#1,134 |
| 36. | Lynd | 20.0% | 3.2%(+16.8)#36 | 3.9%(+16.1)#1,150 |
| 37. | Ceylon | 20.0% | 3.2%(+16.8)#37 | 3.9%(+16.1)#1,156 |
| 38. | Lake George | 20.0% | 3.2%(+16.8)#38 | 3.9%(+16.1)#1,157 |
| 39. | White Earth | 19.9% | 3.2%(+16.7)#39 | 3.9%(+16.0)#1,176 |
| 40. | Canton | 19.9% | 3.2%(+16.7)#40 | 3.9%(+16.0)#1,183 |
| 41. | Villard | 19.9% | 3.2%(+16.7)#41 | 3.9%(+16.0)#1,187 |
| 42. | Dovray | 19.9% | 3.2%(+16.7)#42 | 3.9%(+16.0)#1,191 |
| 43. | Lake Benton | 18.7% | 3.2%(+15.5)#43 | 3.9%(+14.8)#1,262 |
| 44. | Sabin | 18.2% | 3.2%(+15.0)#44 | 3.9%(+14.3)#1,310 |
| 45. | Pine River | 17.6% | 3.2%(+14.4)#45 | 3.9%(+13.7)#1,378 |
| 46. | Waubun | 17.3% | 3.2%(+14.1)#46 | 3.9%(+13.4)#1,404 |
| 47. | Browns Valley | 17.2% | 3.2%(+14.0)#47 | 3.9%(+13.3)#1,414 |
| 48. | Hutchinson | 17.1% | 3.2%(+13.9)#48 | 3.9%(+13.2)#1,415 |
| 49. | Lester Prairie | 16.6% | 3.2%(+13.4)#49 | 3.9%(+12.7)#1,468 |
| 50. | Delavan | 16.6% | 3.2%(+13.4)#50 | 3.9%(+12.7)#1,503 |
| 51. | Watson | 16.6% | 3.2%(+13.4)#51 | 3.9%(+12.7)#1,505 |
| 52. | Erhard | 16.6% | 3.2%(+13.4)#52 | 3.9%(+12.7)#1,508 |
| 53. | Barnesville | 15.7% | 3.2%(+12.5)#53 | 3.9%(+11.8)#1,600 |
| 54. | Crosslake | 15.3% | 3.2%(+12.1)#54 | 3.9%(+11.4)#1,638 |
| 55. | Currie | 15.3% | 3.2%(+12.1)#55 | 3.9%(+11.4)#1,654 |
| 56. | Stewartville | 14.9% | 3.2%(+11.7)#56 | 3.9%(+11.0)#1,689 |
| 57. | Cold Spring | 14.7% | 3.2%(+11.5)#57 | 3.9%(+10.8)#1,707 |
| 58. | Blue Earth | 14.5% | 3.2%(+11.3)#58 | 3.9%(+10.6)#1,727 |
| 59. | Deer River | 14.2% | 3.2%(+11.0)#59 | 3.9%(+10.3)#1,768 |
| 60. | Echo | 14.2% | 3.2%(+11.0)#60 | 3.9%(+10.3)#1,787 |
| 61. | Lake Bronson | 14.2% | 3.2%(+11.0)#61 | 3.9%(+10.3)#1,790 |
| 62. | Georgetown | 14.2% | 3.2%(+11.0)#62 | 3.9%(+10.3)#1,791 |
| 63. | Mazeppa | 13.8% | 3.2%(+10.6)#63 | 3.9%(+9.90)#1,832 |
| 64. | Greenwood | 13.8% | 3.2%(+10.6)#64 | 3.9%(+9.90)#1,833 |
| 65. | Lyle | 13.7% | 3.2%(+10.5)#65 | 3.9%(+9.80)#1,847 |
| 66. | Clara City | 13.1% | 3.2%(+9.90)#66 | 3.9%(+9.20)#1,932 |
| 67. | Butterfield | 12.9% | 3.2%(+9.70)#67 | 3.9%(+9.00)#1,966 |
| 68. | Shorewood | 12.4% | 3.2%(+9.20)#68 | 3.9%(+8.50)#2,036 |
| 69. | Babbitt | 12.4% | 3.2%(+9.20)#69 | 3.9%(+8.50)#2,053 |
| 70. | Hamburg | 12.4% | 3.2%(+9.20)#70 | 3.9%(+8.50)#2,063 |
| 71. | Badger | 12.4% | 3.2%(+9.20)#71 | 3.9%(+8.50)#2,065 |
| 72. | Tenstrike | 12.4% | 3.2%(+9.20)#72 | 3.9%(+8.50)#2,070 |
| 73. | Roseau | 12.1% | 3.2%(+8.90)#73 | 3.9%(+8.20)#2,101 |
| 74. | Audubon | 12.0% | 3.2%(+8.80)#74 | 3.9%(+8.10)#2,123 |
| 75. | Eagle Lake | 11.9% | 3.2%(+8.70)#75 | 3.9%(+8.00)#2,131 |
| 76. | Winnebago | 11.6% | 3.2%(+8.40)#76 | 3.9%(+7.70)#2,186 |
| 77. | Stacy | 11.5% | 3.2%(+8.30)#77 | 3.9%(+7.60)#2,202 |
| 78. | New London | 11.4% | 3.2%(+8.20)#78 | 3.9%(+7.50)#2,225 |
| 79. | Isle | 11.4% | 3.2%(+8.20)#79 | 3.9%(+7.50)#2,226 |
| 80. | Cleveland | 11.1% | 3.2%(+7.90)#80 | 3.9%(+7.20)#2,286 |
| 81. | Jeffers | 11.1% | 3.2%(+7.90)#81 | 3.9%(+7.20)#2,298 |
| 82. | Pine Springs | 11.0% | 3.2%(+7.80)#82 | 3.9%(+7.10)#2,330 |
| 83. | Brooklyn Center | 10.8% | 3.2%(+7.60)#83 | 3.9%(+6.90)#2,347 |
| 84. | Cottonwood | 10.7% | 3.2%(+7.50)#84 | 3.9%(+6.80)#2,381 |
| 85. | Bemidji | 10.6% | 3.2%(+7.40)#85 | 3.9%(+6.70)#2,388 |
| 86. | Nisswa | 10.4% | 3.2%(+7.20)#86 | 3.9%(+6.50)#2,440 |
| 87. | Glenville | 9.9% | 3.2%(+6.70)#87 | 3.9%(+6.00)#2,585 |
| 88. | Hayfield | 9.5% | 3.2%(+6.30)#88 | 3.9%(+5.60)#2,693 |
| 89. | Evansville | 9.3% | 3.2%(+6.10)#89 | 3.9%(+5.40)#2,770 |
| 90. | Eagan | 9.1% | 3.2%(+5.90)#90 | 3.9%(+5.20)#2,803 |
| 91. | Jasper | 9.1% | 3.2%(+5.90)#91 | 3.9%(+5.20)#2,832 |
| 92. | Rock Creek | 9.0% | 3.2%(+5.80)#92 | 3.9%(+5.10)#2,860 |
| 93. | Hartland | 9.0% | 3.2%(+5.80)#93 | 3.9%(+5.10)#2,875 |
| 94. | Duluth | 8.9% | 3.2%(+5.70)#94 | 3.9%(+5.00)#2,883 |
| 95. | Long Lake | 8.8% | 3.2%(+5.60)#95 | 3.9%(+4.90)#2,929 |
| 96. | Hopkins | 8.7% | 3.2%(+5.50)#96 | 3.9%(+4.80)#2,945 |
| 97. | Raymond | 8.6% | 3.2%(+5.40)#97 | 3.9%(+4.70)#2,993 |
| 98. | Stephen | 8.6% | 3.2%(+5.40)#98 | 3.9%(+4.70)#2,995 |
| 99. | Waite Park | 8.5% | 3.2%(+5.30)#99 | 3.9%(+4.60)#3,012 |
| 100. | Roseville | 8.3% | 3.2%(+5.10)#100 | 3.9%(+4.40)#3,067 |
Common Questions
What are the Top 10 Cities with the Highest Unemployment Rate Amomg Seniors Over the Age of 65 in Minnesota?
Top 10 Cities with the Highest Unemployment Rate Amomg Seniors Over the Age of 65 in Minnesota are:
What city has the Highest Unemployment Rate Amomg Seniors Over the Age of 65 in Minnesota?
Genola has the Highest Unemployment Rate Amomg Seniors Over the Age of 65 in Minnesota with 100.0%.
What is the Unemployment Rate Amomg Seniors Over the Age of 65 in the State of Minnesota?
Unemployment Rate Amomg Seniors Over the Age of 65 in Minnesota is 3.2%.
What is the Unemployment Rate Amomg Seniors Over the Age of 65 in the United States?
Unemployment Rate Amomg Seniors Over the Age of 65 in the United States is 3.9%.