Cities with the Highest Unemployment Rate Amomg Seniors Over the Age of 65 in Nevada

RELATED REPORTS & OPTIONS

Highest Unemployment | Senior > 65
Population
Families and Households
Female Fertility
Female Fertility (Unmarried)
Race (Community Size)
Race (Percentage)
Ancestry (Community Size)
AfghanAfricanAlaska NativeAlaskan AthabascanAlbanianAleutAlsatianAmericanApacheArabArapahoArgentineanArmenianAssyrian / Chaldean / SyriacAustralianAustrianBahamianBangladeshiBarbadianBasqueBelgianBelizeanBermudanBhutaneseBlackfeetBolivianBrazilianBritishBritish West IndianBulgarianBurmeseCajunCambodianCanadianCape VerdeanCarpatho RusynCelticCentral AmericanCentral American IndianCherokeeCheyenneChickasawChileanChineseChippewaChoctawColombianColvilleComancheCosta RicanCreeCreekCroatianCrowCubanCypriotCzechCzechoslovakianDanishDelawareDominicanDutchDutch West IndianEastern EuropeanEcuadorianEgyptianEnglishEstonianEthiopianEuropeanFijianFilipinoFinnishFrenchFrench American IndianFrench CanadianGermanGerman RussianGhanaianGreekGuamanian / ChamorroGuatemalanGuyaneseHaitianHmongHonduranHopiHoumaHungarianIcelanderIndian (Asian)IndonesianInupiatIranianIraqiIrishIroquoisIsraeliItalianJamaicanJapaneseJordanianKenyanKiowaKoreanLaotianLatvianLebaneseLiberianLithuanianLumbeeLuxembourgerMacedonianMalaysianMalteseMarshalleseMenomineeMexicanMexican American IndianMongolianMoroccanNative HawaiianNavajoNepaleseNew ZealanderNicaraguanNigerianNorthern EuropeanNorwegianOkinawanOsageOttawaPaiutePakistaniPalestinianPanamanianParaguayanPennsylvania GermanPeruvianPimaPolishPortuguesePotawatomiPuebloPuerto RicanPuget Sound SalishRomanianRussianSalvadoranSamoanScandinavianScotch-IrishScottishSeminoleSenegaleseSerbianShoshoneSierra LeoneanSiouxSlavicSlovakSloveneSomaliSouth AfricanSouth AmericanSouth American IndianSoviet UnionSpaniardSpanishSpanish AmericanSpanish American IndianSri LankanSubsaharan AfricanSudaneseSwedishSwissSyrianTaiwaneseThaiTlingit-HaidaTohono O'OdhamTonganTrinidadian and TobagonianTsimshianTurkishU.S. Virgin IslanderUgandanUkrainianUruguayanUteVenezuelanVietnameseWelshWest IndianYakamaYaquiYugoslavianYumanYup'ikZimbabwean
Ancestry (Percentage)
AfghanAfricanAlaska NativeAlaskan AthabascanAlbanianAleutAlsatianAmericanApacheArabArapahoArgentineanArmenianAssyrian / Chaldean / SyriacAustralianAustrianBahamianBangladeshiBarbadianBasqueBelgianBelizeanBermudanBhutaneseBlackfeetBolivianBrazilianBritishBritish West IndianBulgarianBurmeseCajunCambodianCanadianCape VerdeanCarpatho RusynCelticCentral AmericanCentral American IndianCherokeeCheyenneChickasawChileanChineseChippewaChoctawColombianColvilleComancheCosta RicanCreeCreekCroatianCrowCubanCypriotCzechCzechoslovakianDanishDelawareDominicanDutchDutch West IndianEastern EuropeanEcuadorianEgyptianEnglishEstonianEthiopianEuropeanFijianFilipinoFinnishFrenchFrench American IndianFrench CanadianGermanGerman RussianGhanaianGreekGuamanian / ChamorroGuatemalanGuyaneseHaitianHmongHonduranHopiHoumaHungarianIcelanderIndian (Asian)IndonesianInupiatIranianIraqiIrishIroquoisIsraeliItalianJamaicanJapaneseJordanianKenyanKiowaKoreanLaotianLatvianLebaneseLiberianLithuanianLumbeeLuxembourgerMacedonianMalaysianMalteseMarshalleseMenomineeMexicanMexican American IndianMongolianMoroccanNative HawaiianNavajoNepaleseNew ZealanderNicaraguanNigerianNorthern EuropeanNorwegianOkinawanOsageOttawaPaiutePakistaniPalestinianPanamanianParaguayanPennsylvania GermanPeruvianPimaPolishPortuguesePotawatomiPuebloPuerto RicanPuget Sound SalishRomanianRussianSalvadoranSamoanScandinavianScotch-IrishScottishSeminoleSenegaleseSerbianShoshoneSierra LeoneanSiouxSlavicSlovakSloveneSomaliSouth AfricanSouth AmericanSouth American IndianSoviet UnionSpaniardSpanishSpanish AmericanSpanish American IndianSri LankanSubsaharan AfricanSudaneseSwedishSwissSyrianTaiwaneseThaiTlingit-HaidaTohono O'OdhamTonganTrinidadian and TobagonianTsimshianTurkishU.S. Virgin IslanderUgandanUkrainianUruguayanUteVenezuelanVietnameseWelshWest IndianYakamaYaquiYugoslavianYumanYup'ikZimbabwean
Immigrant Origin (Total)
AfghanistanAfricaAlbaniaArgentinaArmeniaAsiaAustraliaAustriaAzoresBahamasBangladeshBarbadosBelarusBelgiumBelizeBoliviaBosnia and HerzegovinaBrazilBulgariaBurma / MyanmarCabo VerdeCambodiaCameroonCanadaCaribbeanCentral AmericaChileChinaColombiaCongoCosta RicaCroatiaCubaCzechoslovakiaDenmarkDominicaDominican RepublicEastern AfricaEastern AsiaEastern EuropeEcuadorEgyptEl SalvadorEnglandEritreaEthiopiaEuropeFijiFranceGermanyGhanaGreeceGrenadaGuatemalaGuyanaHaitiHondurasHong KongHungaryIndiaIndonesiaIranIraqIrelandIsraelItalyJamaicaJapanJordanKazakhstanKenyaKoreaKuwaitLaosLatin AmericaLatviaLebanonLiberiaLithuaniaMalaysiaMexicoMicronesiaMiddle AfricaMoldovaMoroccoNepalNetherlandsNicaraguaNigeriaNorth MacedoniaNorthern AfricaNorthern EuropeNorwayOceaniaPakistanPanamaPeruPhilippinesPolandPortugalRomaniaRussiaSaudi ArabiaScotlandSenegalSerbiaSierra LeoneSingaporeSomaliaSouth AfricaSouth AmericaSouth Central AsiaSouth Eastern AsiaSouthern EuropeSpainSri LankaSt. Vincent and the GrenadinesSudanSwedenSwitzerlandSyriaTaiwanThailandTrinidad and TobagoTurkeyUgandaUkraineUruguayUzbekistanVenezuelaVietnamWest IndiesWestern AfricaWestern AsiaWestern EuropeYemenZaireZimbabwe
Immigrant Origin (Percentage)
AfghanistanAfricaAlbaniaArgentinaArmeniaAsiaAustraliaAustriaAzoresBahamasBangladeshBarbadosBelarusBelgiumBelizeBoliviaBosnia and HerzegovinaBrazilBulgariaBurma / MyanmarCabo VerdeCambodiaCameroonCanadaCaribbeanCentral AmericaChileChinaColombiaCongoCosta RicaCroatiaCubaCzechoslovakiaDenmarkDominicaDominican RepublicEastern AfricaEastern AsiaEastern EuropeEcuadorEgyptEl SalvadorEnglandEritreaEthiopiaEuropeFijiFranceGermanyGhanaGreeceGrenadaGuatemalaGuyanaHaitiHondurasHong KongHungaryIndiaIndonesiaIranIraqIrelandIsraelItalyJamaicaJapanJordanKazakhstanKenyaKoreaKuwaitLaosLatin AmericaLatviaLebanonLiberiaLithuaniaMalaysiaMexicoMicronesiaMiddle AfricaMoldovaMoroccoNepalNetherlandsNicaraguaNigeriaNorth MacedoniaNorthern AfricaNorthern EuropeNorwayOceaniaPakistanPanamaPeruPhilippinesPolandPortugalRomaniaRussiaSaudi ArabiaScotlandSenegalSerbiaSierra LeoneSingaporeSomaliaSouth AfricaSouth AmericaSouth Central AsiaSouth Eastern AsiaSouthern EuropeSpainSri LankaSt. Vincent and the GrenadinesSudanSwedenSwitzerlandSyriaTaiwanThailandTrinidad and TobagoTurkeyUgandaUkraineUruguayUzbekistanVenezuelaVietnamWest IndiesWestern AfricaWestern AsiaWestern EuropeYemenZaireZimbabwe
Income
Income (Families)
Income (Households)
Poverty
Poverty (Families)
Unemployment
Employment Occupations
Employment Industries
Employer Class
Commute Time
Commute Means
School Enrollment
Education by Degree Field
Occupancy
Finances
Physical Characteristics
Nevada
Compare Cities
Comparison Subject

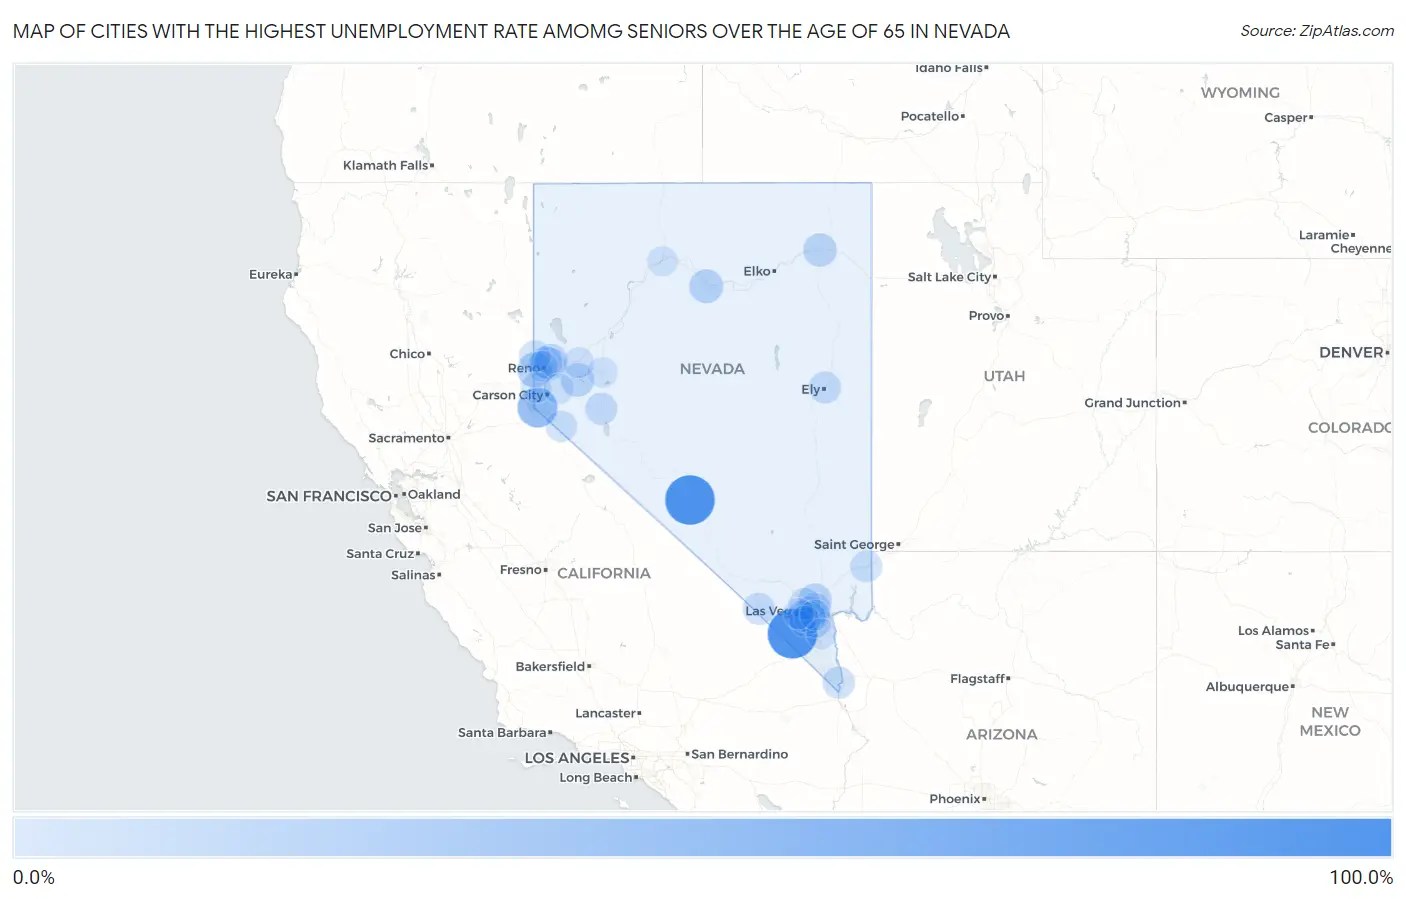
Map of Cities with the Highest Unemployment Rate Amomg Seniors Over the Age of 65 in Nevada

0.0%
100.0%
Cities with the Highest Unemployment Rate Amomg Seniors Over the Age of 65 in Nevada Map

Cities with the Highest Unemployment Rate Amomg Seniors Over the Age of 65 in Nevada

City Senior Unemployment vs State vs National
1.Goldfield100.0%7.6%(+92.4)#13.9%(+96.1)#50
2.Goodsprings100.0%7.6%(+92.4)#23.9%(+96.1)#59
3.Round Hill Village48.8%7.6%(+41.2)#33.9%(+44.9)#305
4.Verdi25.3%7.6%(+17.7)#43.9%(+21.4)#847
5.Battle Mountain18.5%7.6%(+10.9)#53.9%(+14.6)#1,280
6.Wells16.6%7.6%(+9.00)#63.9%(+12.7)#1,475
7.Silver Springs16.2%7.6%(+8.60)#73.9%(+12.3)#1,542
8.North Las Vegas15.1%7.6%(+7.50)#83.9%(+11.2)#1,662
9.Henderson12.4%7.6%(+4.80)#93.9%(+8.50)#2,030
10.Sparks11.6%7.6%(+4.00)#103.9%(+7.70)#2,172
11.Spanish Springs11.5%7.6%(+3.90)#113.9%(+7.60)#2,190
12.Sun Valley10.7%7.6%(+3.10)#123.9%(+6.80)#2,361
13.Winchester10.5%7.6%(+2.90)#133.9%(+6.60)#2,404
14.Schurz9.9%7.6%(+2.30)#143.9%(+6.00)#2,582
15.Sunrise Manor9.3%7.6%(+1.70)#153.9%(+5.40)#2,735
16.Laughlin9.3%7.6%(+1.70)#163.9%(+5.40)#2,751
17.Paradise8.8%7.6%(+1.20)#173.9%(+4.90)#2,912
18.Pahrump8.8%7.6%(+1.20)#183.9%(+4.90)#2,916
19.Ely8.8%7.6%(+1.20)#193.9%(+4.90)#2,926
20.Las Vegas8.2%7.6%(+0.600)#203.9%(+4.30)#3,115
21.Mesquite8.0%7.6%(+0.400)#213.9%(+4.10)#3,184
22.Carson7.3%7.6%(-0.300)#223.9%(+3.40)#3,445
23.Cold Springs7.2%7.6%(-0.400)#233.9%(+3.30)#3,489
24.Spring Valley5.6%7.6%(-2.00)#243.9%(+1.70)#4,265
25.Topaz Ranch Estates5.4%7.6%(-2.20)#253.9%(+1.50)#4,412
26.Enterprise4.7%7.6%(-2.90)#263.9%(+0.800)#4,799
27.Summerlin South4.4%7.6%(-3.20)#273.9%(+0.500)#5,055
28.Reno3.0%7.6%(-4.60)#283.9%(-0.900)#6,120
29.Fernley2.8%7.6%(-4.80)#293.9%(-1.10)#6,308
30.Incline Village2.5%7.6%(-5.10)#303.9%(-1.40)#6,540
31.Whitney1.9%7.6%(-5.70)#313.9%(-2.00)#6,926
32.Fallon1.8%7.6%(-5.80)#323.9%(-2.10)#7,023
33.Dayton1.4%7.6%(-6.20)#333.9%(-2.50)#7,236
34.Winnemucca1.1%7.6%(-6.50)#343.9%(-2.80)#7,403
35.Boulder City1.0%7.6%(-6.60)#353.9%(-2.90)#7,435

Common Questions

What are the Top 10 Cities with the Highest Unemployment Rate Amomg Seniors Over the Age of 65 in Nevada?
Top 10 Cities with the Highest Unemployment Rate Amomg Seniors Over the Age of 65 in Nevada are:
#1
100.0%
#2
100.0%
#3
48.8%
#4
25.3%
#5
18.5%
#6
16.6%
#7
16.2%
#8
15.1%
#9
12.4%
#10
11.6%
What city has the Highest Unemployment Rate Amomg Seniors Over the Age of 65 in Nevada?
Goldfield has the Highest Unemployment Rate Amomg Seniors Over the Age of 65 in Nevada with 100.0%.
What is the Unemployment Rate Amomg Seniors Over the Age of 65 in the State of Nevada?
Unemployment Rate Amomg Seniors Over the Age of 65 in Nevada is 7.6%.
What is the Unemployment Rate Amomg Seniors Over the Age of 65 in the United States?
Unemployment Rate Amomg Seniors Over the Age of 65 in the United States is 3.9%.